Search Results for: thorn group
-
What are Tim Kelley’s insights into Cabcharge’s prospects?
Roger Montgomery
September 25, 2012

Do Sedgman (SMD), Decmil Group (DCG), cochlear (COH), Seek (SEK), IAG (IAG), Resolute Mining (RSG), Magellan Financial Group (MFG), Syrah Resources (SYR), ASG (ASZ), Goodman Group (GMG), Silex Systems (SLX), AMP (AMP) or Service Stream (SSM) achieve Roger’s and Tim’s coveted A1 grade? Watch this edition of Sky Business’ Your Money Your Call broadcast 25 September 2012 program now to find out, and also learn Tim’s insights to the outlook for Cabcharge (CAB). Watch here.
by Roger Montgomery Posted in Companies, TV Appearances.
- save this article
- POSTED IN Companies, TV Appearances.
-
What are David Buckland’s insights into the future of Australian retail?
Roger Montgomery
September 20, 2012
Do Silex Systems (SLX), Condor Blanco Mines (CDB), Codan (CDA), Webjet (WEB), Tasman Resources (TAS), M2 Telecommunications (MTU), Magellan (MPG), Iluka Resources (ILU), Arrium (ARI), TPG (TPM), ASG Group (ASZ), Incitec Pivot (IPL) and Sirius Resources (SIR) and achieve the Montgomery coveted A1 grade? Watch this edition of Sky Business’ Your Money Your Call broadcast 20 September 2012 now to find out, and also learn David’s insights into the issues facing Australian retail. Watch here.
by Roger Montgomery Posted in Companies, TV Appearances.
- save this article
- POSTED IN Companies, TV Appearances.
-

Legend builds its reputation
Roger Montgomery
September 18, 2012
Some smaller manufacturers have good momentum in a tough market.
The media often portrays Australia’s manufacturing sector as on its knees. The high dollar, rising wage and input costs, and soft demand are clearly taking a toll. But to suggest all manufacturers are struggling is wrong. Some smaller listed manufacturers are performing well.
Transport parts manufacturer Maxitrans Industries almost tripled net profit to $12.3 million in FY2012 and its shares have rallied from 40 cents in January to 79 cents. Another parts manufacturer, Supply Network, said in July it expected full-year earnings before interest and tax (EBIT) to rise $2.2 million to $6 million. Its shares have almost doubled this year to $1.26.
Engineering solutions manufacturer, Legend Corporation, also has good momentum. In August it reported full-year net profit after tax (NPAT) grew 18.2 per cent to $9.4 million, for its fourth consecutive year of profit growth. Legend’s total shareholder return over one year (including dividends) is 8.1 per cent. Over three years, the average annual total shareholder return is 49 per cent.
by Roger Montgomery Posted in Manufacturing, Whitepapers.
- 7 Comments
- save this article
- 7
- POSTED IN Manufacturing, Whitepapers.

-
Where does Roger see the best opportunities?
Roger Montgomery
September 12, 2012
Do Regis Resources (RRL), Silverlake Resources (SLR), Decmil Group (DCG), BC Iron (BCI), Corporate Travel Management (CTD), Sirius Resources (SIR), Sirtex Medical, SRX), Rio Tinto (RIO), Energy Action (EAX), ASG Group (ASZ), Seek (SEK) and Eastland Medical (EMS) makeRoger’s coveted A1 grade? Watch this edition of Sky Business’ Your Money Your Call broadcast 12 September 2012 to find out, and also learn Roger’s insights into the best opportunities. Watch here.
by Roger Montgomery Posted in Insightful Insights, TV Appearances.
- save this article
- POSTED IN Insightful Insights, TV Appearances.
-
What are Russell Muldoon’s latest insights into Australian residential construction?
Russell Muldoon
August 30, 2012
Do Gerard Lighting Group (GLG), Woodside Petroleum (WPL), Vocus Communications (VOC), CSL (CSL), Credit Corporation (CCP), Silex Systems (SLX), Boart Longyear (BLY), Mineral Holdings (MIN) and NRW Holdings (NWH) make the coveted Skaffold A1 score? Watch this edition of Sky Business’ Your Money Your Call broadcast 25 July 2012 to find out, and also learn Russell’s thoughts on the state of the Australian residential construction market. Watch here.
by Russell Muldoon Posted in Companies, Insightful Insights, Intrinsic Value, TV Appearances.
-
Exactly how clever is Texas Pacific Group?
Roger Montgomery
August 15, 2012
With the recent bid announcement regarding Billabong, Roger Montgomery discusses with Ross Greenwood how clever he believes TPG is, particularly as it relates to the long-term performance of entities they sell. Listen here.
This discussion was broadcast 25 July 2012 on Radio 2gb.
by Roger Montgomery Posted in Companies, Insightful Insights, Radio.
- save this article
- POSTED IN Companies, Insightful Insights, Radio.
-
Leighton’s Failures Could Savage Balance Sheet
Roger Montgomery
August 13, 2012
Leighton’s half yearly results grabbed headlines when they reported a 66 per cent drop in interim net profit to $114.6 million, at the low end of guidance.
For 24 months, we have been warning investors about the company’s difficulties in collecting receivables in the Middle East and the likely writedowns of the Desal Plant in Victoria and the Brisbane Airport Link. And now a string of results are revealing that these issues are savaging the company’s profits which for the most recent half, were down from $340 million in Leighton’s previous first half, the six months to December 31, 2011.
But the problems may not be over. The early traffic numbers out of Airport Link are much worse than expected – even though the opening of the link has allowed drivers on the road for free – the project may go bust like other toll roads before it. We believe Leighton’s have a deferred equity contribution requirement of $200 million that may still be required to be paid.
In the Middle East, Leighton’s has not been paid for a number of projects and they aren’t small. Imagine building an equestrian centre (see image) and failing to be paid. It would send most companies bust.
by Roger Montgomery Posted in Companies, Insightful Insights.
- 4 Comments
- save this article
- 4
- POSTED IN Companies, Insightful Insights.
-
The Good, The Bad and the Ugly
Roger Montgomery
August 10, 2012
 BREVILLE (BRG)
Both Breville Group (BRG) and Flexigroup (FXL) saw solid gains yesterday.
Breville’s share price hit new highs in terms of price (not that we’re looking of course) in anticipation of a solid result. EBITDA was previously forecast to be in the range of $65 to $67 million but not long ago the company upgraded guidance to $71 to $72 million. Investors who are focusing on depressed local retailing and consumption need to have a look at the US retailing index which is up more than 275% since the March 2009 lows. More than half the company’s revenues now come from outside Australia, with roughly a third coming from North America, and growing despite the weak US economy.
FLEXIGROUP (FXL)
Two days ago, Flexigroup announced that it had successfully priced AUD255m of asset-backed securities, supported by a pool of Australian unsecured, retail, “no interest ever” payment plans, originated by Certegy Ezi-Pay Pty Ltd (“Certegy”), a wholly owned subsidiary of FlexiGroup Limited.
This securitisation of Certegy receivables is part of FlexiGroup’s strategy to diversifying its funding sources by regularly accessing wholesale capital markets. The term securitisation is FlexiGroup’s third and its also the second rated by Moody’s.
According to Spencer Wilson, Associate Director in Fitch’s Structured Finance team, “A valuable tool in Certegy’s underwriting strategy is its access to large volumes of historical data, which is then used to identify key risks across product types, demographics and borrower types,” adding “This transaction follows on from the Flexi 2011-1 deal, with notable features being the short weighted average life of the receivables, small contract size and significant levels of excess that are available to offset potential losses”.
by Roger Montgomery Posted in Value.able.
- 4 Comments
- save this article
- 4
- POSTED IN Value.able.
-
Living in a Material World
Roger Montgomery
August 6, 2012
When pop singer Madonna wrote Material Girl in 1985 I suspect she wasn’t thinking about BHP or FMG. But nearly thirty years later that is exactly the material world that will determine whether you retire materially well-off or not. BHP’s share price has fallen 30 per cent in the last twelve months so it’s easy to say the shares are now cheap but does BHP represent value or is it a value trap? What I can tell you is that consulting geologists who spend their days planning exploration programs for large miners are in no doubt about whether we have seen the peak of the resources boom.
Six months ago these experts were being told by their major-miner clients that money is not an issue, that the issues were resourcing – labour and drill rigs. “Just make it happen” the geologists were being told “there’s $80 billion of planned infrastructure spending in the pipeline”.
by Roger Montgomery Posted in Whitepapers.
- 8 Comments
- save this article
- 8
- POSTED IN Whitepapers.
-
What are Roger’s insights into the Banking sector?
Roger Montgomery
August 1, 2012
Do Newcrest Mining (NCM), Breville Group (BRG), Commonweath Bank (CBA), Westpac (WBC), Wotif.com (WTF) and CSL (CSL) make Roger’s coveted A1 grade? Watch this edition of Sky Business’ Your Money Your Call broadcast 1 August 2012 to find out, and also learn Roger’s current insights into the Mining Services sector. Watch here
by Roger Montgomery Posted in Companies, Insightful Insights, Intrinsic Value, TV Appearances.
-
Are Chinese construction lay-offs a bad omen for Iron Ore prices?
Roger Montgomery
July 9, 2012

Sani Group, China’s biggest maker of construction machines has announced a cut to its workforce.
Given lay-offs did not occur in the down cycles of 2005 and 2008, this is a clear sign some pain is being experienced in China’s industrial heartland.
Sany’s 60,000 staff produces concrete machinery, excavators, cranes, pile drivers and road machinery. Its revenue exceeds RMB80 billion or US$12.5 billion.
With the tripling in demand for machinery in China since 2001, it appears Sany has recently been selling machines on generous credit terms. As a result the machinery maker saw its net receivables double over 2011.
The slowdown in Chinese construction activity is not a good omen for the iron-ore price, currently US$135/tonne. China’s demand accounts for 63% of iron-ore’s global seaborne trade.
by Roger Montgomery Posted in Energy / Resources, Insightful Insights.
-
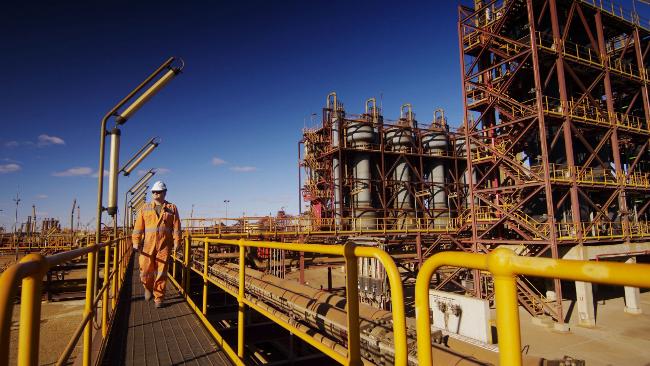
A lesson for us all
Roger Montgomery
July 1, 2012
Roger provides details of the sad decline of Hastie Group (HST) in this Money Magazine article for July 2012. Read here.
by Roger Montgomery Posted in Companies, In the Press, Investing Education.
- save this article
- POSTED IN Companies, In the Press, Investing Education.
-
What do the most widely held stocks in Australia all have in common?
Roger Montgomery
June 29, 2012
EXCLUSIVE CONTENT
subscribe for free
or sign in to access the articleby Roger Montgomery Posted in Financial Services, Skaffold, Value.able.
- 9 Comments
- save this article
- 9
- POSTED IN Financial Services, Skaffold, Value.able.
-
Is this a Thorny Investment?
Roger Montgomery
June 24, 2012
 We all know that retailing is doing it tough and there’s hardly bright lights on the horizon. (Of course it is always darkest just before the dawn but our experience is telling us that most analysts are scraping the bottom of the barrel for opportunities when scrounging around trying to pick up scraps of returns from post announcement arbitrage opportunities. Conversely, the frequency of observations in this space suggests those with plenty of spare cash reckon we are close to the bottom).
One business that also happens to be a retailer (as measured by current business unit revenues) and one we have previously owned is Thorn Group but its outperformance of the retail sector is unlikely to be sustained unless its investment in new products pays off.
(NB. Later in the week I will seek permission to give you some School Holiday reading – Michael’s 20-page Magnum Opus on TGA)
The picture at left should really be of the Tortoise from Aesop’s fable The Tortoise and The Hare. You will see why shortly…
It goes without saying that Australian retailers are doing it tough. But just how tough? Compare the share price performance of some household names in retail to the performance of the All Ordinaries index over the past 12 and 24 months.

The high Australian dollar, record outbound tourism, high petrol prices, rising utility costs, indebtedness, a slowing economy, cautious consumers and a structural shift rendering bricks-and-mortar retailers less competitive have seen earnings downgrades come in thick and fast amongst retailers. As well as being tough on the businesses and their managers, retailing has also been a tough place to be an investor.
But one company appears to be bucking the trend, in business terms; that company is Thorn Group (TGA). While the past 12 months have proven just as difficult for the company’s share price as they have for its contemporaries (perhaps not pure peers), it’s the 24-month performance of this business that sets it apart. And if a business does well, the shares usually follow.

Many retailers have seen their share prices decline 40-50%, yet Thorn has delivered an impressive two-year return to shareholders.
Better still, the business continues to do well. In its latest annual report, released last week, Thorn Group reported NPAT up 26.4% (EPS was up 14% post capital raising). A retailer whose bottom line is actually growing is rare in the current environment; compare Thorn with forecasts for JB Hi-Fi (JBH), Harvey Norman (HVN), Myer (MYR) and David Jones (DJS) in 2012.

Tomorrow’s returns to shareholders however will be dependent on how the business performs in the future. So the question, of course, is whether this outperformance is sustainable? I always look for businesses with ‘bright prospects’.
A quick look under the hood reveals Thorn’s Revenue (first column each year) and EBIT (second column each year) breakdown. The key to the group’s prospects – even after the recent acquisition of NCML, which contributed 20% of EBIT growth – is the rental segment, which represents 92.5% of EBIT. It’s also identified by management as the company’s ‘core’ operations.

Clearly, given its contribution to the bottom line, it is the rental segment (not Cash First, Equipment Finance or NCML) that will help identify whether or not the business’ prospects are good. We appreciate that the other segments will/may grow but the company’s slow and steady organic approach to growth will ensure it is the prospects for the Rental/Retail business that determine investor returns in the foreseeable future). In this segment, we find Radio Rentals and Rentlo.
‘Consumer rental operations’ would be an apt description for this segment, which is responsible for the retailing of browngoods, whitegoods, PCs, furniture products and other goods such as gym equipment. The revenue breakdown by product and change in product mix is estimated as follows.

The ‘change’ column raises an eyebrow for me. Over the last two to three years, the rental segment of Thorn has experienced very strong customer growth, driven in the main by its $1 ‘Rent-Try-Buy’ promotion. High single-digit growth rates have been produced across the board.
Recently, however, this rate has fallen to the low single-digit rate of 3.1%, and as can be seen in four out of five product groups, growth is negative, flat or marginal. The hero in the product mix, however, is clearly furniture but in my observation, heroes eventually come unstuck.
I reckon the growth in furniture highlights the fact that consumers tend to ‘rent’ higher ticket items. Deflation in electronics means that the decision to buy over renting is a far less taxing one. The result is more people buying the laptop and LED TV versus renting. Indeed, much has changed in retailing because that which was once aspirational is now disposable. I like that phrase and have now trademarked it!
Couple the low rates of growth with customer churn and an increase in impairment charges on the rental book and we have a stronger case building for a period of muted to possibly negative growth. This is only offset if the company’s aim to extend furniture to outdoor product ranges and extend to new brands (eg Apple) works sufficiently.
According to a recent company presentation, 44% of customers are retained when their old rental agreement matures. That is to say, these customers purchase another product under another contract. This implies that about 56% of all customers will drop off once their first purchase is fully paid. Whether the 44% that remain are upsold and the rate that they are replaced, determines the rate of growth.
In strong growth years, churn is easily offset by more customers entering the business than leaving. And given the strong growth in customers over the past few years, this has been the case.
But when growth rates fall – a sign of a tighter marketplace, changing consumer trends and a potential maturing business (remembering that Thorn grew strongly during the GFC) – churn becomes harder and harder to fight, and the status quo tougher and tougher, as well as more expensive, to maintain.
With an average 27-month contract term, and given strong growth from 2009 onwards, from here the business will likely experience a larger proportion of their 100,000 customer rental agreements coming to term and maturing. Prior comparative period (PCP) comparisons could look less attractive.
Unless that retention rate can be materially lifted, new customers coming in must continue to exceed customers exiting. With the trend into 2013 on the up, the outcome here is likely to be a much tougher battle and flat to slightly negative growth in the core business, which generates in excess of 90% of EBIT.
The key question, therefore, becomes: how long will it take for the investment in new products – Cash First, Equipment Finance and Kiosks – to begin paying off? This will be the next leg in business performance and if that occurs, the share price will, of course, eventually follow.
Thorn is a well-managed business and has a strong balance sheet, cash flow and management, with a track record of delivering new revenue streams through differentiated business models that, with the exception of the NCML acquisition pimple, has been organic. But until those new models begin to gain traction, on my analysis it looks as though the business has a tougher couple of years ahead of it.
Before I head off on holidays I will provide a link to Michael’s Magnum Opus (POST SCRIPT: SEE MICHAEL’S 20-PAGE SPECIAL IN THE COMMENTS BELOW) on TGA where he agrees generally with this conclusion stating:
“I think that Thorn’s growth will slow for 2013, do better in 2014, then experience an up-tick as initiatives like Cashfirst, Thorn Equipment Finance and individual expansion initiatives in Radio Rentals/Rentlo and NCML move from making losses, or small profits, to being acceptably profitable. EPS will grow, but nothing like the EPS CAGR of the last five years.”
And while outperformance over the rest of the retail sector has likely to come to end, the company is one I plan to keep a close eye on.
First Published May 2012. Posted by Roger Montgomery, Value.able author, Skaffold Chairman and Fund Manager, 24 June 2012.
To pre-register for the soon-to-be-released Montgomery retail fund visit www.montinvest.com and click the APPLY TO INVEST button. A Pre-Registration Form will appear and after completing it, be sure to select the button “Retail Investor < $500,000″. You will then receive an automated email from my office and be registered to receive the PDS/FSG and Information Booklet as soon as it’s received all of its approvals. If you decide to proceed and/or your advisor does, we look forward to working for you. If you are a planner or advisor or responsible for dealer group approved lists or you are an executive at a research house or ratings agency and would like to discuss next steps feel free to call the Mr David Buckland at the office on (02) 9692 5700. Investments can only be made through the PDS and a Financial Services Guide (‘FSG’) will also be available.
by Roger Montgomery Posted in Consumer discretionary.
- 18 Comments
- save this article
- 18
- POSTED IN Consumer discretionary.
-
New Retail Fund Coming Soon
Roger Montgomery
June 18, 2012

Click on image to enlarge
Recently Mercer released their 1 year fund manager tables to the end of May 2012 (see above table). We decided to compare our returns to the sixty -odd covered in the survey. The red line marks the return and relative ranking of the Montgomery [Private] Fund to those of other managers. If The Montgomery [private] Fund had been covered in the survey, it would rank No#2 all things being equal. The median manager return -9.3%.
As many of you know Montgomery Investment Management recently hired Mr David Buckland as CEO and Mr Tim Kelley as Head of Research. I have linked the Press Releases of their appointments with their names and you can simply click on their names above to see their backgrounds and credentials.
David has wasted no time preparing a new Product Disclosure Statement for The Montgomery Fund. The Montgomery Fund will be a Retail Fund that will continue in the value investing tradition already employed here with great success for the very small group of investors we work for in the wholesale The Montgomery [Private] Fund.
With the hiring of Mr David Buckland and Mr Tim Kelley we now have the capacity to offer the benefits of our unique value investing style to all investors for the first time. Of course investments will only be able to be made through the form that accompanies the Product Disclosure Statement, which will also disclose other material information such as fees and charges and personnel.
Prospective investors should seek and take personal professonal advice before making any investment decision.
At our meeting today, we discussed an anticipated August launch date as well as providing access to investment insights exclusively to The Montgomery Fund investors.
If you have been interested in investing but felt the $1 million minimum for The Montgomery [Private] Fund is not appropriate for your circumstances, then the retail The Montgomery Fund could be worth discussing with your adviser or accountant. We currently anticipate offering a minimum investment application of $25,000.
Once again please be sure to read the PDS in its entirety and seek and take personal professional advice.

I will soon be sending you correspondence to pre-register your interest.
If however you feel you might miss that correspondence, your email has recently changed or you will be away, you can pre-register at www.montinvest.com and click the APPLY TO INVEST button. The above form will appear and after completing it, be sure to select the button “Retail Investor < $500,000”.
You will then receive an automated email from my office and be registered to receive the PDS as soon as it’s received all of its approvals. If you decide to proceed and/or your advisor approves, we look forward to working for you.
If you are a planner or advisor or responsible for dealer group approved lists or you are an executive at a research house or ratings agency and would like to discuss next steps feel free to call the Mr David Buckland at the office on (02) 9692 5700.
Please Note: Investments can only be able to be made through the form that accompanies the Product Disclosure Statement, which will also disclose other material information such as fees and charges and personnel.
Posted by Roger Montgomery, Value.able author, Skaffold Chairman and Fund Manager, 18 June 2012.
by Roger Montgomery Posted in Intrinsic Value, Value.able.
- 40 Comments
- save this article
- 40
- POSTED IN Intrinsic Value, Value.able.
-
A useful Arb…
Roger Montgomery
June 14, 2012
 Amid news of Qantas’ latest conniptions and Spain’s arrival on the set of the great euro drama (Italy and France to enter stage right shortly), one Aussie company is quietly going about its business.
That business is ARB Corporation (ARP), and its compelling fundamentals are the reason we have held the company’s shares in the Montgomery Private Fund since inception.
Those fundamentals have also helped to produce acceptable results for Montgomery investors (See Figure 1) amid an otherwise manic, depressive market.
Guided by its founder, Roger Brown, ARB designs, manufactures and distributes accessories for 4WD and light commercial vehicles – something it has focused on solely and successfully for almost as long as I have been alive.
And while producing and selling accessories for 4WDs doesn’t sound like an overly exciting business, consider the fundamentals over the past 10 years.
Since 2002, ARB has managed to grow its after tax earnings from $8.36 million to $37.8 million – a compound growth rate of 18.25% per annum. This is a fantastic achievement and largely organic because it has required just $133.5 million of retained profits and equity – the latter from the issuance of options.
In 2002, $8.36 million profit was generated on $31.2 million of shareholders’ equity, generating a return to owners of 26.8%. Fast forward to 2011 and returns are equally impressive. $37.8 million is being generated on $129.3 million or 29.2%. Many businesses have also grown their profits over the same period of time, but it is far more often that growth has been ‘acquired’ and declining return on equity suggests those acquisitions have been expensive.
Fig. 1 Results are net of all fees.

As the business has grown and developed its economies of scale, returns have actually improved. This is a rare achievement in practice and a development which creates significant value for shareholders.
If you were a part owner of the business in 2002, your shares would have grown steadily in value (not share price) from $1.91 to $8.09. If you believe Benjamin Graham’s observation that in the long run, the market is a “weighing machine’, then you must agree that prices follow valuations over the long run. Provided you can see which businesses are able to increase their per share intrinsic value, there is no longer any need to try and predict share prices! Simply buy high-quality businesses – with rising intrinsic values – at discounts to that intrinsic value.
Figure 2 reveals the change in the ARB’s valuation mapped against its share price over the last decade.
Fig. 2 Skaffold Line ARB and its Intrinsic value 2002-2014*

*Source: www.Skaffold.com 2012-2014 valuations are estimates
(If you have been thinking about becoming a Skaffold member, having a chart like Fig 2 above for every listed Australian company and a chart that is updated automatically and daily coming up to a Greek election, a Spain bailout and a very crucial reporting season is more than just a little helpful. I find it essential. So if you are thinking about a membership to Skaffold, go to www.skaffold.com and take advantage of the 13-months-for-the-price-of-12 “It’s Time” celebration promotion (and be sure to chat to your accountant about any pre-June 30 tax benefits)).This represents a total value increase over the period of 353.93%. Including $1.76 in fully franked dividends, the business has generated a total return over the past 10 years of 446.1%. Suddenly selling bull bars gets a whole lot more exciting doesn’t it?
Fig. 3

ARB Corporation’s rising valuation and share price clearly reflect the high-quality nature of the business and superior investment fundamentals. You can understand why it’s something we have been attracted to for some time.
Last week we asked whether Thorn Group’s (TGA) recent outperformance was sustainable. The reason to ask is because it’s not the results of the past that will deliver returns to new shareholders, but whether the future matches that which is currently estimated.
To some extent, this question was answered for ARB by its management at the start of May – “The Board expects sales for the full year to be up by about 4% and for profit after tax to be in line with the previous year.”
While it is a slightly disappointing development – the market was expecting more – we think that any growth sans acquisitions in the current economic climate is not something to sneeze at. The business has faced challenging conditions this year following the Japanese earthquake, tsunami and Thailand floods, which together dramatically impacted the supply of new 4WDs. The key risk ahead is what proportion of their sales is impacted by declining iron ore prices feeding into a lower level of capex by mining companies.
Conversely, there is pent-up demand from a lack of vehicles being available for sale in the first half. May car sales data continued to show a strong rebound and indeed a record 38,000 new 4WDs sold out of a total 96,000 in total new cars in Australia. A record and, of course, ARB’s most important business segment.
Add to this the associated pent-up demand of accessories to fit out these new vehicles and what ARB is faced with is a current order book heading into the last three months of the financial year where demand is outstripping supply. An enviable position to be in.
Coupled with a highly capable management team who have not only controlled the businesses operating expenses at a time where sales and revenues were severely impacted, but have also used their conservatively managed and high quality balance sheet to continue expanding their production and distribution capacity to support future growth plans, we think the business has not hit its straps. And remember there are less than 50 stores worldwide.
Until our view changes, which is currently unlikely, this remains to us a business that is already succeeding in expanding overseas, a business that we will happily hold and a business for whom any share price weakness (provided intrinsic value’s remain unchanged) is a signal to accumulate more.
Posted by Roger Montgomery, Value.able author, Skaffold Chairman and Fund Manager, 14 June 2012.
by Roger Montgomery Posted in Companies.
- 36 Comments
- save this article
- 36
- POSTED IN Companies.
-
..and so it goes
Roger Montgomery
June 5, 2012
 As you already know, despite the enthusiasm for mining service companies back in April, we sold our holdings substantially and in some cases completely. We have not shared our peers’ – some of whom include themselves in the ‘value investing’ camp – enthusiasm for BHP. Our reasoning for this is our thesis regarding iron ore prices, which is unchanged from late last year.
Back then it was simply the classic investment response to higher prices. Iron Ore prices between 1985 and and 2004 have traded between $11 and $15 and in real terms since the 1920’s prices have traded between $30 and $45. In 2004 the price of iron ore started rallying and hit $187 in 2007.
Putting aside the fact that iron ore experts now ‘guess’ $140 is the new medium term price and $100 the long term price, the rally in price from 2004 to now has produced a huge investment boom and turned millionaires into billionaires as they revalue their reserves (or other bulls value them for them).
It follows that the investment boom will now produce additional supply. The impact of this additional supply cannot be anything but falling prices.
Well, that was our thesis. And then China began slowing down. We wrote about that too
If you have been a regular to the Insights Blog, you will be familiar with some of our recent thoughts on iron ore here:
April 3) http://rogermontgomery.com/mining-services-a-crowded-trade/
April 18) http://rogermontgomery.com/building-heaps-piles-at-bhp/
APril 11) http://rogermontgomery.com/will-china-demand-iron-or/
And you can watch this video I published here on December 8 last year:
Since July last year BHP is down 30% and RIO down 36%. Since April and early May they are down 15% and 20% respectively. Many investors are now thinking they are cheap. But there is the possibility of a classic Value Trap.
Forecast valuations may yet decline further, even if share prices bounce. Here’s our thoughts…
PORTFOLIO POINT: BHP and Rio’s review of capex programs represents a stark turnaround from comments made just two months ago, and it’s a worrying sign for the rest of the sector.
BHP is trading at three-year lows, Fortescue is down 17% from recent highs and Rio is visiting lows last seen in 2008. If you own shares in any of these companies, only Telstra would have saved your portfolio from a shellacking.
The big caps, however, are not the only stocks that have suffered. Over recent years, it is likely that you would have observed my interest in mining services. That interest was a product of the presence of value for money.
This is a sector I know well and have covered numerous times. I have discussed and brought listed businesses – including Decmil Group (DCG), Forge Group (FGE) and Matrix Composites & Engineering (MCE) – and IPOs – GR Engineering (GNG) and Maca (MLD) – to your attention.
This was mostly at a time when there was little market interest, despite their apparent growth profiles, quality aggregated balance sheets and (now with the exception of MCE) management.
Today, however, that story is very different and I find myself erring on the side of caution when it comes to ‘picks and shovels’.
Each week, a stronger case is building that a key growth engine for capex spending by our miners is slowing – that is, commodity prices are falling.
Take one commodity I have discussed recently: iron ore.
In 2010-11, world iron ore production grew 8.1% (or 227mt) to 2.80bt. Assuming similar growth levels in 2011-12, iron ore production will grow to 3.04bt, an increase of about 237mt. (In a classic supply response, BHP production is forecast to grow by 20%, Rio by 30% and FMG by 25%.)
And assuming China consumes 60% of global production again (highly optimistic), its demand would increase by 136.2mt. However, moderating growth means current estimates for China’s iron ore requirements are half this level. With few other countries growing or competing heavily with China, who will pick up that supply overhang in a low-growth environment?
By 2015, two entire Pilbara regions (700mt) in supply terms are estimated to come onto the market. It’s a far stretch to expect China to absorb 420mt (60%) of that.
The impact, I expect, is pressure on iron ore prices.
Many other commodities are looking like they are set to suffer a similar fate. Record prices over a decade have created an investment boom that is climaxing at a time when global demand is losing interest. And you need two to tango. When soaring supply meets softening demand, lower prices follow.
So what are the implications? Put simply, for those who dig stuff out of the ground and export it, margins and cash flow will be squeezed (a situation I have been monitoring closely and alerting readers to for at least six months). It’s why I haven’t bought BHP.
In previous periods, a revenue squeeze has been a precursor to capex plan deferrals or delays lasting years. Barely economical projects are shelved as miners focus instead on financing core (capital-intensive) operations, rather than aggressive growth targets.
Indeed, the 1990s was a very different period for miners, and those who serviced the mining sector barely made it onto investment radars. Companies struggled to cover their cost of capital and total annual capex was less than $20 billion for the entire mining industry.
Today, many miners are generating returns on equity in excess of 30% (‘super profits’?) and capex runs in excess of $60 billion per annum. Are such numbers maintainable forever? No. And if it can’t go on forever, it must stop.
Just a few days ago, BHP Billiton and Rio Tinto announced that they are re-evaluating their capital expenditure programs. These comments are in stark contrast to their latest financial reports and presentations made just two months ago.
In those reports, confidence was effervescent and the deployment of $40 billion in a global cash capex spree was on the cards. Today, as China’s growth rate slows and some investors lobby for a greater focus on cost control and returning funds to shareholders, tens of billions of dollars of an extensive development project pipeline is under review.
When the two leading businesses that account for about 35% of total industry investment start to make noise, it’s time to sit up and pay attention.
We are bound to see many other miners follow suit and the chorus is growing louder by the day. Citigroup conducted a survey in April and found that 50% of all miners were considering lowering their investment budgets.
That compares to less than 20% in January.
Figure 1. A picture tells a thousand words

At the start of the financial year, capital expenditure was forecast to rise 34%, with an increase of 18% in 2013.
The forecast today is for a rise of only 13% this year and a fall in 2013. This represents a material deterioration in market conditions in a very short period of time. All of this weighs on the ‘bright prospects’ that once surrounded those companies which service the miners.
This brings us back to Decmil, Forge and investing. I bought both of these businesses in the Montgomery [Private] Fund near its inception.
Forge is a business that has a significant exposure to second-tier miners, especially those expanding their iron ore operations. Decmil, on the other hand, has around 43% of its business exposed to resources and the balance to oil & gas.
While plenty of work is still forecast to be in the pipeline for mining services companies, there are also plenty of companies trying to win it.
If we are at the peak of the current capex cycle, this is as good as it gets in terms of margins for mining services businesses and also workloads.
With that in mind, and coupled with prices increasing to levels I deem attractive for what are businesses with high operating leverage, I have decided to read the writing on the wall and position our investments in a more conservative manner. I sold our Forge holding some weeks ago and also scaled back our holding of Decmil.
It is possible I am early to leave the party – the band is still playing. But the mining industry is bracing for a pullback in investment spending, as the biggest companies reassess their capital expenditure plans amid escalating costs and an uncertain growth outlook. I anticipate that analysts will revise their earnings forecasts lower for 2013 and beyond.
The valuations I look at in Skaffold will also fall, I expect, as those earnings revisions are fed through. Of course, I could also be completely wrong but I reckon the big mining companies’ historical predilections for over-paying for acquisitions (another reason I have been loath to invest) may just revisit them.
The combination of a contracting market and high operating leverage means I simply prefer the safety of cash. Better to be confident of a good return than hopeful of a great one.
This article was first published on May 16, 2012
by Roger Montgomery Posted in Energy / Resources, Insightful Insights, Intrinsic Value.
-
Your Exclusive Guide to Understanding Biotechs.
Roger Montgomery
May 31, 2012
Praveen has really put in some effort to bring this to you. Enjoy!
ANATOMY OF A BIOTECH by Praveen Jayarajan 1st May 2012
Investing in biotechnology companies is an inherently risky endeavour for many reasons, with many pundits of the view that the entire sector is highly speculative. But as with any such investment, the potential returns can be huge. However, the average investor, who may not be familiar with the terminology used in company reports, presentations, analyst coverage, and the media, may not have a great deal of understanding about the industry and what these companies actually do. In this article I am going to try and decode and de-jargon the industry and hopefully give you a better understanding of how to assess these companies.
Big Pharma vs Biotech
To begin with, we need to appreciate the traditional differences between a pharmaceutical and a biotechnology company. Traditionally, pharmaceutical companies, also now commonly referred to as “Big Pharma”, have been involved in small molecule therapies. What this means is that the drugs they produce are made from molecules that are relatively simple and small in size. These molecules are all chemically manufactured or synthesized by combining different compounds in a laboratory. They are also available in the form of an oral tablet or capsule, and can be easily absorbed into the bloodstream through the intestine. Once in the bloodstream they are able to penetrate different cells in the body due to their small size. An example is Lipitor, used to treat high cholesterol, made by Pfizer.
In contrast, biotechnology companies, also referred to as “Biotech”, have been involved in large molecule therapies called biologics that are based on molecules that are more complex and large in size. These molecules are manufactured using genetically modified living cells of microorganisms such as viruses and bacteria, as well as from human and animal sources. Biologics are usually administered via an injection or infusion, as they are too big to be absorbed when given orally. Once in the bloodstream they act in different ways to traditional drugs, including binding to receptors on the surface of cells rather than penetrating the cells. An example is Fluvax, which is the influenza vaccine, made by CSL.
The line between these two definitions has become increasingly blurred. In fact, these traditional definitions for Big Pharma and Biotech do not have as much relevance today. Biotech’s are now seen as smaller research and development companies, with Big Pharma taking the role of the larger company with the expertise and funding to progress a drug or biologic (in this article I will may also use the word “product” or “medication” interchangeably when referring to drugs and biologics) through the regulatory process and then take it into production and marketing. Examples of Big Pharma include Pfizer, Roche, GlaxoSmithKline, Novartis, Sanofi, and AstraZeneca. Note that there are also companies that can be loosely considered “Small Pharma” and “Big Biotech”.
The Patent Cliff
What is a patent? A government license that gives the holder exclusive rights to a process, design or new invention for a designated period of time. Applications for patents are usually handled by a government agency (taken from Investopedia).
The “patent cliff” refers to what happens to revenues when an original product’s patent expires. As this happens, in the case of Big Pharma, they face competition from similar drugs made by other companies at a fraction of the price. These drugs are called generics. Generic drug manufacturers need to prove that their version of the drug is bioequivalent to the original. That is, it must have the same active ingredient and have the same properties as the original, but it does not have to go through extensive clinical trials like the original. According to the IMAP Pharma and Biotech Industry Global Report (2011), original drugs can face a price erosion of 70% within months of going off patent. Furthermore, revenues of drugs going off patent between 2010 and 2014 will be ~ US$89.5 billion. A number of “blockbuster” drugs (drugs that have revenues greater than US$1 billion) are due to go off patent in the coming years. The world’s biggest selling drug Lipitor, went off patent towards the end of 2011.
With regards to biologics, the patent cliff issue still applies, off patent biologics are called biosimilars or follow-on biologics. The difference is that because biologics are complex molecules, it is much harder and more expensive to make a bioequivalent version, and the regulatory requirements are far more rigorous. The worldwide biosimilars market is still in its infancy, with only a handful on the market. Note that there are also “me-too” products, these have similar active ingredients and mechanism of action to the original product, and almost identical clinical outcome, but unlike generics/biosimilars, may have other benefits. This could be increased efficacy, a different profile of adverse affects, or lower costs.
Figure 1: Expected fall in revenues for Big Pharma

Source: Pharma 2020 Report PWC
The R&D Pipeline
The research and development (R&D) pipeline refers to the group of drugs or biologics that a particular company is aiming to take into production and market. Generally, the more products it is developing and the later they are in the development phase, the more likely it is that one of their products will eventually be produced and marketed. In the 1990s, the discovery of a raft of blockbuster drugs resulted in huge revenues for the companies now recognised as Big Pharma. However, in recent times the efficiency or rate of return on their R&D efforts have been declining, with less products in late-stage development, higher average costs to develop and bring a drug to market, and a dearth of blockbusters to replace the ones going off patent. As a result of this Big Pharma are looking for innovation in the form of new biologics from their brothers in Biotech.
Big Pharma and Biotech collaboration
There is now increasing partnership and merger & acquisition (M&A) activity between Big Pharma and Biotech. Both sides have something to gain in this collaboration. Big Pharma are able to grow their pipeline, and with Biotech able to get the necessary funding to continue their R&D. With partnerships or “in-licensing”, Big Pharma will usually enter into an agreement with a Biotech whereby the Biotech will receive an upfront payment, and then further “milestone” payments as they advance the development of the product. Once the product is on sale, the Biotech will also receive royalty payments. When Big Pharma partner with a Biotech that has a product in the very early stages of development, the Biotech is likely to receive a lower share of royalties, whereas if the partnership occurs at an advanced stage, the Biotech is more likely to receive a larger share of royalties. With M&A activity, Biotech’s are being bought out at significant premiums, with the best companies fielding several bids from cashed up and hungry Big Pharma’s.
Regulatory affairs
Across the world, in order for a Big Pharma or Biotech company to be able to market or sell it’s product, the product needs to have been approved by the relevant government regulatory agency in each region that it plans to sell the product. In the US, this is the Food and Drug Administration (FDA), and in Europe, Japan, and Australia, this is the European Medicines Agency (EMA), the Ministry of Health Labour & Welfare Japan, and the Therapeutic Goods Administration (TGA) respectively. The International Conference on Harmonisation (ICH) was a project that brought together the regulatory agencies in the US, Europe, and Japan with the view to harmonising the regulatory requirements across these regions and the world. The ICH developed guidelines for regulation that have been adopted by certain countries, or are very similar to existing guidelines in others. As such, once a product has been approved in one country, meeting regulatory requirements for approval in others can be relatively straightforward.
The US FDA approval process
The largest market in the world for drugs and biologics is the US. It is the Holy Grail if you like, which is why many international companies tailor their product development towards meeting the FDA requirements and getting FDA approval. The approval process can be broken down into different phases, as outlined below.
Pre-Clinical Phase: This phase begins after the discovery of new molecules, and is where new molecules are investigated and tested in the laboratory (in-vitro), on animals (in-vivo), or via computer simulation (in-silico). Once this phase is completed the company files an Investigational New Drug Application (IND).
Phase 1: Once the FDA has approved the IND, Phase 1 human testing begins. In this phase the product is tested on a small group of healthy individuals to assess it’s safety. This means testing to make sure it is not toxic or carcinogenic, and to determine appropriate doses. It is also assessed to see how it is broken down or metabolised by the body.
Phase 2: Here the product has been established as safe in humans and is now tested on a small group of individuals that are affected by the disease being targeted. This is done to see if the therapy actually works, as well as any short-term effects.
Phase 3: In this phase, often referred to as the late-stage in development, the product is tested on a much larger population. The trial is generally multicentre, double-blinded, randomised and placebo-controlled (i.e. a randomised controlled trial, RCT). This means that testing is conducted at different centres and neither the subject nor the physician know whether the actual product or a placebo is being given, and the allocation is completely randomised.
At the completion of Phase 3, if the product has been proven to be safe and effective, the company will apply for a New Drug Application (NDA) or Biological License Application (BLA). If this is accepted, the final product can be marketed.
Complete Response Letter (CRL): The FDA issues a CRL in response to an NDA/BLA. In essence it is a “please explain”, that requires the applicant to clarify issues that may relate to the product, including safety, efficacy, or manufacturing related issues. In some cases the issues are minor, in other cases they could results in rejection of the application.
Figure 2: US FDA approval process

Source: Next Generation Pharmaceutical
Special Protocol Assessment (SPA): This is granted to products in uncompleted Phase 3 trials that have design, clinical endpoints/outcomes, and statistical analyses that are acceptable for approval by the FDA. The SPA is an indication that if the trial goes to plan, the final product will be approved.
Prescription Drug User Fee Act Date (PDUFA Date): PDUFA is a law that allows the FDA to collect fees from product manufacturers in order to fund the approval process. The PDUFA Date refers to the deadline by which the FDA must either approve or reject an NDA/BLA. The FDA has 10 months to review new applications.
Fast Track / Accelerated Approval / Priority Review: The FDA grants a quicker approval for important products. Fast Track is for those that treat serious diseases (e.g. AIDS, Cancer) AND fill an unmet medical need (i.e. provide a treatment where nothing else exists, or that is superior to existing treatments). Fast Track designation enables eligibility for Accelerated Approval. Accelerated Approval involves using a surrogate endpoint, e.g. a laboratory measurement or physical sign used in a clinical trial as an indirect measure of clinical outcome (survival or symptom improvement). Priority Review is used when products offer again treatment where nothing else exists, or more superior treatment, but it can be for serious or non-serious diseases, and approval can be obtained within 6 months.
Orphan Product Status: Orphan product status or designation is granted to products that treat rare diseases or conditions. The orphan designation offers a number of advantages, including product tax credits, marketing incentives, and a period of exclusivity.
Phase 4: In this phase the product is already on the market and ongoing monitoring is undertaken to observe for any new short-term or long-term effects. In some cases new data has resulted in products being taken off the market, most notably in the case of the drug Vioxx marketed by Merck & Co. Vioxx was a widely used anti-inflammatory drug used to treat acute and chronic pain related to arthritis. It was found to increase the risk of heart disease and stroke. Prior to withdrawal it had revenues of ~US$2.5 billion and was used in over 80 million people.
Summary: Drug and biologic development is a lengthy process, certainly an 8 to 10 year period from beginning the search for a potential product to final FDA approval is quite common. This requires significant funding. In assessing a Biotech one needs to be acutely aware of the amount of cash they have in reserve as well as the cash burn rate (how much cash they are spending each year). According to the latest AUSBiotech Biotechnology Industry position survey (April 2012), 34% of those surveyed have less than 12 months cash on hand at current burn rates, and 46% intend to raise capital in the coming year. However, raising funds from equity/debt capital markets or even venture capital funds may be difficult for Biotech companies in the current economic climate. Companies that may fare better are those that are already partnered with Big Pharma, or at the least are able to attract a premium valuation for acquisition.
THE PROVIDER-PAYER RELATIONSHIP, PRICING, & REIMBURSEMENT
Once a company (the provider) gets it product approved by the relevant government regulatory agency, it needs to also get it listed on a formulary. A formulary is a list of medications. Private health insurers (the payer) have a formulary. This is a list of the medications that they will pay for, usually with a part contribution or “co-payment” from the person who has been prescribed the medication. More importantly, the provider needs to get its product on a government formulary (another payer). In the US this is the Medicare Part D and Medicaid formulary. Here in Australia it is the Pharmaceutical Benefits Scheme (PBS). Private health insurers generally only cover medications already listed on a government formulary. Payers (private and public) can take up to 9 to 12 months to add new products to their formulary. In Australia, once a product has TGA approval the Pharmaceutical Benefits Advisory Committee (PBAC), an independent expert government body, makes a recommendation (to the Health Minister) as to whether it should be listed on the PBS. Once that recommendation has been accepted the Pharmaceutical Benefits Pricing Authority (PBPA) determines what price the government should pay for the medication. This is then negotiated with the provider. As an example of how the reimbursement process then works, we can look at how medications are dispensed from a pharmacy. A wholesaler first purchases the product or medication from the provider and then sells it to the pharmacy. The pharmacy receives the patient’s co-payment once the medication is dispensed, and then they receive reimbursement for the remainder of their costs from the government. This reimbursement includes the provider’s price for the medication + wholesaler’s mark-up + pharmacy mark-up + dispensing/other pharmacy fees.
THE IMPACT OF HEALTH POLICY
Based on a number of surveys done across the world, what we know about the developed world’s population is that it is ageing. What this means for government’s around the world is that healthcare and pharmaceutical related expenditures are going to rise significantly over the coming years. This will impact government health policy and in turn it will impact pharmaceutical and biotechnology companies.
Figure 3: Increased healthcare costs for older people

Source: Pharma 2020 Report PWC
Figure 4: Rising health expenditure as a % of GDP

Source: Pharma 2020 Report PWC
What we could therefore see is tighter regulation of products, shorter periods of exclusivity for original product manufacturers, lower drug prices or reimbursement, and more emphasis on lower cost generics or biosimilars. According to the IMS Institute for Health Informatics (2011), the key drivers for growth in the future will be increased spending from emerging markets (led by China), with a focus on generics or biosimilars, and specialty medicines (biologics).
Figure 5: Leading therapeutic classes in 2015

Source: IMS Institute of Health Informatics 2011
GRADE Classification of BioTechs
In reviewing Biotech companies I like to classify them according to 4 Grade’s, albeit arbitrarily. This is a way of trying to differentiate companies according to the strength of their product pipeline. There’s no science behind it, and it is just a guide or a starting point for further investigation, which you may or may not find useful.
Grade 1: At least 3 products on the market.
Grade 2: 1 or 2 products on the market, with at least 1 other in Phase 2 or 3 trials.
Grade 3: 1 product on the market, or no products on the market but at least 1 in Phase 3.
Grade 4: No products on the market, multiple in Pre-Clinical Phase, Phase 1, or Phase 2.
Across the Grade’s, Grade 1 companies could be considered relatively low risk as they already generating revenues and cash flow. On the other hand, these companies may have already experienced high levels of capital growth off the back of their existing products and may not have as much room to climb further, depending a lot of course on their expected future cash flows and pipeline. They may also be faced with the issue of expiring patents and increased competition from new products. I’d expect the most gains to be achieved from investing in a successful Grade 4 company that is held for the long-term. However, with the exceptionally long time it takes for product development, at the Grade 4 stage it is very hard to assess the likelihood for long-term success. Furthermore, success in Phase 1 or 2 trials is not necessarily a reliable indicator of Phase 3 success or likelihood for regulatory approval. The sweet spot for me is going to be Grade 2 and 3. In order to maximise the potential returns on a Biotech investment, I want to capture those that are closer to their “inflection point”, which may be in these mid or lower ranked Grade’s.
The problem here is that many of these companies are yet to generate any revenues, so a reliable valuation is difficult to make. However, using Skaffold (http:///www.skaffold.com), we can at the very least start by filtering out the ASX-listed Biotech companies, and then find those that are forecast to have a rise in their future intrinsic value. In the table below I have extracted and listed all Healthcare sector companies that that are also part of the Biotechnology/Major Drugs industry groups. The companies listed below all have analyst coverage. I have excluded 2 companies that did not really fit into the defined Grade classification, Mayne Pharma (diversified pharmaceutical services), and Sigma Pharma (wholesale and retail pharmaceutical distribution/sales).
Figure 6: Skaffold biotechnology company current Quality Scores

Source: Skaffold 26 April 2012
Based on the Skaffold Scores, there are 5 companies that could be considered investment grade. They are the A1, A2, and A3 companies: CSL, Blackmores, Acrux, Sirtex, and Mesoblast. Although Mesoblast does not have any intrinsic value, as it does not have any current product revenues. Mesoblast is an interesting one, although it has a lot of cash, this is largely the result of a partnership with Cephalon (now Teva). There are a handful of other companies that have analyst forecasts for near-term product revenue and thus have a future intrinsic value: Biota, Tissue Therapies Limited, Bionomics, Alchemia, Pharmaxis, and QRxPharma. In the following sections I will give a brief overview of 2 companies that currently have products on the market, Acrux and Sirtex, note that the former makes products that enable drug-delivery, and the other is technically a medical device company.
ACRUX (ASX:ACR)
Acrux has a number of products in its pipeline, all of which are based on transdermal delivery. That is, the medications are absorbed into the bloodstream through the skin via sprays, gels, or solutions. The medications themselves have all already been used safely when administered in other ways, for example, via tablets or injections.
Figure 7: Acrux R&D pipeline

Source: Acrux website
Their lead product is Axiron. Axiron is a testosterone hormone solution used to treat low testosterone hormone levels in men (hypogonadism). It is applied in the armpits using an applicator, much like a roll-on deodorant. It was given FDA approval in 2010 and is on the market in the USA. Acrux signed a global licensing deal with Big Pharma Eli Lily in 2010 for the marketing of Axiron. As part of this deal, Acrux is entitled to up to $US335 million in milestone payments as well as worldwide royalties. The partnership with Eli Lily appears like an ideal fit, with Eli Lily already involved in the men’s health market with their erectile dysfunction product Cialis (a competitor to Pfizer’s Viagra). Axiron is actually the second product that Acrux has progressed to FDA approval, the previous being Evamist in 2007, an oestrogen hormone spray used in menopausal women that is also on the market in the USA. Acrux has also ventured into animal health products with Recuvrya, a pain relief solution for dogs that was only recently approved by the EMA (in 2011).
But let’s get back to Axiron. Low testosterone can result in symptoms such as erectile dysfunction, as well as decreased libido, energy, and mood. It is found in people who have a genetic or acquired disorder of the testes (where testosterone is produced) or of the pituitary gland in the brain (where testosterone levels in the bloodstream are regulated or controlled). Low testosterone levels can also be associated with many chronic illnesses, such as obesity, heart disease, and even depression. These illnesses may cause symptoms similar to that of testosterone deficiency, but this does not necessarily mean that testosterone replacement is required. Often focussing on treatment of the underlying illness is what is required instead. Testosterone levels also naturally decline with age, however this is gradual and usually does not get to the point where treatment is required either.
Now there are various testosterone products on the market, with many using different delivery methods, however the recent trend is favouring the newer transdermal routes. When testosterone is given in oral form, it is very difficult to achieve effective and stable concentrations in the bloodstream, this is because after it is absorbed through the intestine it is broken down or metabolised by the liver rapidly. In injectable form (a deep intramuscular injection, e.g. in the buttock) it has to be given every 1 to 3 weeks, this can be associated with severe fluctuations in testosterone concentrations in the bloodstream. This can lead to fluctuations in symptoms such as libido, energy, and mood. In the transdermal market, testosterone patches (think along the lines of nicotine patches) have had anectodally large incidences of severe skin rashes that often result in treatment cessation. This is where the gel/solution based products such as Axiron, Androgel, Testim, and Fortesta are increasingly popular. The overall male testosterone market, in particular for transdermal therapy, has been steadily increasing over the last 6 years as illustrated in the graph below.
Figure 8: Male testosterone market, US 2005-2011 (millions)

Source: Acrux February 2012 Presentation / IMS Data
More importantly though is how Axiron has fared since coming onto the market in April 2011. As of February 2012, Axiron has achieved an 11% share of the transdermal market. Axiron’s main rival product in this market is another Big Pharma product Androgel, from Abbott Laboratories. In this same period, Androgel’s total share of the transdermal market has fallen by 10%, as illustrated in the chart below.
Figure 9: Share of Total Prescriptions of transdermal products in the USA

Source: Acrux February 2012 Presentation / IMS Data
The following graph shows the different transdermal products in terms of their share of total new prescriptions for patients being initiated on treatment for the first time by specialists, or being switched from other products. The most obvious thing to note is how in a short space of time Axiron has become the most widely prescribed product, and that the percentage share of total new prescriptions for Androgel has been declining significantly.
Figure 10: Share of transdermal New to Brand Prescriptions by Specialists

Source: Acrux Novembery 2011 Presentation / IMS Data
It appears that the uptake of Axiron has been excellent, and has the potential to eat away an even larger chunk of the total transdermal market. A key advantage of Axiron over Androgel is that is applied to an area that is less likely to come into contact with other people. Androgel on the other hand is applied over the upper arms and shoulders, so has a much greater chance of being indirectly transferred to other people. Another advantage of Axiron is that you do not need to physically touch the solution with your hands, whereas with Androgel you do have to rub the gel directly onto the skin with your hands.
On the Skaffold line graph below I have roughly marked out the Phase 1, 2, and 3 announcement dates as well as the date of FDA approval for Axiron. Acrux is currently trading at a significant premium to intrinsic value, however the intrinsic value is expected to rise significantly in the next few years.
Figure 11: Acrux Skaffold Estimated Intrinsic Valuation line

Source: Skaffold 27 April 2012
SIRTEX (ASX:SRX)
Sirtex has one product on the market, SIR-Spheres microspheres (let’s called it SIR-Spheres from now), which is a treatment option available for advanced hepatocellular carcinoma (“HCC”, liver cancer/tumour(s) that cannot be surgically removed), as well as for metastatic colorectal carcinoma (“mCRC”, bowel cancer that has spread to the liver, where the liver cancer/tumour(s) cannot be surgically removed). Sirtex also has a number of products or technologies in pre-clinical phase, although not a lot of information is available about them as they are at such an early phase.
Figure 12: Sirtex R&D pipeline

Source: Sirtex Company Presentation October 2011
SIR-Spheres is a radioactive treatment. Sirtex have developed micro-particles or beads (made from a substance called Resin) that act as transport vehicles for an isotope called Yttrium-90. An isotope is a radioactive chemical element. SIR-Spheres can be injected into the hepatic artery (the blood vessel that supplies the liver), once here the micro-particles get lodged into the walls of the small blood vessels that surround the tumour. This is a treatment that enables radiation to be given to a very localised area, without affecting normal liver tissue or other bodily organs. It is often referred to as selective internal radiation therapy (SIRT), or radioembolisation. It is a highly innovative product, although there is another company called Nordion that has something similar called TheraSphere. TheraSphere has micro-particles made from glass, but it also uses the Yttrium-90 isotope.
Radioembolisation is currently not used as first-line therapy. Let’s looks at HCC and mCRC separately to see exactly where it fits. For HCC, the first-line treatment for advanced inoperable cases, apart from liver transplantation, is a procedure called Radiofrequency Ablation (RFA). This is basically when a needle-like probe is passed into the tumour and an electrical current heats the probe resulting in the tumour tissue being heated up and destroyed. Where this is not possible, Transarterial Chemoembolisation (TACE) can be used. TACE is where chemotherapy is administered directly into the hepatic artery. SIR-Spheres radioembolisation could be used as an alternative to TACE. Having said that, with regards to SIR-Spheres, there is not yet enough clinical evidence or consensus with regards to when and whether to use SIR-Spheres over TACE. Systemic or traditional chemotherapy is used in more severe cases of HCC where there are multiple tumours or the other options are contraindicated in the patient. Systemic chemotherapy can also be associated with a lot of side effects. With mCRC involving the liver, where surgery is not an option, RFA is also used. Hepatic Intra-arterial (HIA) chemotherapy (similar to TACE) can be used as an alternate to systemic chemotherapy, although the benefits of this over newer systemic chemotherapy regimes have not yet been clearly demonstrated. Similarly, the benefits of SIR-Spheres over newer systemic chemotherapy regimes have not yet been clearly established either.
When SIR-Spheres was approved by the FDA, the control group in the Phase 3 trials was being given a systemic chemotherapy regime that has now been superseded by a more effective regime. The key downside to this product is therefore the lack of consensus as to when to use it and the lack of enough clinical evidence over existing treatments. SIR-Spheres has been approved for sale in Australia, Europe, and the USA. FDA approval was obtained in 2002, and this was the time of first commercial sale. So what has happened in the last 10 years? Well, they still have the same product, and the fact that it is still their only product is another downside risk, although they are working on number of clinical trials, with 4 major ones in clinical recruitment. These clinical trials are aimed at increasing the indications for use of the product, to see if they can find evidence to support it’s use in the earlier stages of cancer treatment, as first-line therapy or as an add-on to the newer systemic chemotherapy treatments. All that being said, Sirtex has steadily increased its revenues over the last 5 years.
Figure 13: Sales revenues (thousands)

Source: Sirtex February 2012 presentation
On the Skaffold line below I have roughly marked the date of FDA approval for SIR-Spheres. The share price of the company has been quite volatile over the years, but this is not uncommon in this industry. Like Acrux, it is also trading at a significant premium to its current intrinsic value, however its intrinsic value is also expected to rise in the next few years.
Figure 14: Sirtex Skaffold Estimated Intrinsic Valuation line

Source: Skaffold 26 April 2012
CONCLUSION
A decision as to whether to invest in either of these companies will require a deeper analysis of their management team, cash flows, debt levels, levels of return on equity, the strength and diversity of their pipeline’s, and industry competition. Unfortunately that is beyond the scope of this article. But if you are looking for an A1 company in this industry, you can’t go past CSL or Blackmores. Both are excellent companies that have had steadily rising intrinsic values for over 10 years. If you want to invest in a company at a much earlier stage, there are a few companies that are worth keeping an eye on. Aside from the 2 I have reviewed in this article, I think Bionomics, Alchemia, and QRxPharma are ones to add to your share portfolio watchlist. Below I have extracted some of the Skaffold data and listed the forecasted future intrinsic values of the companies whose intrinsic values are expected to rise in the next 1 to 3 years. Note: Biota has recently announced that it will be delisting from the ASX, and I have slotted in Mesoblast as an extra.
Figure 15: Currently Estimated Future Values

Source: Skaffold 1 May 2012
Posted for Praveen by Roger Montgomery, Value.able author, Skaffold Chairman and Fund Manager, 31 May 2012.
Do you ‘LIKE’ us?
by Roger Montgomery Posted in Health Care, Intrinsic Value, Skaffold.
- 17 Comments
- save this article
- 17
- POSTED IN Health Care, Intrinsic Value, Skaffold.
-
Germany v France and the future of your SMSF.
Roger Montgomery
May 29, 2012
 “The more European leaders talked at a dinner last Wednesday, the grimmer Angela Merkel looked. One after another, they spoke out in favor of the joint assumption of debt and against the strict austerity course Berlin is calling for. The chancellor stared silently at the man who was responsible for this change of mood — France’s new president, François Hollande, who noted with satisfaction that there was “an outlook for euro bonds in Europe.”
Merkel disagreed, saying that euro bonds are not the right tool, but to no avail. Only a minority stood behind the German leader. Even European Council President Herman Van Rompuy said, at the end of the dinner, that there should be “no taboos,” and that he would examine the idea of euro bonds. “Herman,” Merkel blurted out, “you should at least say that some at this table are of a different opinion.”
…..
The fight has only just begun, and so it comes as no surprise that the roar of battle is drowning out everything else at the moment. But there are also signs of rapprochement. During his first official visit to Berlin, Pierre Moscovici, the new French minister of economics and finance, revealed some sympathy for the German line. He confirmed the new French government’s intention to reduce the national deficit in the coming year to below the upper limit of 3 percent of GDP, and to eliminate all new borrowing starting in 2017. He also underscored how important healthy budgets are for growth and employment. Those who have too much debt become impoverished, he said. And those who are poor, he added, cannot invest.”
From: http://www.spiegel.de/international/europe/merkel-preparing-to-strike-back-against-hollande-with-six-point-plan-a-835295.html
I like Greg’s post on this subject here on the Insights Blog earlier today:
“With respect to Eurobonds, investors should understand that what is really being proposed is a system where all European countries share the collective credit risk of European member countries, allowing each country to issue debt on that collective credit standing, but leaving the more fiscally responsible ones – Germany and a handful of other European states – actually obligated to make good on the debt.
This is like 9 broke guys walking up to Warren Buffett and proposing that they all get together so each of them can issue “Warrenbonds.” About 90% of the group would agree on the wisdom of that idea, and Warren would be criticized as a “holdout” to the success of the plan. You’d have 9 guys issuing press releases on their “general agreement” about the concept, and in his weaker moments, Buffett might even offer to “study” the proposal. But Buffett would never agree unless he could impose spending austerity and nearly complete authority over the budgets of those 9 guys. None of them would be willing to give up that much sovereignty, so the idea would never get off the ground. Without major steps toward fiscal union involving a substantial loss of national sovereignty, the same is true for Eurobonds.”
At worst your SMSF hangs in the balance. At best expect a wild ride.
Posted by Roger Montgomery, Value.able author, Skaffold Chairman and Fund Manager, 29 May 2012.
by Roger Montgomery Posted in Global markets, Market Valuation.
- 11 Comments
- save this article
- 11
- POSTED IN Global markets, Market Valuation.
-
Were investors hasty?
Roger Montgomery
May 28, 2012
 It’s true that many Australian businesses are on their own path and even amid the financial tempest raging in Europe there will be companies that succeed.
Conversely there will many that fail.
I have maintained that beating the market can be made simpler by sticking to high quality issues.
Skaffold’s A1’s, I believe, have the lowest probability of ‘catastrophe’ within a year or two of receiving their score. Of course, you have to realise that business is dynamic and Skaffold’s quality scores will change with new information.
Furthermore, having the lowest probability of catastrophe is not to say there is zero chance of catastrophe. A 100-to-1 nag at Moonee Valley might still win the race.
Nevertheless, I would however rather have a diversified portfolio of A1s and A2s than a portfolio of C5s.
And this brings me to today’s announcement that Hastie Group has voluntarily appointed Administrators, just three days after the company announced accounting irregularities would result in a charge to profits of $20 million.
Hastie Group Limited (HST) has today announced that it has been placed into voluntary administration. Many investors will lose any and all the money they had invested in the company. If you are retired or about to retire, you can least afford such a permanent impairment to your capital.
I get so frustrated when I hear young advisers telling people on air to ‘only use money they can afford to lose’. I don’t know about you, but I cannot afford to lose any!
And that’s were quality comes into its own. Skaffold was designed to mitigate the risk of investing in those companies where the risk of events like the appointment of administrators is highest.
Skaffold’s quality scoring is based on decades of international academic research into forecasting collapses. And for us it just works.
At Montgomery Investment Management the Quality of a company is our first filter. A high Quality Score is the cornerstone to our investment strategy as well as the core of our investment decision-making. The second step is value. We reduce risk even further when we buy high quality companies only when they are at sharp discounts to intrinsic value.
Hastie listed on the ASX in 2005 and enthusiasm for its shares once pushed the market value of the company to $500 million and to a share price – just before the GFC – of more than $40.
So, one sign of impending danger was that from 2009 onwards the company’s Quality Score dropped well below investment grade.
Fig 1. Skaffold Quality Score History since listing. (International Patents Pending). Hastie Group

The second warning was that the company’s shares, when they were at the height of their popularity were trading well above intrinsic value and intrinsic value was not rising at a satisfactory rate.
Fig 2. Skaffold Line. Hastie Group. (International Patents Pending). Expensive in 2006-2008 and flat and declining intrinsic value from 2007.

For many investors Figs 1 and 2 might be enough to turn the page and look to invest elsewhere. For those with more than a cursory interest however, Skaffold opens a window to the performance of the company.
As Fig 3 reveals, the company was reporting profits but even rising levels of debt failed to stem declining returns on equity.
Fig 3. Skaffold Capital History (International Patents Pending). Hastie Group. Note declining blue line (ROE) despite rising red columns (debt) and rising green line (profits)).

And weak cash flows (Fig 4.) as measured by Skaffold’s Funding Gap (the green line was below zero every year since listing) ensured the company would never meet all of our investment criteria.
Fig 4. Skaffold Cash Flow (International Patents Pending). Hastie Group. (note the green line (Funding Gap/Surplus) is almost always negative – biting off more than it can chew?

Finally, I note that Skaffold does something I reckon is positively spectacular. Using the Cash Flow Evaluate Screen in Fig 4. above as an example, Skaffold’s computing engine converts the chart to plain and natural English! Its a simple paragraph that explains in easy-to-understand terms precisely what you are looking at. Imagine that being updated live for every screen and for every listed stock! Have a read…
Fig 5. Skaffold’s Auto-generated plain language Cash Flow Screen description. (International Patents Pending)

Avoid potential disasters with Skaffold’s Quality Scores.
Skaffold consistently identified HST as expensive or poor quality or both.
For investors who seek to give themselves every opportunity to avoid the landmines, Skaffold’s timely assessment of HST’s poor investment quality represents the kind of early warning signal you need.
Decades of academic research into the study of corporate failure are the backbone of Skaffold. Isn’t it time you made Skaffold your portfolio’s most important investment?
To find out more about how Skaffold can help you avoid potential disasters such as Hastie Group Limited and best protect your portfolio in preparation for the future contact Donna at Skaffold on (02) 9692 5750 or register to attend the next Skaffold online webinars from the complete comfort of your own home, office or combine harvester.
Posted by Roger Montgomery, Value.able author, Skaffold Chairman and Fund Manager, 28 May 2012.
by Roger Montgomery Posted in Investing Education, Skaffold.
- 11 Comments
- save this article
- 11
- POSTED IN Investing Education, Skaffold.


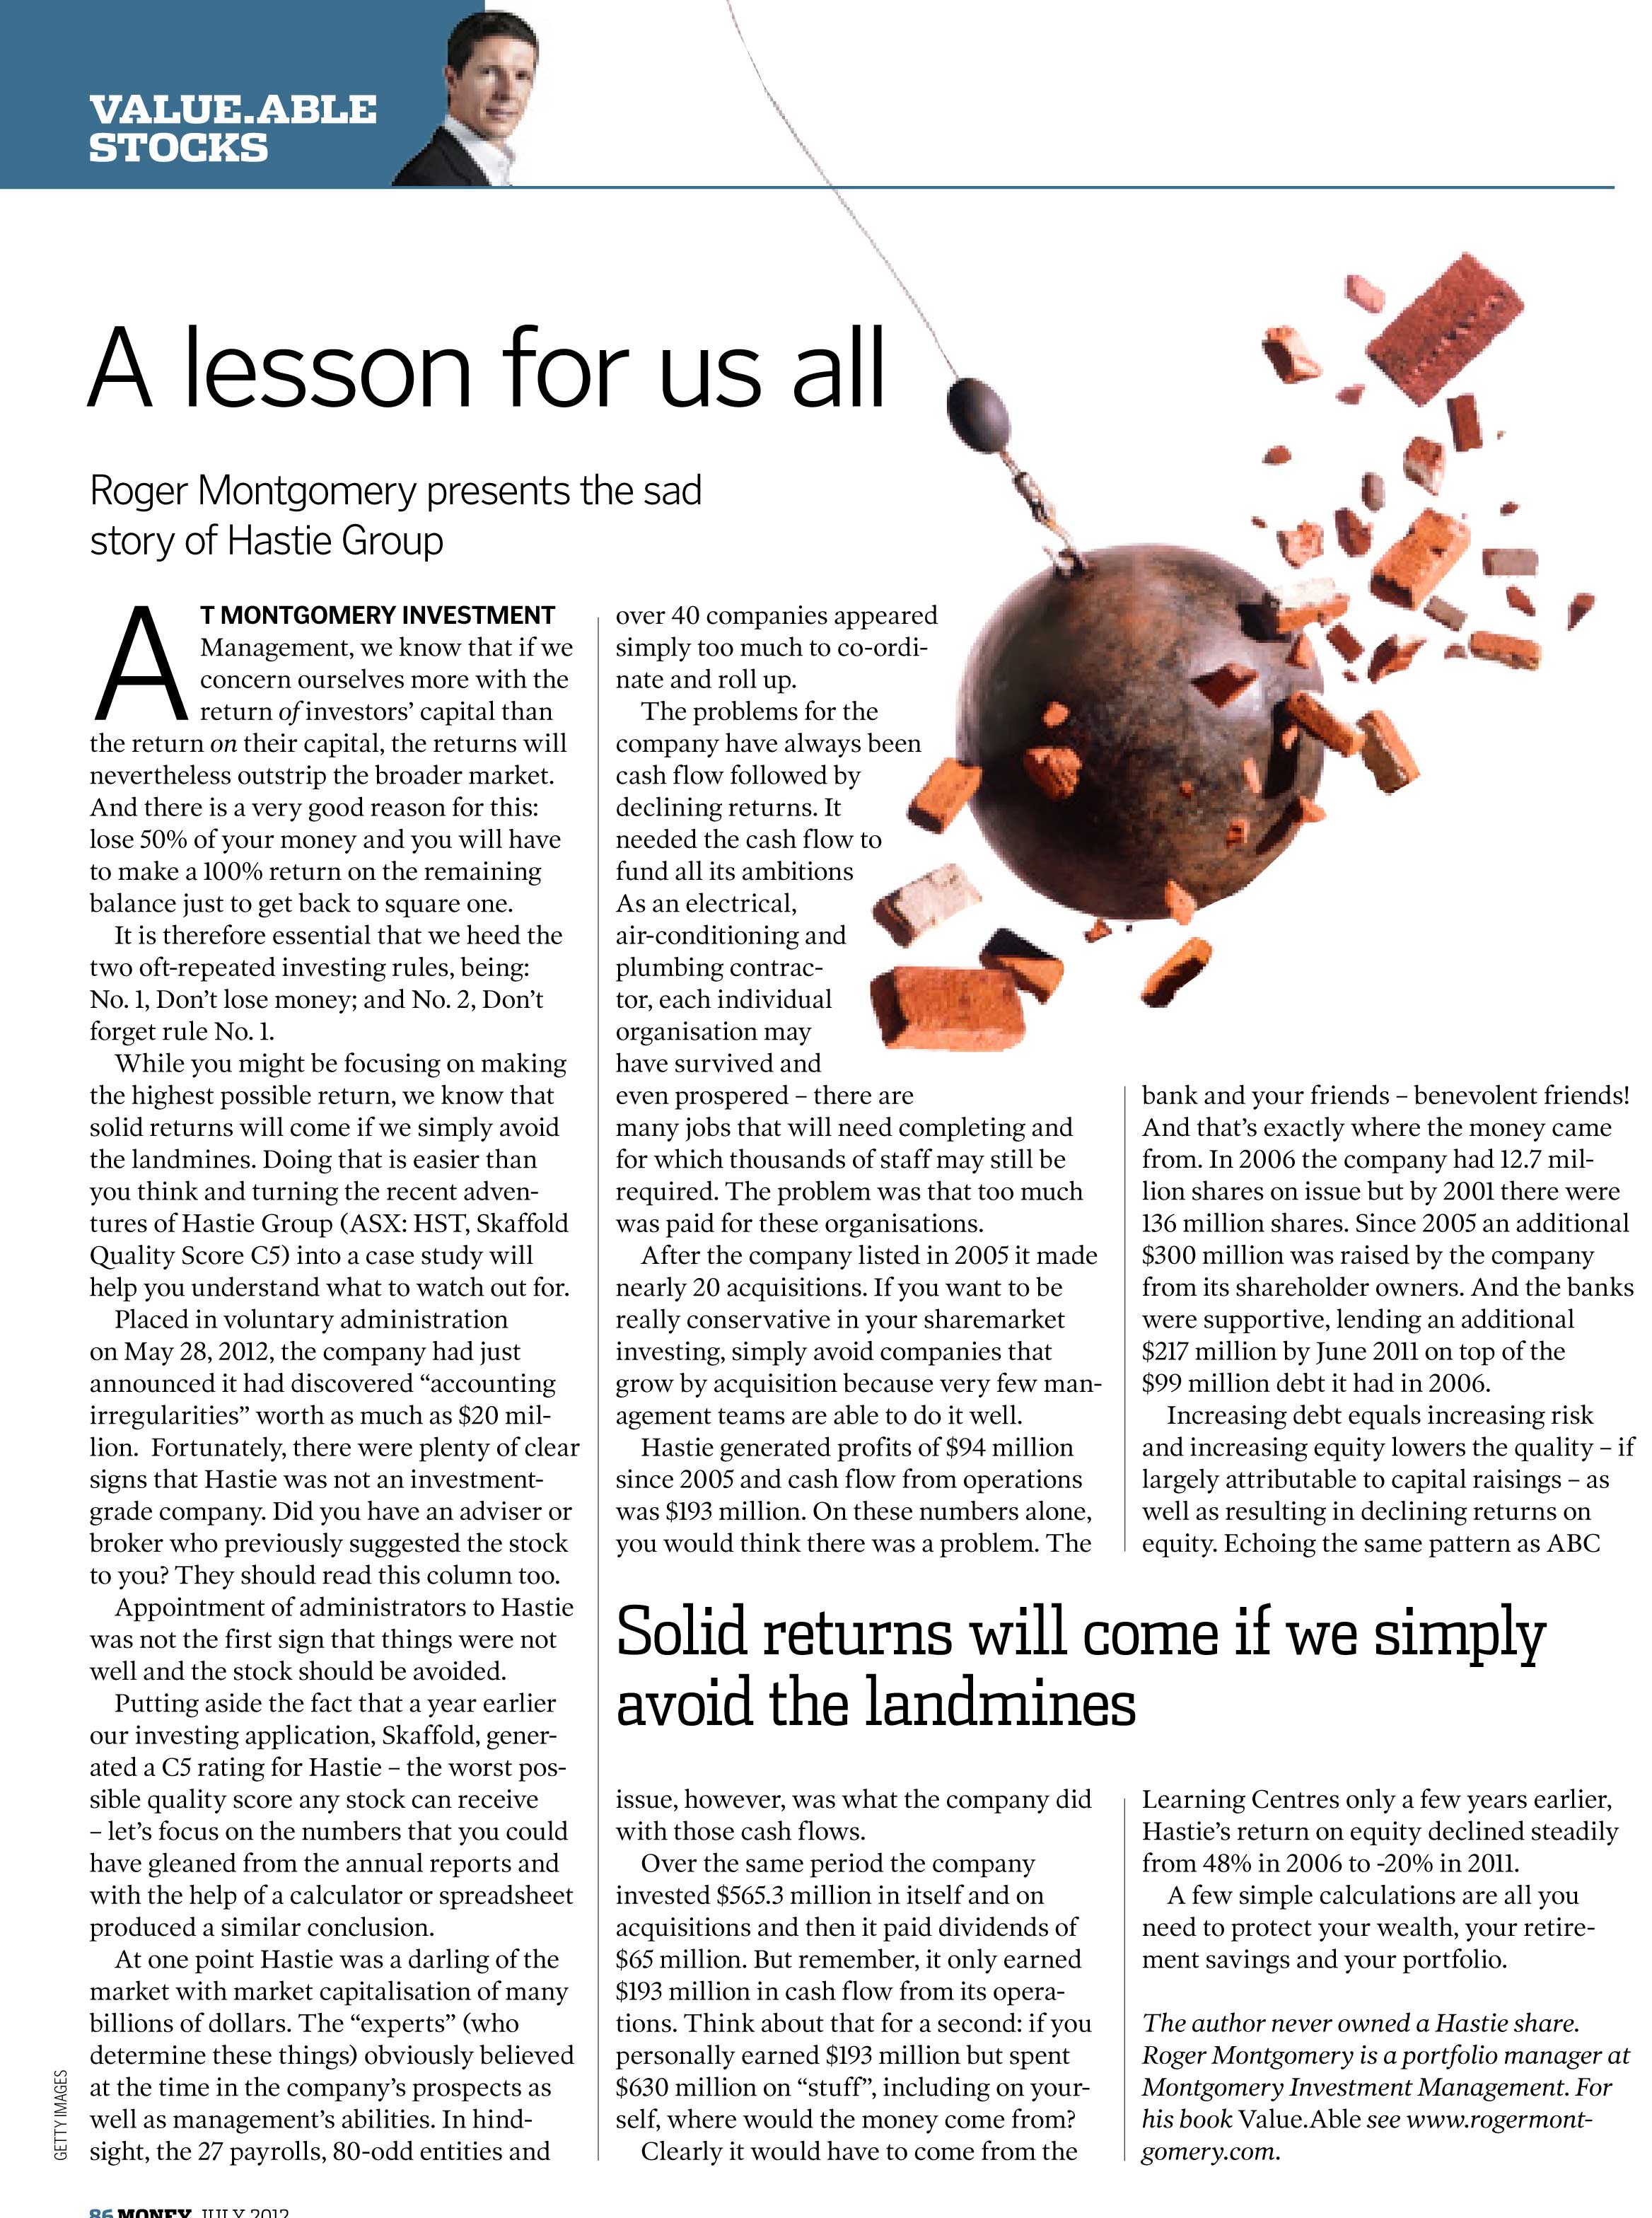