Search Results for: jbh
-

Reporting Season’s Winners and Losers
Roger Montgomery
February 25, 2014
 As the current reporting season draws to a close, we’ve come up with our list of the market’s best (and, by default, less-than-best) performers.
by Roger Montgomery Posted in Companies.
- 16 Comments
- save this article
- 16
- POSTED IN Companies.
-
Looking at: JB Hi-Fi’s pre-half-yearly report
Russell Muldoon
February 10, 2014
We’ve recently experienced a rash of downgrades to market expectations: including Super Retail Group (SUL) and The Reject Shop Limited (TRS), along with poor showings from US electronics retailers and the material decline to the share price of JB Hi-Fi Limited (JBH). Continue…
by Russell Muldoon Posted in Companies, Consumer discretionary.
- 9 Comments
- save this article
- 9
- POSTED IN Companies, Consumer discretionary.
-

Sector Sentiment
Ben MacNevin
February 5, 2014

Analysts weren’t expecting a bumper Christmas period; the general expectation was for relatively steady sales growth to finish the year. However, sentiment in the retail sector has taken a negative turn after disappointing trading updates from key retailers. Should this be cause for concern? Continue…
by Ben MacNevin Posted in Consumer discretionary, Insightful Insights.
-

The Reject Shop: Bright future or burn-out?
Russell Muldoon
January 29, 2014
Despite the media talking up a very positive sales period over Christmas for our retailers, a mixed bag of trading results reported by the likes of JB Hi-Fi Limited (JBH), Super Retail Group Limited (SUL) and The Reject Shop Limited (TRS), have left many investors scratching their heads. Continue…
by Russell Muldoon Posted in Companies, Insightful Insights.
- 18 Comments
- save this article
- 18
- POSTED IN Companies, Insightful Insights.
-

Is Dick Smith’s float one to watch?
Russell Muldoon
November 20, 2013
Last week’s Freelancer (FLN) IPO marked the 73rd ASX listing this calendar year. We have steadily grown more and more skeptical at the speed many businesses are being brought to market in the pre-Christmas rush. Continue…
by Russell Muldoon Posted in Consumer discretionary.
- 11 Comments
- save this article
- 11
- POSTED IN Consumer discretionary.
-
JB Hi-Fi on the up?
Ben MacNevin
May 8, 2013
Last week, within the first few minutes of sitting in a conference room listening to an update by Terry Smart, one of Australia’s smartest retailers, he announced a sales and profit upgrade. Naturally having a position in JB Hi-Fi (JBH) is pleasing.
Continue…by Ben MacNevin Posted in Companies, Insightful Insights.
- 2 Comments
- save this article
- 2
- POSTED IN Companies, Insightful Insights.
-
Signs of a merry Christmas at JB Hi Fi?
Tim Kelley
December 24, 2012

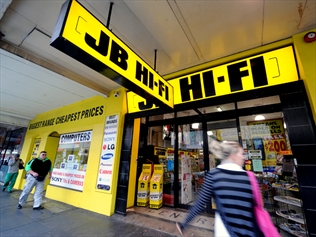
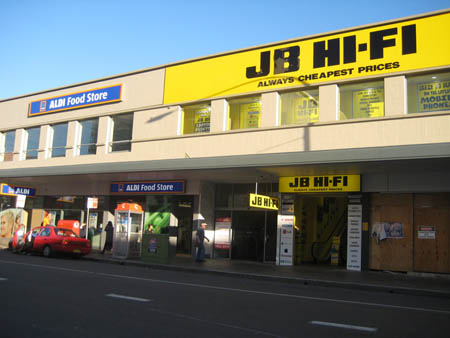
JB Hi Fi (ASX:JBH) is a retailer we have followed closely over the years. What attracted us to the business was a focused and well-executed business model that delivered strong returns on equity, coupled with a store roll-out program that allowed those returns to be realized on an expanding pool of assets. Over time, this led to increasing market share and growing EPS. In fact, between 2004 and 2010 EPS grew at a rate of over 30% p.a. compound.
by Tim Kelley Posted in Companies, Insightful Insights, Value.able.
- 2 Comments
- save this article
- 2
- POSTED IN Companies, Insightful Insights, Value.able.
-
Window Shopping
Roger Montgomery
September 1, 2012
In his September 2012 Money Magazine article Roger outlines ongoing declining prospects for JB Hi-Fi (JBH). Read here.
by Roger Montgomery Posted in Companies, Consumer discretionary, On the Internet.
- save this article
- POSTED IN Companies, Consumer discretionary, On the Internet.
-
JB HiFi’s post result rally conceals more complex reality
Roger Montgomery
August 15, 2012
Roger discusses how the JB Hi-Fi positive 2012 result conceals future structural difficulties in this Australian article published 18 August 2012. Read here.
by Roger Montgomery Posted in Consumer discretionary, In the Press, Insightful Insights.
-
JB Hi-Fi Full Year Results for 2012
Roger Montgomery
August 13, 2012
JB Hi Fi today reported its full year results. Revenue of $3.13b was 6% higher than FY11, but NPAT was down 4.6% to $104.6m. While this was the first decline in JB Hi-Fi NPAT since it listed in 2003, it was slightly better than the market had anticipated and, as I write, the share price is up over 6%.
As value investors, we are more concerned about the long-term than the intra-day outlook, and the question exercising our minds is: to what extent are the current headwinds cyclical vs. structural?
JB Hi-Fi believes that most of what is happening is cyclical, and there is some evidence that can be marshaled to support that view. However, it can also be said that retailers who previously competed locally must now compete with the best in the world. In this context, retailers that must pay Australian prices for rent, staff and utilities have some relatively big hurdles to clear.
Investors should also be aware of two interesting financial developments. Looking at the Profit & Loss statement you will see EPS has risen from 101.76 cents to 105.93 cents.
But the charts of EPS in the remuneration section reveal a very different picture. You see, the P&L includes an abnormal loss of $33 million associated with the Clive Anthony’s ‘restructure’. Take the abnormal loss out and the continuing operations made EPS of $1.247 in 2011 against this year’s $1.059. If it was ok to use $1.247 for the execs in working out their incentives, it should be ok for shareholders to use to compare this year’s P&L!
And for those investors enamoured with cash flows, don’t get too excited by the cash flow from operations jumping to more than $215 million from $105 million last year. You see, there’s been a $100 million blow out in payables. In other words JBH appears to have held off paying its suppliers a little longer.
by Roger Montgomery Posted in Companies, Consumer discretionary.
- 3 Comments
- save this article
- 3
- POSTED IN Companies, Consumer discretionary.
-
Is this the fate that awaits Australian Iron Ore Producers?
Roger Montgomery
July 26, 2012
 Could it get any worse for Iron Ore? It Just did!
News Flash! Shipping more iron ore volumes at lower prices is the same as JBH and HVN selling more TV’s a lower prices. Margins compress and profits don’t meet expectations.
Back in April, when we began more urgently warning investors to look carefully at profit assumptions for the big material stocks, our theory was that iron ore prices would decline because of a massive supply response. It really was basic supply and demand. Economics 101. You can read our warning here: http://rogermontgomery.com/is-the-bubble-bursting/
Back on December 8 2011, with BHP trading at more than $37.00 we again warned:
“I now wonder whether we are seeing the bubble slip over the precipice? Falling property prices (10 per cent of the Chinese economy) leads to lower construction activity, leads to declining demand for Australian commodities, leads to falling commodity prices, leads to big drops in margins for a sizeable portion of the [Australian stock] market index…”
The doubters and many analysts that cover the sector however told us that lower prices would just mean that BHP, RIO and FMG would simply ship more volume. Remember share price performance over the long run follows profitability not profit.
And here’s the latest…
According to a news article that landed in the Bloomberg terminal this morning (see screenshot), Rio de Janeiro-based Vale, the world’s largest iron- ore producer, said second-quarter profit plummeted 59 per cent after prices for iron ore, nickel and copper declined.

Net income dropped to $2.66 billion, or 52 cents per share, from $6.45 billion, or $1.22 per share a year earlier. Vale was expected to post per-share earnings of 73 cents. The selling price of iron ore and most of Vale’s main products is lower than in 2011. This explains the decline in earnings.
Net sales fell 21 percent to $11.9 billion despite an increase in supply / production at Carajas, its biggest mine. Vale reportedly sold its iron ore at an average $103.29 per metric ton, down from $145.30 last year – something we have been warning for 6 months may happen. Nickel’s average sales price dropped 31 percent and copper declined 15 percent.
The stock has fallen 24 percent in the past 12 months, twice the 12 percent decrease in Brazil’s benchmark Bovespa Index. Management has put the focus of the fall squarely on slowing economic growth in China, the world’s biggest steel producer.

Returning to BHP, just 12 months ago, analysts had forecast 2012 net profits of almost $22b rising to $23b in 2013.
Those forecasts now stand at $17b and $18b respectively, representing a massive 22%-23% downgrade. And like Vale, BHP has also materially underperformed the ASX 200 index.
And given the significant miss by Vale analysts this morning, we reckon forecast earnings for BHP, RIO, FMG, MIN, AGO, BCI might disappoint again in the near future.
The answer in future periods may in fact lie in the Shanghai Re-bar prices and we have been watching this closely. Why? Because this is the most-traded steel futures contract and last week it hit a 2012 low.

Are iron ore prices, currently trading around China’s cost of production of $120/t, about to follow Re-bar prices despite most predicting the price simply cannot fall past this point?
The last time Re-bar prices were at this level, iron ore prices were also significantly lower.
When I was last on the ABC’s Inside Business program (watch it here: http://rogermontgomery.com/an-important-announcement/), we discussed Fortescue Metals CFO stating that their long-term iron ore price target is $100/t. I wonder how long we will have to wait until that forecast is also revised lower? As always, time will tell. Vale’s news is not a good omen.
by Roger Montgomery Posted in Energy / Resources, Market Valuation.
- save this article
- POSTED IN Energy / Resources, Market Valuation.
-
Is this a Thorny Investment?
Roger Montgomery
June 24, 2012
 We all know that retailing is doing it tough and there’s hardly bright lights on the horizon. (Of course it is always darkest just before the dawn but our experience is telling us that most analysts are scraping the bottom of the barrel for opportunities when scrounging around trying to pick up scraps of returns from post announcement arbitrage opportunities. Conversely, the frequency of observations in this space suggests those with plenty of spare cash reckon we are close to the bottom).
One business that also happens to be a retailer (as measured by current business unit revenues) and one we have previously owned is Thorn Group but its outperformance of the retail sector is unlikely to be sustained unless its investment in new products pays off.
(NB. Later in the week I will seek permission to give you some School Holiday reading – Michael’s 20-page Magnum Opus on TGA)
The picture at left should really be of the Tortoise from Aesop’s fable The Tortoise and The Hare. You will see why shortly…
It goes without saying that Australian retailers are doing it tough. But just how tough? Compare the share price performance of some household names in retail to the performance of the All Ordinaries index over the past 12 and 24 months.

The high Australian dollar, record outbound tourism, high petrol prices, rising utility costs, indebtedness, a slowing economy, cautious consumers and a structural shift rendering bricks-and-mortar retailers less competitive have seen earnings downgrades come in thick and fast amongst retailers. As well as being tough on the businesses and their managers, retailing has also been a tough place to be an investor.
But one company appears to be bucking the trend, in business terms; that company is Thorn Group (TGA). While the past 12 months have proven just as difficult for the company’s share price as they have for its contemporaries (perhaps not pure peers), it’s the 24-month performance of this business that sets it apart. And if a business does well, the shares usually follow.

Many retailers have seen their share prices decline 40-50%, yet Thorn has delivered an impressive two-year return to shareholders.
Better still, the business continues to do well. In its latest annual report, released last week, Thorn Group reported NPAT up 26.4% (EPS was up 14% post capital raising). A retailer whose bottom line is actually growing is rare in the current environment; compare Thorn with forecasts for JB Hi-Fi (JBH), Harvey Norman (HVN), Myer (MYR) and David Jones (DJS) in 2012.

Tomorrow’s returns to shareholders however will be dependent on how the business performs in the future. So the question, of course, is whether this outperformance is sustainable? I always look for businesses with ‘bright prospects’.
A quick look under the hood reveals Thorn’s Revenue (first column each year) and EBIT (second column each year) breakdown. The key to the group’s prospects – even after the recent acquisition of NCML, which contributed 20% of EBIT growth – is the rental segment, which represents 92.5% of EBIT. It’s also identified by management as the company’s ‘core’ operations.

Clearly, given its contribution to the bottom line, it is the rental segment (not Cash First, Equipment Finance or NCML) that will help identify whether or not the business’ prospects are good. We appreciate that the other segments will/may grow but the company’s slow and steady organic approach to growth will ensure it is the prospects for the Rental/Retail business that determine investor returns in the foreseeable future). In this segment, we find Radio Rentals and Rentlo.
‘Consumer rental operations’ would be an apt description for this segment, which is responsible for the retailing of browngoods, whitegoods, PCs, furniture products and other goods such as gym equipment. The revenue breakdown by product and change in product mix is estimated as follows.

The ‘change’ column raises an eyebrow for me. Over the last two to three years, the rental segment of Thorn has experienced very strong customer growth, driven in the main by its $1 ‘Rent-Try-Buy’ promotion. High single-digit growth rates have been produced across the board.
Recently, however, this rate has fallen to the low single-digit rate of 3.1%, and as can be seen in four out of five product groups, growth is negative, flat or marginal. The hero in the product mix, however, is clearly furniture but in my observation, heroes eventually come unstuck.
I reckon the growth in furniture highlights the fact that consumers tend to ‘rent’ higher ticket items. Deflation in electronics means that the decision to buy over renting is a far less taxing one. The result is more people buying the laptop and LED TV versus renting. Indeed, much has changed in retailing because that which was once aspirational is now disposable. I like that phrase and have now trademarked it!
Couple the low rates of growth with customer churn and an increase in impairment charges on the rental book and we have a stronger case building for a period of muted to possibly negative growth. This is only offset if the company’s aim to extend furniture to outdoor product ranges and extend to new brands (eg Apple) works sufficiently.
According to a recent company presentation, 44% of customers are retained when their old rental agreement matures. That is to say, these customers purchase another product under another contract. This implies that about 56% of all customers will drop off once their first purchase is fully paid. Whether the 44% that remain are upsold and the rate that they are replaced, determines the rate of growth.
In strong growth years, churn is easily offset by more customers entering the business than leaving. And given the strong growth in customers over the past few years, this has been the case.
But when growth rates fall – a sign of a tighter marketplace, changing consumer trends and a potential maturing business (remembering that Thorn grew strongly during the GFC) – churn becomes harder and harder to fight, and the status quo tougher and tougher, as well as more expensive, to maintain.
With an average 27-month contract term, and given strong growth from 2009 onwards, from here the business will likely experience a larger proportion of their 100,000 customer rental agreements coming to term and maturing. Prior comparative period (PCP) comparisons could look less attractive.
Unless that retention rate can be materially lifted, new customers coming in must continue to exceed customers exiting. With the trend into 2013 on the up, the outcome here is likely to be a much tougher battle and flat to slightly negative growth in the core business, which generates in excess of 90% of EBIT.
The key question, therefore, becomes: how long will it take for the investment in new products – Cash First, Equipment Finance and Kiosks – to begin paying off? This will be the next leg in business performance and if that occurs, the share price will, of course, eventually follow.
Thorn is a well-managed business and has a strong balance sheet, cash flow and management, with a track record of delivering new revenue streams through differentiated business models that, with the exception of the NCML acquisition pimple, has been organic. But until those new models begin to gain traction, on my analysis it looks as though the business has a tougher couple of years ahead of it.
Before I head off on holidays I will provide a link to Michael’s Magnum Opus (POST SCRIPT: SEE MICHAEL’S 20-PAGE SPECIAL IN THE COMMENTS BELOW) on TGA where he agrees generally with this conclusion stating:
“I think that Thorn’s growth will slow for 2013, do better in 2014, then experience an up-tick as initiatives like Cashfirst, Thorn Equipment Finance and individual expansion initiatives in Radio Rentals/Rentlo and NCML move from making losses, or small profits, to being acceptably profitable. EPS will grow, but nothing like the EPS CAGR of the last five years.”
And while outperformance over the rest of the retail sector has likely to come to end, the company is one I plan to keep a close eye on.
First Published May 2012. Posted by Roger Montgomery, Value.able author, Skaffold Chairman and Fund Manager, 24 June 2012.
To pre-register for the soon-to-be-released Montgomery retail fund visit www.montinvest.com and click the APPLY TO INVEST button. A Pre-Registration Form will appear and after completing it, be sure to select the button “Retail Investor < $500,000″. You will then receive an automated email from my office and be registered to receive the PDS/FSG and Information Booklet as soon as it’s received all of its approvals. If you decide to proceed and/or your advisor does, we look forward to working for you. If you are a planner or advisor or responsible for dealer group approved lists or you are an executive at a research house or ratings agency and would like to discuss next steps feel free to call the Mr David Buckland at the office on (02) 9692 5700. Investments can only be made through the PDS and a Financial Services Guide (‘FSG’) will also be available.
by Roger Montgomery Posted in Consumer discretionary.
- 18 Comments
- save this article
- 18
- POSTED IN Consumer discretionary.
-
Should you watch director’s dealings?
Roger Montgomery
May 8, 2012
 Once upon a time JB Hi-Fi was a category killer: its returns on equity were unassisted by debt and stratospheric and it was all reflected in a strong share price. But something has changed. I wrote previously, and commented elsewhere, that JB Hi-Fi was maturing, that returns on equity were flattening and that the sun was setting on the ability of the business to reinvest profits at the very high returns of the past. The impact of this of course is flatlining intrinsic values. Indeed take a look at the Skaffold valuation line chart below. You can see that even by 2014, JBH’s intrinsic values are expected to show no appreciation from 2009/2010. Maturity.
That of course hasn’t prevented me from buying a few shares around$15.00. Fortunately however we were quick to change our mind and even secured a small profit.
I wonder whether the first signs of business performance beginning to mature, is often the point when it becomes worth watching what directors do with their shares for some further insights?
JB Hi-Fi’s CEO, Richard Uechtritz, had been at the company for a decade prior to his retirement in 2010 and those watching his share dealings may have drawn a different conclusion to those being lulled by a bullish share price.
At the outset let me say there is no impropriety in a director selling their shares and none is suggested here. Directors are free to sell shares within the bounds of their staff trading policy and are required to report their dealings to the market.
And it’s through these announcements that the investor can see what directors are doing with their shares.
On August 20, 2009, JB Hi-Fi’s CEO held 2 million shares and 627,000 options
and he exercised options to buy another 180,048 shares at $7.27. A week later, JB Hi-Fi’s CEO had sold all of shares he had just purchased the week before for an average price of $17.65.
Then, between September 2 and 3, 2009, another 500,000 shares were sold at an average price of $18.22. By now JB Hi-Fi’s CEO held 1.5 million shares (down from 2 million on AUgust 20) and 447,267 options (down from 627,000).
Skaffold’s Valuation Line Evaluate screen for JBH reveals a maturing intrinsic value – little growth and lower IV in 2014 than 2010.

To alleviate the need to read thousands of annual reports, for every listed company, going back a decade try www.skaffold.com
Now back to our regular programming…
Between August 20 and September 3, there are just 13 days – call it two weeks.
Another 174,656 options were granted on 14 October 2009, and then, in early February 2010, JB Hi-Fi announced the retirement of its CEO.. Having sold 680,048 shares in the seven months before the announcement, JB Hi-Fi’s CEO sold another 500,000 shares during the first five days of March 2010 at an average price of $19.74 leaving him with 1 million shares and 621,923 options.
In his final director’s interest notice in May 2010, the retiring CEO of JB Hi-Fi listed his direct equity interest in the company at 1 million shares and the 621,923 options. For investors who are interested in gaining a possible inside track on the prospects and potential of a business, it may be useful to watch directors’ dealings in their shares.
Of course sometimes the selling can mean nothing at all but my observation is that watching the selling offers some insights. If motivated by urgency, a desire to lock in lofty share prices or grim expectations, information about director’s selling can be more useful than watching their buying.
In April 2011 (about a year later), Richard Uechtritz returned to JB Hi-Fi as a Non-executive director. Until his return, he didn’t have director’s obligations so he was not obliged to make public any of his private share dealings. Upon his return, however, he revealed that he owned only 421,000 options. In other words, he appears to have subsequently sold the one million shares he held at the time of his retirement.
JB Hi-Fi shares do not enjoy the lofty levels they once commanded and investors who tracked the sale of shares by its CEO may have been given a prompt to look deeper into the company, its prospects or at least the impact of those prospects on its shares. Of course it could all be happenstance, company CEO’s have no particular insights and their selling is purely a reflection of the need to diversify. ANy subsequent share price declines may just be coincidental.
JB Hi-Fi’s latest results were less than spectacular and, while the company will continue to win in the race against its listed peers, the reality is its margins remain under increasing pressure, it’s losing share to the internet and its remaining store rollout plan is contributing to a maturing set of metrics. Oh, and the share price now? Just above $9.30.
So do you think you should keep an eye on director’s dealings? What have been your observations? Can you nominate some companies in which directors dealings having given you cause to pause…
Posted by Roger Montgomery, Value.able author, SkaffoldChairman and Fund Manager, 9 May 2012.
by Roger Montgomery Posted in Consumer discretionary, Skaffold, Value.able.
- 46 Comments
- save this article
- 46
- POSTED IN Consumer discretionary, Skaffold, Value.able.
-
Can JBH get its Mojo back?
Roger Montgomery
April 27, 2012
What a difference a high Australian dollar (lots of people travelling and spending their money overseas and not here), a shift to online retailing, deflation, competitors going out of business, higher petrol prices and a more cautious consumer can make in the retail space in just nine months. And few companies are more exposed to all these influences than JB Hi-Fi.
Back in August 2011, the company reported the following in their annual report;
FY11 Sales $2.96b
FY11 NPAT $134.4m
FY11 NPAT Margin 4.5%
Based on these numbers as well as company guidance for sales growth in FY12 of 8% to $3.2b, the consensus analyst view at the time was for 11% FY12 NPAT growth to $150m.
Since that time however, shareholders have suffered three profit downgrades – in mid December, mid February and another this morning.
In this morning’s trading update, management have guided analysts to an estimated NPAT of $100-$105m on sales of $3.1b. Based on this latest announcement, 2012 numbers will look like this (assuming no further downgrades);
FY12 Sales $3.10b
FY12 NPAT $102.5m
FY12 NPAT Margin 3.3%
What’s clear from these numbers is that sales revenue is growing. No immediate issues there. And despite being below the initial 8% forecast, sales are now forecast to grow by 5%. The concern however is that LFL (like-for-like) sales are negative. For the nine months, sales of mature (older established stores) are down 1.3% which means without their current expansion plans, sales targets would not be met. It’s also the main reason their initial 8% sales growth target won’t be met.
But the main issue in forecasting what the business is worth is that despite this incremental sales growth, this is not CURRENTLY being converted to the bottom line. Based on management’s forecasts, NPAT margins will be 3.3% this year vs. 4.5% in the year prior, a 26.7% margin decline in just nine months. No businesses can increase intrinsic value in such an environment.
The tide that’s currently running against JBH is very strong, no plaudits for pointing that out. But when that tide turns, could JB Hi Fi be in an even better position than it was going into the non-resource-recession (a.k.a. the seven cylinder recession of 2012). There’s certainly the possibility and the key is working out when the economy turns and whether the structural changes occurring in retail are enough to adversely impact and offset the benefits of a cyclical turnaround.
Here’s what we are watching:
· Recently management including CEO Terry Smart and Chairman Patrick Elliot have been heavy sellers of their own personal holdings in JBH. What do they know? Why are they selling?
· The retail industry is experiencing a huge shake-up. Many retailers are doing it tough and many more are exciting the space. The Good Guys was being shopped around for a private sale recently with Blackstone rumoured to be the suitor. Later denied by them. Clive Peters (now owned by JBH) and WOW Sight and Sound have gone into receivership and JB’s largest competitor Dick Smith (owned by Woolies) is set to close 100 stores by 2014. Few electronic retailser are investing in growth. The night is darkest just before the dawn so we are looking for evidence that JB Hi Fi is capturing market share in such an environment, either by making acquisitions of distressed sub-scale business or by taking over leases in locations previously unavailable to them. In QLD it appears up to $250m in sales are up for grabs as competitors close. Dick Smiths had $1.5b in sales of which an optimistic analyst would say that JBH could pick up a substantial portion of.
· Currently electronic retailers are on the back foot evidenced by store closures and liquidation sales. These participants are forced sellers of excess stock putting HUGE downward pressure on retail prices and hence profit margins. In March alone, JBH experienced a 200 bps contraction in gross margins. I was silly enough to buy two C3-PO USB keys for my kids at Christmas for $40 each but picked up another two in Brisbane a few weeks ago for $18 at a closing down Dick Smiths (my new book will be called How to Go Broke Saving MoneyTM).
Margin compression of the magnitude reported recently is unprecedented for an operator of JBH’s buying power. So we are looking for signs that the worst is over in terms of competitors closing their doors, a sure sign margins will improve or cease falling precipitously.
· We are also watching closely JBH’s move into the online space. Growth has been excellent in this segment of the business (admittedly off a low base) with an average of 965,000 website visitors each week. That’s 50.2m views per annum – 2.4 times the population of Australia. The trick of course is to convert page views to sales.
· In prior years the business has benefited immensely from positive LFL sales and also an internally funded store-rollout strategy driving new sales and sales as stores matured. This was a tailwind for the business when the number of new stores being added divided by existing stores produced a high ratio. For example when the business only had 50 stores and another 15 were opened, the proportion of stores growing and adding to sales was 30%. At present the business has in excess of 150 stores and is opening 14-15 stores per annum – a ratio of just 10% in new growth. So when you have negative LFL sales in existing and maturing stores, this is a huge drag on business momentum. We are therefore watching for signs that LFL sales stabilise or turn positive so that the business gets its mojo back.
We think it can although we are convinced the very easy money from the store roll out stage of the business along with P/E expansion has been made. Businesses with a leading market position are able to survive traumatic periods in what is a highly cyclical business and are able to absorb the effects of margin compression. Provided they can capture high levels of market share amid the tumult and cement their position as the dominant player JBH might be well positioned for the next economic recovery. One might ask whether ‘Terry and Co’ will be there when that happens.
Skaffold.com Intrinsic Value 13 year chart.

Skaffold’s conservative valuation estimate for JBH is $13.43 for 2013 as can be seen by the thin orange line in the above chart. Whether the share price now approaches that valuation or that valuation instead is revised lower and approaches the price will be determined by whether the company can harness its opportunity and when the irrational pricing associated with collapsing competitors ends. Of course after that, its success will be dependent on the depth of the impact of the structural change represented by the retail shift global and online.
Amid all of your bearishness about housing in Australia, do you think retailing conditions will pick up for JBH and its peers or not? Can you buy goods that JBH sells cheaper online?
Posted by Roger Montgomery, Value.able author, SkaffoldChairman and Fund Manager, 27 April 2012.
by Roger Montgomery Posted in Consumer discretionary, Skaffold.
- 36 Comments
- save this article
- 36
- POSTED IN Consumer discretionary, Skaffold.
-
Guest Post: Thoughts on Risk.
Roger Montgomery
April 19, 2012

RISK: Successful investing is all about managing risk and, as luck would have it, this is one of the things that we, as a species are not particularly good at.
It is demonstrably true that humans are terrible at evaluating the complex risks associated with modern environments. This is not new information and there are plenty of oft referred examples which you can probably bring to mind; how we assess the actual probability of death from road vehicles vs. the perceived risk of death from spiders, snakes, sharks and aircraft (1,414 deaths vs. 32 in Australia 2009), the detrimental health risks of nuclear power vs. the dangers of fossil fuels (for every nuclear power linked death, there are an estimated 4,000 coal related deaths. Both candles and wind power are linked to more deaths than nuclear energy), or the real risk of bacterial infection vs. swine flu or mad cow disease (septicaemia alone was responsible for 993 Australian deaths in 2009).
Even if we acknowledge this shortcoming and integrate this knowledge to inform our everyday decisions, humans are hardwired to act on perceived risk, and are thus influenced to varying degrees by emotion. This is an evolutionary thing, and was suitable during the times that most of our transition to the dominant species occurred, but far less so now. The data necessary to evaluate complex risk often requires computers to calculate, and gut feel just won’t cut it anymore. To make it worse, we (as an aggregated faceless mass of humanity) are more inclined to trust information that reinforces existing beliefs (a well established phenomena known as confirmation bias). In a world where prominent politicians (and others) oppose the use of vaccines responsible for the eradication of polio and smallpox, in direct contradiction of peer reviewed science, finding someone who will tell us that we are right about pretty much anything is not challenging.
In summary, our natural instinct is to assess risk using our perception rather than facts, our perception is very often wrong, and even if we go looking for facts, we are inclined to assign more validity to data that supports our predisposition rather than to conduct an objective assessment.
You want more? In an apparent contradiction, this inability to overestimate our abilities may even confer an evolutionary advantage. Unfortunately, this would work at a species level, rather than for the wealth of the individual, and is a complex topic for another day (more about it here van Veelen,M. and Nowak,M.A. (2011) Evolution: Selection for positive illusions. Nature, 477, 282-283)
So, why is this important, and how is it relevant to investment?
Investment, as we all know, is about accurately assessing risk, and requiring an appropriate return to compensate for these risks to our capital. The more accurately we can assess risk in our investments AND act accordingly, the more likely we are to maximize returns. Knowing that investment is about managing risk however, is VERY different, and a lot easier than doing the work that this understanding requires.
Risk is managed using facts and knowledge. There is no place for gut feel. The more relevant facts we have about an investment, and the more knowledge we have about how to integrate this mass of data, the more accurately we can ascertain risk. As investors, we are looking for opportunities where professionals, with millions of dollars allocated to data collection, and which have analysts with years of experience, have mispriced this risk.
It could be argued that this is not necessarily so, that we could accept the average rate of return, such as with an index ETF. In this case we are accepting the risk premium applied by the market, and the inferred risk premium is out of our control. Historically, the 10 year compound annual rate of return for the ASX is 2.4% (excluding dividends), and for 5 years -3.1%. Even going back 22 years to 1990 only gets you just over 4%. In my opinion, the reward over any of these time frames is clearly inadequate, even allowing for dividends. These returns are comparable or worse than much lower risk investments including cash (not accounting for tax).
This leaves us competing against experienced, well resourced professionals and, more dangerously, many not-so-great investors as we try to outperform the market. In this context a quick look at P/E ratios is unlikely to yield the stocks that will lead to suitable returns. We need to be able to value businesses, find those that are mispriced and, most importantly, identify and assess the risks inherent in our calculations.
There are many tools for valuing businesses, such as the intrinsic value method described by James E Walter and explained much more accessibly in Valu.able, and even some for assessing risk (such as the Macquarie Quality Rating). The research necessary to even partially determine such metrics for all of the companies on the ASX (let alone internationally) with any accuracy is far beyond that available to the average retail investor, so historically we have had to only work on a handful of stocks recommended by professional researchers or investment publications, or use our gut as a first pass.
Like so many other things, the information age has turned this on its head. These days, a single service can value, and assess the quality of, the entire ASX, identifying companies worthy of further, thorough analysis. And this is exactly what products like Skaffold are useful for, and why they always come with a disclaimer.
When you make an investment, it is your cash, and your decision. You will reap the rewards if you get the risks right and pay the price if you do not. Tools like Skaffold (as an implementation of the MQR and intrinsic method) simply remove the noise, and allow you to find gold without having to pan too much gravel. When I first came across the MQR, both Forge Group and JB Hi-Fi were A1 and trading at a discount to estimated I.V. The decision to invest in the former and not the latter was not a function of luck, but an exercise in risk management.
The reason I invested in Forge was, that I know the industry, because I worked in it. I know the way high ROE is achieved in construction and mining services, the kind of businesses that can maintain it, and how such businesses generally grow. After carefully considering all of the available data and quantifying what I did not, or could not know, I felt I really did understand the risk and the potential reward, and as such made the investment.
In contrast, I did not understand how JB Hi-Fi would continue its level of growth, even in the medium term. I also work in the technology industry, and the threat to margins from online retailers was obvious, even two years ago. (This threat and the maturing nature of JBH was written about by Roger Montgomery some years ago) The discount to I.V was there, but the risk that ROE could not be maintained was too high for me. This is not a comment on the quality of JB Hi-Fi as a company, but on its valuation as a growth stock using historical ROE.
Generally, the more we know about managing businesses, the industries in which they operate and the products they are selling, the better we are at identifying and managing risks associated with these activities. If we were running the business we would be assessing strengths, weaknesses, opportunities and threats, barriers to entry, competitive advantage, brand awareness, and R&D just for starters. If we are considering about buying even a small part of a company, we should be doing the same.
In my opinion, I would rather have large investments in a smaller number of companies where I have control of the risk than rely on the brute force of diversification where I accept the risk premium of the market in general. I miss out on a lot of really good stories as a result (I don’t invest in mining exploration stocks for example) but at least I sleep well at night. My capital has been the result of far too much work for me to treat it cheaply.
There will be times when you can’t accurately assess risk, and times when no high quality stocks whose risks you understand are trading at a discount to their intrinsic value. It is times like this that it is hardest to hold your nerve. Remember, you don’t have to invest in the stock market, you can assess other asset classes, or alternatively you can follow Arnold Rothstein’s advice to Nucky Thompson (Boardwalk Empire – I recommend it if you haven’t seen it) for when the path forward isn’t immediately clear or the risks too great.
Do nothing.
Postscript:
- What is more common in Australia, suicide or homicide
- Motor vehicles are the most common cause of deaths attributable to “external causes”, what are the next 3 most likely
- What is the more common cancer in Australian women? Respiratory, digestive or breast?
Answers
- Suicide represents 24% of all deaths by “external causes” compare to 2.4% for deaths attributable to assault. While this probably didn’t surprise you suicide is also far more common in the USA.
- In order; Suicide, Falls and Accidental Poisoning (Snakes, spiders, jellyfish and crocs hardly rate a mention. There were not deaths attributable to snakes on a plane).
- In order; Digestive (4,917), Respiratory (3,080) and Breast (2,722)
Data from ABS census 2009
http://abs.gov.au/AUSSTATS/abs@.nsf/mf/3303.0/
1. van Veelen,M. and Nowak,M.A. (2011) Evolution: Selection for positive illusions. Nature, 477, 282-283, 10.1038/477282a. Available at: http://www.ncbi.nlm.nih.gov/pubmed/21921904 [Accessed September 15, 2011].
“Dividend policies and common stock prices” James E Walter
Author: Dennis Gascoigne is, or has at some time been; a Civil Engineer, Application Developer, Molecular Biologist, Management Executive and Professional Musician. He has held senior management roles in international Australian construction companies, has founded successful businesses in both civil engineering and information technology, and more importantly, played at the Big Day Out. These days he splits his time between genome research, and working on his cattle farm at Tenterfield in the NSW tablelands.
by Roger Montgomery Posted in Insightful Insights.
- 28 Comments
- save this article
- 28
- POSTED IN Insightful Insights.
-
What are Roger’s Value.able Insights into the float of Facebook?
Roger Montgomery
February 1, 2012
Do David Jones (DJS), Myer (MYR), ARB Corporation (ARP), Oroton (ORL), Billabong (BBG), JB Hi-Fi (JBH), Harvery Norman (HVN) or Campbell Brothers (CPB) make Roger’s coveted A1 grade? Watch this edition of Sky Business’ Switzer program broadcast 1 February 2012 to find out and also learn Roger’s views on the pricing of the upcoming Facebook IPO. Watch here.
by Roger Montgomery Posted in Intrinsic Value, Investing Education, Skaffold, TV Appearances, Value.able.
-
Dumped by the wave of Fashion
Roger Montgomery
January 31, 2012
 There was a lot of surfing on the Montgomery annual holiday so I thought I’d publish these thoughts on Billabong International for you. Happy new year and all the best for 2012.
Billabong’s trading update in December attracted a great deal of attention – not only from shareholders who rushed the exits to sell their shares, but also from commentators who noted the result was a symptom of a cyclical and structural shift in the way retail goods, particularly fashion, is bought and sold in Australia.
That Billabong had downgraded its earnings guidance should not have come as a surprise: it is not the first time it has done this. In 2009-10, it announced a series of downgrades then failed to even meet the lowered figure in its full-year result. In 2010-11, it announced downgrades in October and December, then again in March 2011. Billabong is not a stranger to downgrades.
But downgrades aren’t the only reason I have never bought shares in this company. On a number of measures it has failed to live up to the high standards I set for a candidate to enter and remain in an A1 portfolio. On some of those measures it may be argued that Billabong has a “challenging road” ahead – a euphemism for the possibility of a serious structural change, which may include a capital raising, asset sales and/or write-downs.
Retailing in Australia has been doing it tough and I have written previously about the perfect storm facing conventional bricks and mortar retailers in this country.
Another retailer, JB Hi-Fi (ASX: JBH, SQR A3, $12.50), had been 5% of the Montgomery [Private] Fund portfolio until we sold out at $15.50. Our reasoning was simple: given present circumstances (the strong dollar and strong outbound tourism, and the consumer shift to online buying) and expectations for retailing (having spoken to many retailers recently), many retailers would have to revise their earlier outlook statements and this would produce lower future valuations.
Notwithstanding today’s speculation that the announced sale of Dick Smiths by Woolworths (ASX: WOW, Skaffold Quality Score B2, $24.45) will trigger a bid by the grocer for JB Hi-Fi, analysts’ forecasts are typically optimistic in the first half of the financial year (this year being no exception to that rule) and we should therefore be demanding much larger discounts and JB Hi-Fi’s shares were not offering that margin of safety.
I have also noted before that the deflation story – as explained by Gerry Harvey, who says selling plasma TVs for $399 last year means he has to sell three times the volume as last year to make the same money – would put pressure on profits because people already had enough plasma TVs.
Finally, we also believe ANZ’s reported profit growth last year, being dominated as it was by bad debt provisioning writebacks, meant that credit growth was non-existent. When you take away growth in credit card purchases that’s got to hurt discretionary retailers.
Billabong cannot be immune. And a long-winded, multipage analysis of the issues plaguing this company is not required because we’ve never suggested it as an investment.
Billabong reported that its first-half EBITDA in constant currency terms would be $4 million higher, but the company is a global retailer and its reported EBITDA is expected to be 20.8% to 26% lower. The company added that strong growth in constant currency terms in 2012 “is not expected”.
Tellingly, the company also noted that a full strategic review is required and a capital raising cannot be ruled out. The reason for this is simple: in light of deteriorating trading conditions the company has bitten off more than it can chew. This is best seen in the cash flow statement.
In 2010-11 Billabong reported profits of $119 million but cash flow from operations of just $24 million. Subtract dividends of $78 million (why pay dividends if you don’t have the cash?) and capex and investments of $266 million and you have a deficit that needs to be plugged with an equity raising or debt.
Turning to the balance sheet, you will find goodwill amounts to about $1.3 billion. That’s $1.3 billion of “oops-I-paid-too-much” and is more than half of the assets of the company. There’s also borrowings of $600 million and, despite the boost, the company is currently forecast to earn a return on equity of just 7%.
Given my bank is offering 90-day term deposits at 5.95%, I wonder how Billabong’s auditors can justify the carrying value of the goodwill on the balance sheet.
So there are two pretty good reasons you haven’t seen Billabong mentioned as a company to conduct more research on this year – or any year, for that matter.
Investing in 2012 could be largely about avoiding losses. To do that, you will need to watch out for companies whose structures are weak, whose performance is undesirable or whose price is too high. Obviously any stock that harbours all three conditions does not require my comment here.
Billabong’s debt has been rising, its return on equity falling, its balance sheet weakening and as an A4 on Skaffold’s quality scale, it was not investment-grade.
Skaffold’s Quality Score History for Billabong

If you are thinking about investing in retail in the coming year, be sure you know what to look for, even if mouth-watering prices are being offered.Finally, for Skaffold member’s I hope you enjoy update 1.1 you will be receiving today, making Skaffold even more powerful and user friendly. If you are not a member of Skaffold, what are you waiting for? Skaffold is the best way we know of to deal with the market’s main risks;
Don’t miss an opportunity – every stock is covered and updated daily and automatically.
Reduce the risk of paying a high price for a stock – Skaffold’s intrinsic values ten years back and three years forward for every company.
Reduce the risk of buying the wrong company and suffering permanent capital loss – Skaffold’s Quality Scores, cash flow information and projected intrinisic values are updated in real time, keeping you abreast of vital changes to a company’s prospects as an investment candidate.
If you have been thinking about becoming a ‘Skaffolder’ there are few better times to get started than just before companies start releasing their important Half Year results. Skaffold’s intrinsic values are updated live and daily so as company’s prospects are upgraded (or downgraded!) during reporting season, you are likely to find a multitude of opportunities for investigation. Go to www.skaffold.com to get started just as reporting season takes off.
All the best for 2012.
Posted by Roger Montgomery, Value.able author and Fund Manager, 31 January 2012.
by Roger Montgomery Posted in Value.able.
- 10 Comments
- save this article
- 10
- POSTED IN Value.able.
-
Not so High at JB Hi-Fi?
Roger Montgomery
December 16, 2011
 You will have noticed that since November 16 every post here at the Blog has been a cautionary one. You have not seen me post a ‘here’s possible good value’ story. There is a little method in that, even though we might be unduly conservative. But here goes again…
Many of you have heard me discuss JB Hi-Fi and its preferred status among retailers – I believe if JBH is doing it tough everyone else is doing it even tougher. But we sold JBH from our holdings at $15.50 recently and I thought the story of why (ahead of a downgrade as it turns out) would be a good insight into the way we think. Hopefully other investors can gain some insight into the process and fill in the 1) ‘bright prospects’ part of the equation that also requires 2) extraordinary businesses and 3) discounts to intrinsic value.
Starting way back in February 2010 we commented on the impending retirement of JBH’s Richard Uechtritz (now looking as well-timed as other prominent CEO departures, such as the Moss departure from Macquarie and I am sure you can list a few more – go right ahead) and the maturing outlook for the business itself.
“If JB Hi-Fi could re-employ all of its profits at the returns of about 45% it is generating now, its value would be over $38. That’s a pipe dream. The company is generating cash faster than it can ask its employees and contractors and landlords to employ the funds to open new stores. And because the profits also produce taxes and associated franking credits that have no value for the company, shareholders are being handed back the funds, which is a disappointment. However, as chairman Patrick Elliott implied when I spoke with him on radio this week, this is a function of growth and the limited size of the Australian population.
It happens eventually to all retailers and it will happen to JB Hi-Fi in the next five to seven years. The best you can hope for is that once the stores have saturated the market, directors stick to their knitting, and the company continues to generate high returns but pays out all of those earnings out as a dividend (becoming like a bond) rather than make some grand attempt to buy something offshore or diversify too far away from their core expertise (often at the behest of some institutional shareholder) and blow up the returns.
The result of not employing as much retained earnings at 45% is that the intrinsic value declines. It is still going up but not as much.”
In August here at the blog we wrote:
“The big story however is that Terry Smart will need to start looking beyond this organic growth to other strategies if JB Hi-Fi is to avoid developing the profile of another mature Australian retail business like Harvey Norman.”
and
“JB Hi-Fi needs to establish new and emerging business models to try and counter the shift away from physical music unit sales.”
and
“Having said that, the current sales environment is probably not representative of the future. Share market investors generally use the rear view mirror when assessing the future. I have previously discussed the “economics of enough”, which David Bussau from Opportunity International introduced me to many years ago. As it applies to consumers generally, they will get sick of trying to keep up with the latest technology, be happy with their TVs and replace everything less often – opting instead to ‘experience’ travel, food, adventure and other cultures. That of course doesn’t mean JB can’t grow its share-of-wallet. In the face of declining retail sales volume growth over the last five to ten years and deflation, JB is proving it is already the market leader.”
and
“JB Hi-Fi’s quality score dropped from A1 to A3 and interestingly, this was only partly due to the increase in debt. (We really need to know whether it was just timing issues and new stores that contributed to the jump in inventory).”
In addition to these comments I wrote more recently:
“The release of the iPhone 4S seemed to underwhelm technology reviewers when launched and a portion of the population do take their purchasing cues from such quarters.
The 4S is apparently an evolution in the iPhone series, rather than a revolution, and as such, fewer users of the most recent release – the iPhone 4 – will upgrade. Instead, it is likely that they will wait until the iPhone 5 is released next year (owners of the previous model the iPhone 3GS, however, should be coming off their two-year contracts about now and are expected to upgrade). We’ll come back to that shortly.
The iPhone doesn’t contribute anything like a majority profit to JB Hi-Fi’s bottom line. This is because margins on Apple products are slim. But the iPhone does generate foot traffic and phone upgraders also buy protective covers and other accessories on which JB Hi-Fi makes much more significant margins.
So why do we care so much about the iPhone?
It’s because when JB Hi-Fi announced its full-year results the company forecast more than $3 billion in sales and management cited growth from computing, telco, and accessories. They said:
“While we anticipate the market to remain challenging, our diversified product portfolio, particularly the categories of computers, telco and accessories, from which we expect strong growth, will assist JB Hi-Fi in delivering another year of solid sales and earnings in FY12. Assuming trading conditions are comparable with FY11, we expect sales in FY12 to be circa $3.2b, an 8% increase on prior year.”
It’s the lower “telco and accessories” sales that are expected to stem from the iPhone 4S underwhelming so-called early adopters and its most ardent fans that may put pressure on that sales forecast.”
Indeed the only thing that was going for JB Hi-Fi was its discount to intrinsic value. Many investors believe that a stock I mention is below intrinsic value is a “darling’ of mine. It isn’t. A company must meet all of our criteria and it will only be held for as long as it does. Those of you using Skaffold will however have seen JBH was trading only at a discount to one of the intrinsic value estimates – the intrinsic value based on analyst forecasts – but not the more conservative Skaffold Line valuation estimate of $13.16. See Figure 1.
Figure 1.

Both valuations are now likely to decline further in coming days -even the more conservative $13.16 valuation SKaffold has been displaying – and the downgrade may also be reflected in pressure on the company’s cash flow which Skaffold members would have already seen in the 2011 results and which prompted some of the above comments. (See Figure 2. and note the negative funding gap line (international patents pending))
Figure 2. Showing declining operation cash flow and a growing Funding Gap (patents pending).

JB Hi-Fi was 5 per cent of our portfolio however we sold all of our position at $15.50 recently. Our reasoning was simple; Given present circumstances and expectations for retailing (having spoken to many retailers recently) many retailers JB Hi-Fi would have to revise their earlier outlook statements and this would produce lower future valuations. At the same time analyst forecasts are typically optimistic in the first half of the financial year (this year being no exception to that rule) and we should therefore be demanding much larger discounts and JBH was not offering that margin of safety. We also commented to our peers in conversations over the phone and in person that the delfation story – as explained by Gerry Harvey who noted selling plasma TVs for $399 this year means he has to sell three times the volume as last year to make the same money – would put pressure on profits because people already had enough plasma TVs. Finally we also believed that ANZ’s profit growth being dominated by bad debt provisioning writedowns meant that credit growth was non-existant. When you take away growth in credit card purchases – thats got to hurt discretionary retailers.
On November 7 we wrote to our Montgomery [Private] Fund investors thus:
“We aren’t so arrogant to presume we know what will happen next. We have taken earnings expectations for 2012 and beyond (expectations that are typically optimistic in the first half of a financial year) and reduced them to where we believe they could safely be regarded as conservative. The resultant estimations for intrinsic values … are significantly lower and suggest we should require larger margins of safety before committing your funds to many companies…I expect in coming months we may not be as aggressive in purchasing and you might even find our cash levels increase. It’s always preferable to protect capital because we can come back to reinvest at any time. Recovering from losses is much more challenging and demoralising for you.”A prominent media commentator and broker however wrote on December 6
“Our No.1 discretionary retail recommendation remains JB Hi-Fi (JBH). We all know 21% of JBH’s register is currently shorted, a massive short position usually reserved for financial impaired or structurally stuffed stocks. JBH is neither, and that is why we continue to be aggressively recommending buying the stock which generates 25% of its annual profit in December. JBH is trading on 11.2x bottom of the cycle earnings. Nowadays, the P/E’s of cyclical stocks compress with their earnings, meaning that both P/E and E bottom concurrently.”
So, JBH still has long term prospects that surpass many of its peers and I believe it still has a competitive advantage. And if all those short sellers cover their position, the stock could rally. That however would be speculating. On the flip side, changes to accounting reporting standards will give it a lot more liabilities – contingent liabilities such as operating leases will need to come onto the balance sheet. Also, the medium outlook, which includes deflation continuing, will put pressure on JB to sell more volume at precisely the time everyone may just have enough stuff. Finally, the market may now finally catch up to the maturity story we described way back in 2010. Of course consumers will return at some point and spending and credit growth will recover, but given the current weakness and fear among consumers the idea of requiring very, very large discounts to the more conservative estimates of intrinsic value dominates our thinking.
As always be sure to do your own research and seek and take personal professional advice.
Posted by Roger Montgomery, Value.able author and Fund Manager, 16 December 2011.
by Roger Montgomery Posted in Companies, Consumer discretionary, Investing Education, Skaffold.
-
Should you be readying yourself?
Roger Montgomery
September 23, 2011
 If you’re sitting at home or in your office wondering if the party is over and it’s all turned to pumpkins and mice, allow me to offer you a few insights.
I know of seasoned market practitioners that have deferred the upping of stumps to set up new businesses because they believe there is worse to come. I also know of prominent Australians that are cashing up and I have met with many professional investors who liken the current conditions to those preceding a severe recession or even depression. Berkshire Hathaway shares are trading below $100,000 for the first time in a while (not that it matters). And Bill Gross at Pimco reckons the fact that you can get a better yield over two years by ‘barbelling’ – putting 10 per cent into 30 year bonds and 90 per cent into cash – and beat the yield on 2yr T-Notes is destroying credit creation and so low yields are having the opposite effect to the stimulation they are intended to generate.
Ok. So what do I think?
These are the times to prepare yourself for the possibility of another rare opportunity to buy extraordinary businesses at even more extraordinary discounts to intrinsic value. You have to be ready, you have to have your Value.able intrinsic valuations prepared and your preferred safety margins calculated.
In the short term (6-12 months), on balance, I think shares could get even cheaper (As I write those words, I log on to see the European markets down five per cent and the Dow Jones opening down more than 3 per cent and I am conscious of the fact that an outlook can be tainted by the most recent price direction). But our large cash proportion/position in The Montgomery [Private] Fund since the start of the calendar year has reflected for some time the impact of this possibility on future valuations and our requirement for larger discounts to intrinsic value.
Longer term, I like some of the research put out by McKinsey. The new infrastructure, such as roads, ports, railways and terminals that developing countries such as China, India and South America will need, will require tens of trillions of dollars. McKinsey Global Institute analysis reckons that by 2030 the supply of capital could fall short of demand to the tune of $2.4 trillion – a credit crunch that will slow global GDP growth by a percentage point annually. Even if China and India cool off, a similar gap could occur.
Back to the immediate outlook and there is a simple mental framework that I have been using to think independently about all the ructions impacting our portfolios.
I am no economist, but its pretty easy to see that if trend line US economic growth is barely 1 per cent, then any slowdown in the business cycle will push the economy towards the zero growth line. One per cent is quite simply very close to zero and the business cycle can push growth rates around more than the difference between them. Every time there is a whiff of a slowdown, there will, at the very least ,be fears of another recession. Again, I am not forecasting a recession nor am I forecasting slow growth. Indeed, I am not forecasting at all. I am simply pointing out the fact that tiptoeing on the edge of a precipice (the US at 1 per cent growth) is more frightening than doing circle work in a paddock a long way from any edge at all (China at 7, 8 or 9 per cent growth). Bill Gross’s comments about the destruction of credit further feeds the idea of a slowdown.
On balance I believe there will be some very attractive buying opportunities in the next six to twelve months. Before you read too much into this statement, I should alert you to the fact that I say it every year.
Analysts are prone to optimism too.
I think it’s also appropriate to remember that analysts typically are generally optimistic about earnings forecasts at the start of a financial year. This can be seen in another McKinsey research note (as well as thousands of other similar studies), where analysts commented:
“No executive would dispute that analysts’ forecasts serve as an important benchmark of the current and future health of companies. To better understand their accuracy, we undertook research nearly a decade ago that produced sobering results. Analysts, we found, were typically overoptimistic, slow to revise their forecasts to reflect new economic conditions, and prone to making increasingly inaccurate forecasts when economic growth declined.
Alas, a recently completed update of our work only reinforces this view—despite a series of rules and regulations, dating to the last decade, that were intended to improve the quality of the analysts’ long-term earnings forecasts, restore investor confidence in them, and prevent conflicts of interest. For executives, many of whom go to great lengths to satisfy Wall Street’s expectations in their financial reporting and long-term strategic moves, this is a cautionary tale worth remembering.”
And concluded: “McKinsey research shows that equity analysts have been overoptimistic for the past quarter century: on average, their earnings-growth estimates—ranging from 10 to 12 percent annually, compared with actual growth of 6 percent—were almost 100 percent too high. Only in years of strong growth, such as 2003 to 2006, when actual earnings caught up with earlier predictions, do these forecasts hit the mark.”
Demand bigger discounts
Those thoughts provide the ‘Skaffolding‘ in my mind around which I construct an opinion of where the landmines and risks may be for an investor. I tend to 1) look for much bigger discounts to intrinsic values that are based on analyst projections for earnings and 2) lower our own earnings expectations for those companies we like best.
Cochlear is one example of this. Many analysts have forecast a 10-20 per cent NPAT decline from the recent recall of their Cochlear implant. Only one analyst has considered and forecast a 40-50 per cent NPAT decline. The truth will probably be somewhere in between. Such a decline however would come as a shock to many investors if it were to transpire. And so it is important to be aware of that possibility when calibrating the size of any position in your portfolio. In other words, be sure to have some cash available for such an event because intrinsic value based under that scenario is between $23 and $30.
Your “Top 5”
Earlier this month I asked you to list your “Top 5” value stocks – those that you believed represented good value at present. I was delighted to receive so many contributions.
On behalf of the many Value.able Graduates and stock market investors who read our Insights blog thank you for sharing with us the result of all your fossicking, digging and analysis.
There were more than 115 suggestions. The most popular was Forge Group with 16 mentions.
The following table presents the Quality Score, FY2011 ROE, FY2011 Net Debt/Equity and 2012 Value.able Intrinsic Value for Forge Group (FGE), BHP, Cochlear (COH), M2 Telecommunications (MTU), Woolworths (WOW), ARB Corp (ARP), CSL , Data#3 (DTL), Matrix (MCE), Fleetwood (FWD), JB Hi-Fi (JBH), Mineral Resources (MIN), Blackmores (BKL), Flight Centre (FLT), Lycopodium (LYL), Monadelphous (MDN), Integrated Research (IRI), 1300 Smiles (ONT), ThinkSmart (TSM) and ANZ.

As you know these quality scores and the estimates for intrinsic values can change at a moments notice (just ask those working at Cochlear!) so be sure to conduct your own research into these and any company you are considering investing in and as I always say, be sure to seek and take personal professional advice.
Posted by Roger Montgomery and his A1 team, fund managers and creators of the next-generation A1 stock market service, 23 September 2011.
by Roger Montgomery Posted in Companies, Insightful Insights, Investing Education, Market Valuation.
-
What has probing the reporting season avalanche revealed?
Roger Montgomery
August 24, 2011
With reporting season in full swing, I would like to share my insights into whose Quality Score has improved, and whose has deteriorated. Remember, none of this represents recommendations. It is intended to be educational only. You must seek and take personal professional advice before acting or transacting in any security.
To date, 232 companies have reported their annual results. I am sure you can understand why we feel snowed under. With almost 2,000 companies listed on the ASX, the avalanche still has a way to roll.
We have updated all of our models for each of the 164 companies that we are interested in. As you know, we rank all listed companies from A1 down to C5. The inputs for those rankings always come from the company themselves. I would hate to think how bipolar they would be if we allowed our emotions and personal preferences to infect those ratings (or be swayed by analyst forecasts)!
Rather than arbitrary and subjective assessments, we download some 50-70 Profit and Loss, Balance Sheet and Cash Flow data fields from each annual report to populate five templates. All of these templates employ industry specific metrics to calculate the Quality Scores. This allows us to rank every ASX-listed business from A1 – C5. Its our objective way to sort the wheat from the chaff.
For Value.able Graduates not familiar with our scoring system, company’s that achieve an A1 Score are those we believe to be the best businesses, and the safest. C5s are the poorest performers and carry the highest risk of a possible catastrophic event.
A1 does not mean nothing bad will ever befall a company. A1 simply means to us that it has the lowest probability of something permanently catastrophic. Further, ‘lowest probability’ doesn’t mean ‘never’. A hundred-to-one horse can still win races, even though the probability is low. Similarly, an A1 business can experience a permanently fatal event. In aggregate however, we expect a portfolio of A1 businesses to outperform, over a long period of time, a portfolio of companies with lesser scores.
With that in mind, we are of course most interested in the A1s and – on a declining scale – A2, B1 and B2 businesses.
So, who has managed to retain their A1 status this reporting season? And which businesses have achieved the coveted A1 status? If you hold shares in any of the companies whose scores have declined (based of course on their reported results), please read on.
Of the companies that have reported so far, last year 20 of them were A1s, 28 were A2s, one was a B1 and 13 scored B2. That’s an encouraging proportion, although we tend to discover each reporting season that the better quality businesses and the better performing businesses are generally keen to get their results out into the public domain early.
Its towards the end of every reporting season where the quality of the businesses really drops off. This is always something to watch out for – companies trying to hide amongst the many hundreds reporting at the end of the season. It’s always a good idea to turn up to a big fancy dress party late, if you aren’t in fancy dress.
This year we have seen the number of existing A1s fall to nine from 20, A2s from 28 to 24, B1s rise from one to two and B2s fall from 13 to six.
The first table shows all twenty 2009/2010 A1 companies that have reported to date. You’ll see a number of very familiar names in here, including ARB Corp (ARP), Blackmores (BKL), Cochlear (COH), Carsales.com (CRZ), Fleetwood (FWD), Mineral Resources (MIN), Platinum Asset Management (PTM), REA Group (REA), DWS (DWS), Forge (FGE), K2 Asset Management (KAM), Macquarie Radio Network (MRN), Nick Scali (NCK), 1300 Smiles Limited (ONT), SMS Management & Technology (SMX), Webjet (WEB), JB Hi-Fi (JBH), Navitas Limited (NVT), Saunders International (SND) and GUD Limited (GUD). Nine have maintained their A1 rating this year.

Now, before you go jumping up and down, a drop from A1 to A2 is like downgrading from Rolls Royce to Bently. When we talk about A2s, its not a drop from RR Phantom to a Ford Cortina, not that there’s anything wrong with the old Cortina (if you are too young to know what I am talking about Google it!).
The only big rating decline is GUD Holdings, which made a large acquisition (Dexion) during the year. Indeed, a common theme amongst the higher quality and cashed up businesses this reporting season has been the deployment of that cash towards, for example, acquisition or buybacks (think JB Hi-Fi).
Moving onto the 2009/2010 A2 honour roll: Codan Limited (CDN), Advanced Share Registry Limited (ASW), Commonwealth Bank (CBA), Credit Corp (CCP), CSL Limited (CSL), Decmil (DCG), Domino’s Pizza (DMP), NIB Holdings (NHF), OZ Minerals (OZL), Plan B Group (PLB), RCG Corporation (RCG), Sedgman Limited (SDM), Slater & Gordon (SGH), Super Retail Group (SUL), Wellcom Group (WLL), Argo Investments (ARG), AV Jennings (AVJ), Carindale Property Trust (CDP), Computershare (CPU), Euroz Limited (EZL), Oakton (OKN), Tamawood (TWD), Austal Limited (ASB), LBT Innovations (LBT), Academis Australasia Group (AKG), Chandler Mcleod Group (CMG), The Reject Shop (TRS) and Primary Health Care (PRY).

The businesses that make up this list showed slightly more stability. The biggest fall in quality this year was Primary Healthcare (PRY),which is still struggling to digest the large purchases it made a few years ago. The Reject Shop (TRS) also declined, to B3. TRS is still investment grade and we would lean towards believing this is a short-term decline, given the floods in QLD that caused the complete shutdown of their new distribution center and the massive disruptions subsequently caused. As the company said, you can’t sell what you haven’t got!
Finally, B1 and B2 companies: Leighton Holdings (LEI), Alesco Corp (ALS), Mount Gibson Iron (MGX), Amcom Telecommunications (AMM), Data#3 (DTL), Ansell Limited (ANN), Fortescue (FMG), Little World Beverages (LWB), Stockland (SGP), iiNet (IIN), MaxiTRANS Industries (MXI), Newcrest Mining (NCM), SAI Global (SAI), Gazal Corporation (GZL) and Salmat (SLM).

About half the companies in the B1/B2 list retained or improved their ratings from last year. Mind you, half also saw their rating decline!
The clear fall from grace is Leighton Holdings, whose problems have been well documented in the media and via company presentations.But once again, like The Reject Shop, this could be a temporary situation. If the forecast $650m profit comes through, I expect LEI’s quality score will improve. What the dip will do, however, is remain a permanent reminder that Leighton is a cyclical business. Getting the quote right on a job is important, even more a massive enterprise like Leightons.
Are you surprised by any of the changes? We certainly were!
Sticking to quality is vitally important. That’s what my team and I do here at Montgomery Inc, and its what our amazing next-generation A1 service is all about. Value.able Graduates – your invitation is pending.
If you are yet to join the Graduate Class, click here to order your copy of Value.able immediately. Once you have 1. read Value.able and 2. changed some part of the way you think about the stock market, my team and I will be delighted to officially welcome you as a Graduate of the Class of 2011 (and invite you to become a founding member of our soon-to-be-released next-generation A1 service).
Remember, you must do your own research and remember to seek and take personal professional advice.
We look forward to reading your insights and will provide another reporting season update soon.
Posted by Roger Montgomery and his A1 team, fund managers and creators of the next-generation A1 service for stock market investors, 24 August 2011.
by Roger Montgomery Posted in Companies, Insightful Insights, Investing Education, Value.able.


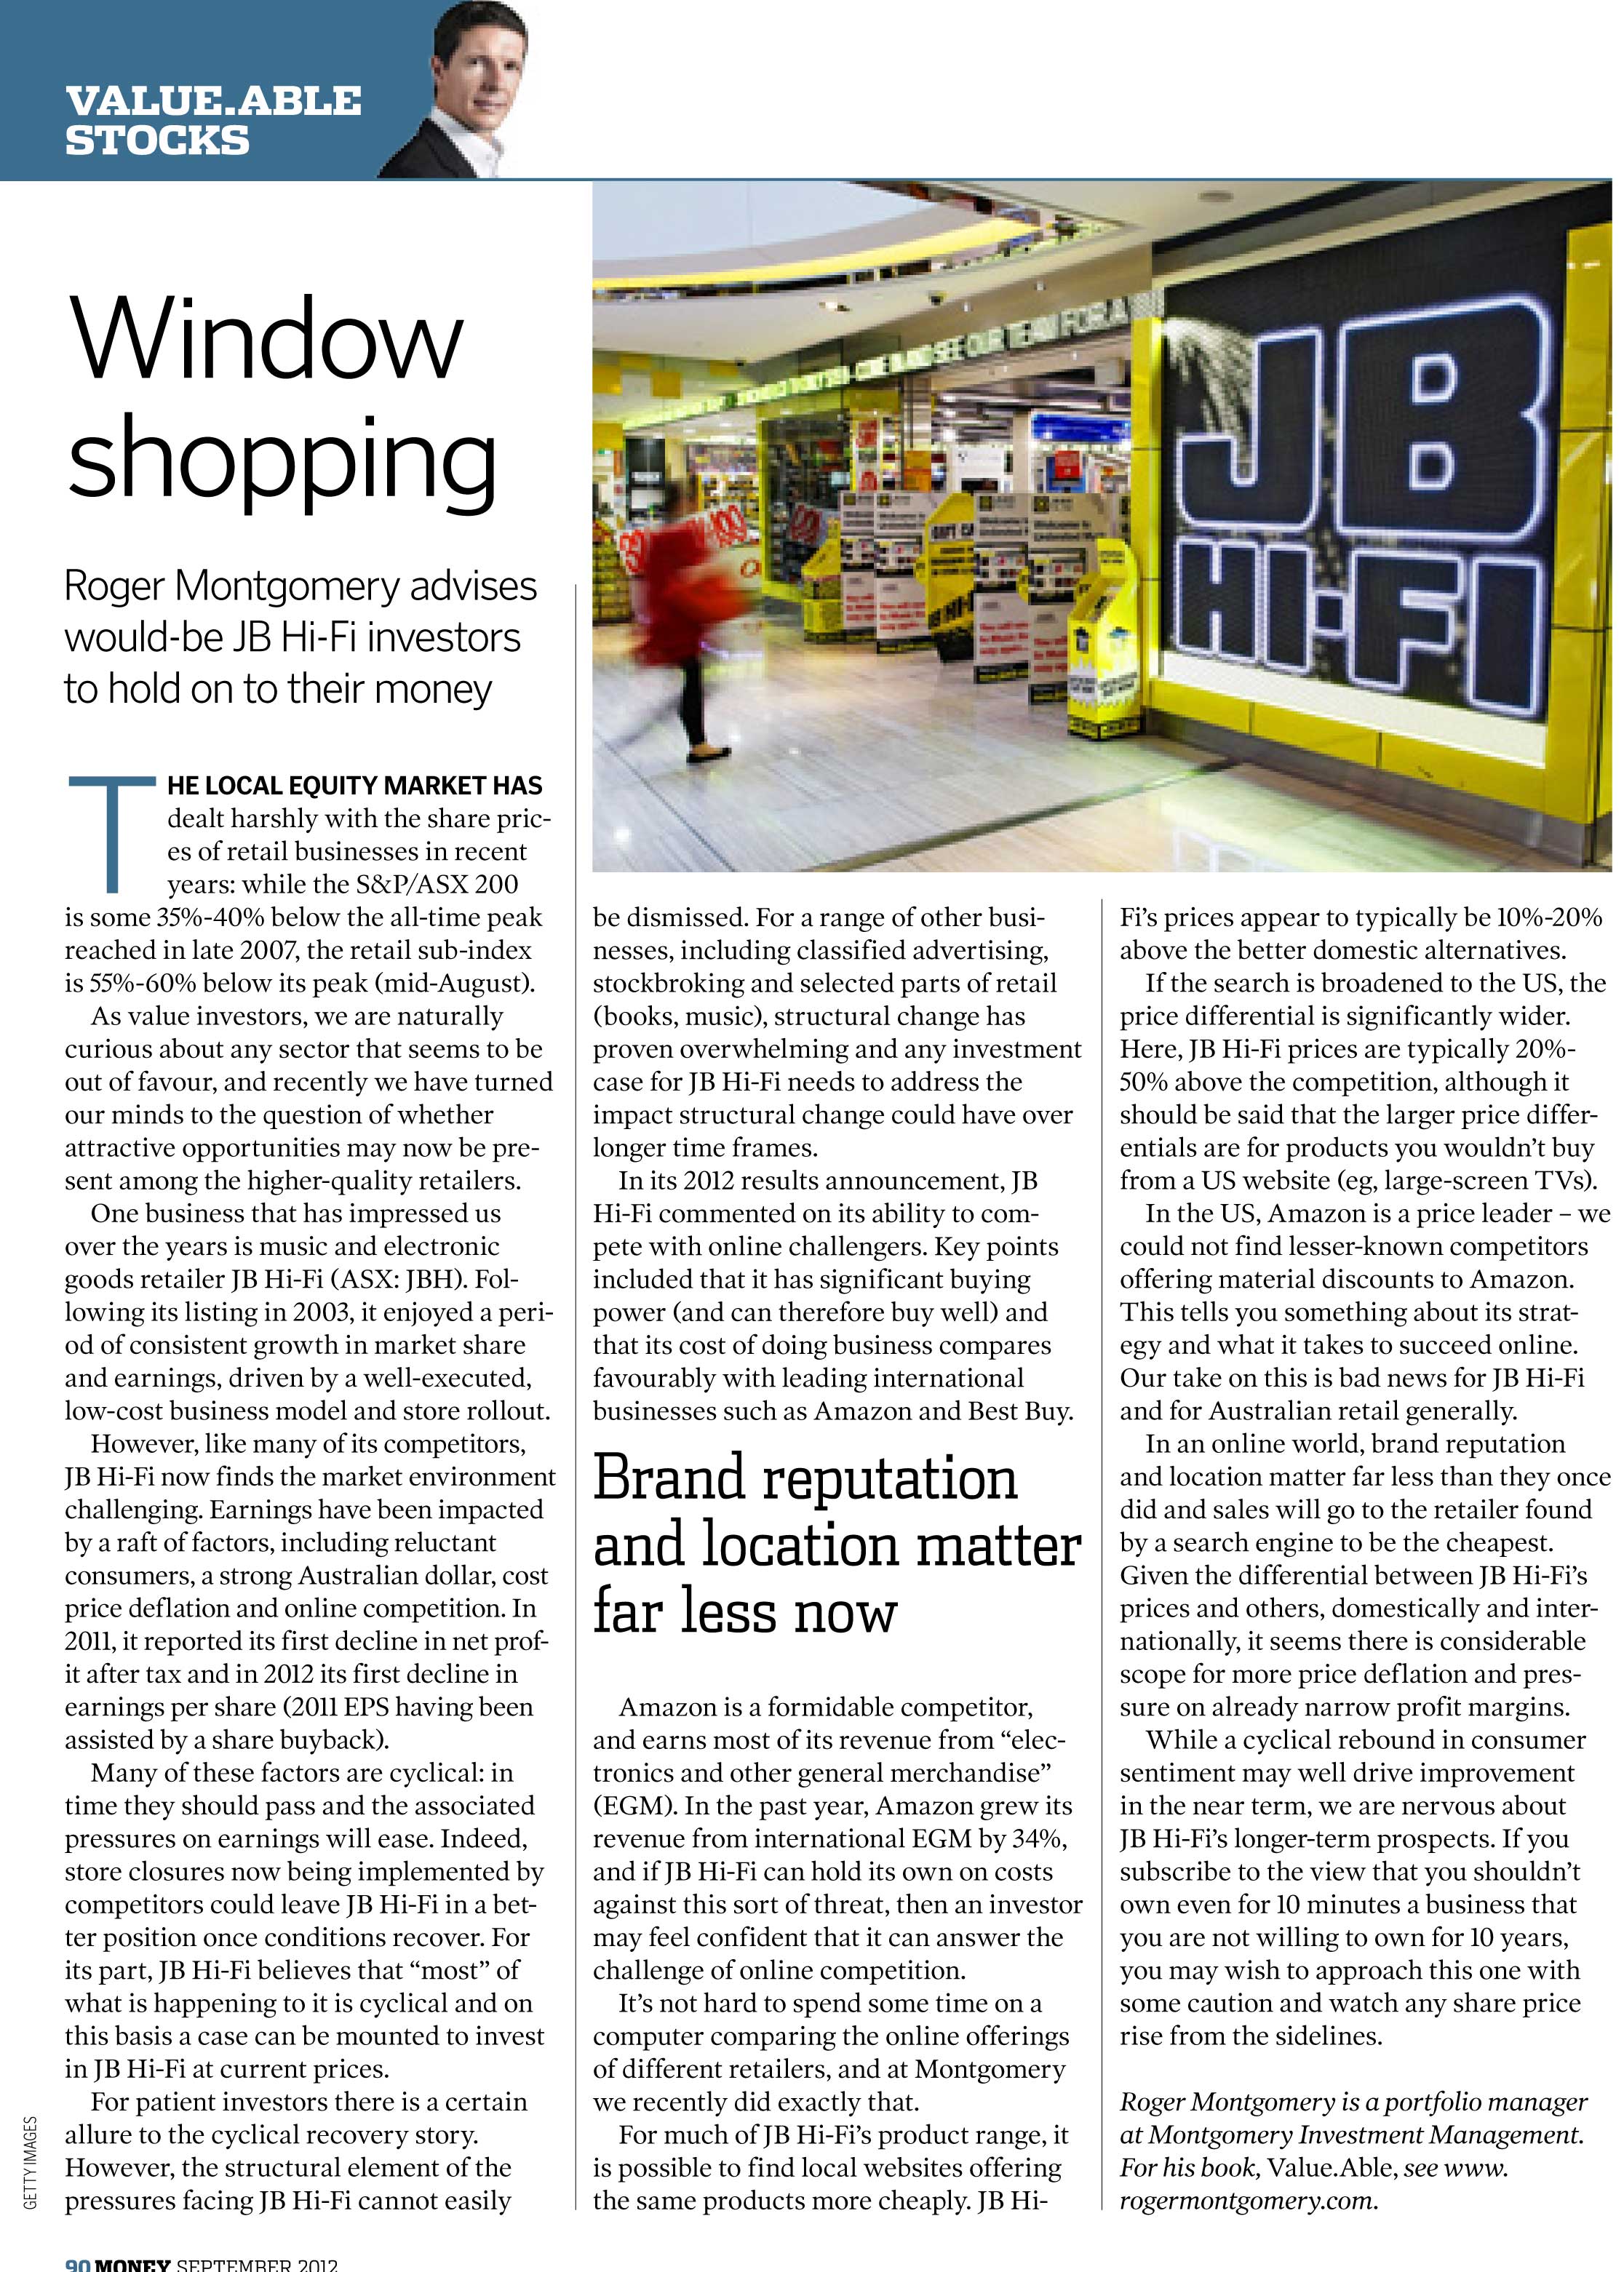