Companies
-
Downgrading!
Roger Montgomery
June 6, 2013

According to one of our brokers, 127 companies have thus far announced downgrades for FY13. Throw Cochlear into the mix and that’s 128. continue…
by Roger Montgomery Posted in Companies, Insightful Insights.
- 11 Comments
- save this article
- POSTED IN Companies, Insightful Insights
-

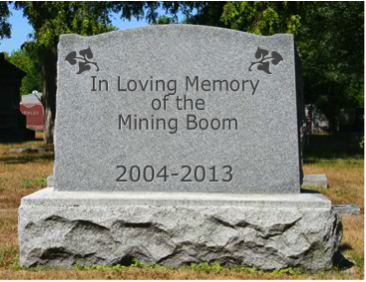
A look at Fleetwood
Ben MacNevin
June 5, 2013

Fleetwood is a business that specializes in building two forms of accommodation – homes with wheels (e.g. caravans), and villages for miners. As such, the company’s share price is highly exposed to the mining cycle – it increased from $2 at the start of 2003 to peak above $10 in 2007. The share price then plunged below $4 in 2008. From this trough it again surged, this time to $14 in 2011, but has since fallen back to $4. continue…
by Ben MacNevin Posted in Companies.
- 15 Comments
- save this article
- POSTED IN Companies
-

Analysing developments at Cochlear
Tim Kelley
June 5, 2013

Disappointing news from Cochlear (COH) this week. Following weak 2nd half sales, the company announced that it expected FY13 NPAT to fall between $130 and $135m – a large step down from what broking analysts had expected. continue…
by Tim Kelley Posted in Companies.
- save this article
- POSTED IN Companies
-

A look at Credit Corp Group Limited’s prospects
Russell Muldoon
May 27, 2013
If a picture is worth a thousand words, we thought that after a recent meeting with Credit Corp Group Limited’s (CCP) management, a timetable would be helpful in showing how we currently anticipate the next few years playing out for the company. continue…
by Russell Muldoon Posted in Companies, Insightful Insights.
- 3 Comments
- save this article
- POSTED IN Companies, Insightful Insights
-

JB Hi-Fi on the up?
Ben MacNevin
May 8, 2013
Last week, within the first few minutes of sitting in a conference room listening to an update by Terry Smart, one of Australia’s smartest retailers, he announced a sales and profit upgrade. Naturally having a position in JB Hi-Fi (JBH) is pleasing.
continue…by Ben MacNevin Posted in Companies, Insightful Insights.
- 2 Comments
- save this article
- POSTED IN Companies, Insightful Insights
-

WHITEPAPER
THE PROPERTY RUG PULL
Discover how proposed changes to negative gearing, Capital Gains Tax and holiday home tax rules could reshape property investing, and why investors may consider private credit as property returns become less certain and tax advantages diminish.
READ HERE -

Structural change?
Russell Muldoon
April 29, 2013
Even though we haven’t owned Blackmores shares, last week we read their regular quarterly update for the first nine months of 2013. We did so with some concern. At the top-line, a reported a 29% jump in revenue looks like a strong result. At the bottom-line, the 7% NPAT decline is troubling for a number of reasons.
continue…by Russell Muldoon Posted in Companies, Insightful Insights.
- 5 Comments
- save this article
- POSTED IN Companies, Insightful Insights
-

Resmed – 3rd quarter results
Ben MacNevin
April 27, 2013
Resmed has just announced another record quarterly result. For those unfamiliar with Resmed, the company is a manufacturer of flow generators and masks for sufferers of Obstructed Sleep Apnea (OSA). OSA is a condition that causes the airways to temporarily close while sleeping (apnea means “without breath”).
continue…by Ben MacNevin Posted in Companies, Insightful Insights.
- 5 Comments
- save this article
- POSTED IN Companies, Insightful Insights
-

Operating leverage and financial leverage is a No No
David Buckland
March 26, 2013

Shi Zhengrong received his Doctorate from the University of New South Wales’ School of Photovoltaic and Renewable Energy Engineering in 1992 under Professor Martin Green, the “father of photovoltaics”.
After working for Pacific Solar, a university spinoff, Dr Shi returned to China in 2001 to start the solar power company, Suntech.
Suntech Power Holdings Limited listed on the New York Stock Exchange and over the two years to late 2007 its share price climbed from $15 to above $88.
continue…by David Buckland Posted in Companies, Insightful Insights.
- 4 Comments
- save this article
- POSTED IN Companies, Insightful Insights
-

The irrational “Mr Market”
Ben MacNevin
March 20, 2013
Charlie Munger is one the most influential investors in the world today. As a founding partner of Berkshire Hathaway with Warren Buffett, Munger is known for his ability to logically process a number of steps in quick succession by employing about 90 relatively simple mental ‘models’.
You may be interested in the link below – to a speech that Charlie Munger presented and in which he discusses many of these models. The speech is well worth a read if you seek to improve your ability to make logical investment decisions (indeed, many of our blog posts reference these models in some way).
continue…by Ben MacNevin Posted in Companies, Insightful Insights, Investing Education, Market Valuation.
-

Wylie E. Coyote or Road Runner?
Roger Montgomery
March 7, 2013
You will have to forgive the rather startling image we have chosen for this blog post. Its really been selected for dramatic effect only.
You may not realise this but all the way back in August 2010 we were BHP bulls, writing; “If you take on blind faith a A$22b profit, BHP’s shares are worth AUD $45-$50 each.”
But then in February 2011 we became a little more circumspect. You can read about the change here.
continue…by Roger Montgomery Posted in Companies, Energy / Resources, Investing Education, Value.able.