Companies
-
Can you feel it?
Roger Montgomery
October 28, 2011
 There’s something in the air…. And you may be able to assist.
Skaffold® is set to go live and I am incredibly proud of what Team Skaffold have achieved.
Before Skaffold, the stock market was noisy and confusing. Very soon, all that will change. Skaffold will reinvent and reignite the way you invest.
The data that automatically updates Skaffold each day is from arguably the world’s most reputable source (that’s right, not all data is the same!). With customers that spend hundreds of millions of dollars a year for our provider’s data, we have been delighted with their fascination and interest in Skaffold.
As you may already know, Skaffold’s designers and developers have been recognised by design awards and industry accolades and already work for Nintendo, EA Games – the world’s biggest games company, Google, HTC, and Porsche. Like us, they are immensely proud of Skaffold and are putting together their own video for the launch to showcase Skaffold to international IT media and judges. Their Managing Director is even flying to Sydney for the launch!
Here at home, we are building a team with amazing international credentials and their task is simple: make sure Skaffold stays at the cutting edge of stock market applications.
Here is how you could help: We’re still searching for someone super smart, who can mentor, teach and lead a team, who knows, understands and loves the stock market, can be RG 146 compliant and is truly passionate about talking one-on-one with and helping private and professional investors. If that’s you, or you know someone that fits the bill, we want to hear from you!
A1 or C5, Skaffold’s Quality Scores are powered by more than 40 years of published academic research into the predictors of company failure and and investment returns. And the secret herbs and spices in Skaffold’s valuations – and the ways they change – have won me over time and time again.
I must confess to having a bit of fun recently… I uploaded some international data, and looked at IBM, Apple, Google and Microsoft and… nothing surprising. Skaffold just worked. No whacky valuations either like the $800 for Apple or $400 for IBM or $60 for Microsoft that I have seen elsewhere. In time, I imagine we’ll be able to switch on Turkish stocks, if that’s what you want!
The team and I have been genuinely encouraged by your excitement. What’s also been really amazing is the anticipation, not only from private investors like you and me, but from brokers, other fundies, planners and advisers who have expressed a real need to independently ’stress test’ their own research or the stocks on their approved lists.
One friend recently said we had developed a Ferrari that Volvo drivers will love to drive. I reckon that’s about the sum of it. And congrats, by the way, to Ian – one of very first investors who jumped the gun, sent in his cheque and guaranteed himself Member #2 status for life.
Get ready to enjoy looking at the Australian stock market like you have never seen it before. Put 1 November 2011 in your diary to Join Skaffold and be part of our mission to make every investor a professional.
Skaffold is the world’s most reputable company data married to half a century of leading investment thinking and the world’s most exciting and easy-to-use interface for investors. We can’t wait to hear what you think of Skaffold after you have made it part of your investment routine.
Posted by the Skaffold Team, 28 October 2011.
Skaffold® is a registered trademark of Skaffold Pty Limited
by Roger Montgomery Posted in Companies, Value.able.
- save this article
- POSTED IN Companies, Value.able
-
If value nags, are you listening?
Roger Montgomery
October 19, 2011
 Value.able investors can be forgiven for giving up. You wait so long for value to be presented and then when it appears it just hangs around, remaining ‘good value’ for what seems an age. Value can sometimes nag and nag and by the time action becomes urgent, the newest and least patient value investors are no longer listening. I can see it in the statistics of my friend’s financial services businesses and no doubt it’ also being felt by tip sheets purveyors and CFD merchants. For all the talk of value investing, few really have the patience to succeed.
Value.able-style investors can be forgiven for giving up. You wait so long for value to appear and then when it does, its just hangs around. STocks that were expensive, become cheap and then, simply, boringly, stay cheap. Value can sometime nag and nag and by the time action becomes urgent, the newest and least patient investors are no longer listening. I have no doubt this is impacting the revenues of the tip sheet purveyors and the CFD merchants, indeed any business in financial services whose revenue is dependent on investors maintaining the faith.
That is the situation I was recently delighted to observe as the Cochlear share price plunged another 14% to $51.30, or about 40% since its April 2011 high of $85.
Recently I ascribed to Cochlear’s shares, a valuation of $59. Since 2004 the price has been persistently above my intrinsic value estimate, which means the combination of circumstances that have pushed the share price below value most recently are worth exploring.
Cochlear has the largest market share for cochlear hearing implants worldwide and, after announcing a voluntary recall of its flagship Nucleus CI500 implant range recently (the Nucleus accounts for more than 70% of sales), investors voted with their feet and the stock fell more than 20%.
The recall was voluntary and relates only to those devices that have not been implanted. The devices have a fail rate of about 1% and the fault – due to moisture on 1 of 4 diodes from loss of seal – is not believed to be harmful in any way, the device simply shuts down.
With about 25,000 of the units in use globally, that implies around 250 recipients of the implant will be affected and although that is significant, the proactive and patient-focused response of the company should ensure the reputational damage is contained.
As Cochlear’s technicians work to isolate the problem with the Nucleus 5 range, the company will dust off the Nucleus Freedom range, which it has marketed successfully for many years against products such rivals as Advanced Bionics and Med-El.
Med-El is gaining market share in the US generally but patients waiting for implant surgery have switched to the Cochlear Freedom product and apparently with no delays.
At the same time as Cochlear’s recall, Advanced Bionics received FDA approval to sell its product (which was itself recalled in November last year) into the US market. This turn of events is not unusual for the industry … but it is unusual for Cochlear and that’s why the news came as such a blow. Cochlear is one of the highest-quality companies trading on the ASX today. The company that almost never puts a foot wrong appears to have tripped itself up and investors became spooked.
And in that reaction a potential opportunity may be presented.
The financial impacts of these events won’t be fully known until later in the year but is expected currently to be $130 – $150 mln, translating to an after tax impact of about $20 mln.
Over the past decade, Cochlear has increased profits every year with the exception of 2004. Net profit was just $40 million in 2002 and most recently the company reported profits of $180 million for 2011.
Operating cash flow over the same period has risen from less than a $1 million (an exception for 2002) to more than $201 million, allowing debt to decline to just $63 million from nearly $200 million in 2009. Net gearing is now minus 1.86%.
Those impressive economics have resulted in an intrinsic value that has risen by nearly 18% each year since 2004. If your job as a long-term investor is to find companies with bright prospects for intrinsic value appreciation – believing that in the long run prices follow values – then it quite possible that Cochlear is being served up on a plate.
The recently reported net profit figure of $180.1 million for 2011 was up 16% and in line with consensus analyst estimates, although this occurred despite sales of $809.6 million exceeding analysts’ estimates. It seems the analysts did not expect the EBIT and NPAT margins that were reported. These were flat, which given a very strong Australian dollar, suggests impressive efficiency gains in the operations.
If only that blasted “Australian peso” would go down and stay down!
Back on August 19, 2009, I wrote in the Eureka Report: “Fully franked dividends have risen every year for the past decade, growing by almost 500% (or 22% pa) since 2000. These are not numbers to be sneezed at; the company has produced an impressive and stable return on equity since 2004 of about 47% with very modest debt. Clearly this is a company worth some significant premium to its equity.”
Nothing changed really for 2011. A final dividend of $1.20 per share was 70% franked and up 14%.
Importantly, it seems Cochlear’s market is growing. Unit sales volumes were up 17% for the year and, given in the first half they were up 20%, it suggests the second half were up 14%. Double digit growth was reported in sales volumes for all major regions and Asia was the most impressive, rising more than 30% to the point where it makes up 16% of total revenues.
This really is impressive stuff. Just two years ago the company reported unit sales growth of only 2%, to 18,553 units, and many analysts were blaming slow China sales. Nobody expected the company to ever repeat its 2007 and 2008 volume growth of 24% and 14% respectively, and certainly not off a higher base. Growth has always been viewed as being limited by the high cost of the devices and the reliance on insurance and healthcare schemes to subsidise the costs and those of surgery to implant to them.
According to the World Health Organization however, almost 280 million people suffer from moderate to profound hearing loss and an ageing population means this figure will rise. Cochlear is one of a handful of companies that actively contributes to improving the quality of life of its clients.
When great companies stumble, the impact can be exaggerated by the reaction of shareholders who never believed it could happen. Then comes a wave of selling amid doubts that the company will ever regain its mantle.
But strong market share and strong cash flow, high returns on equity and low debt, are rarely offered at bargain prices so I picked up some Cochlear stock for the Montgomery [Private] Fund. It is expected that I will to add to this position over the coming weeks and months (provided value remains) when the full financial impact of the recall is known.
I must confess I didn’t bet the farm on this particular investment because the financial impact of the recall remains uncertain; when that changes it will impact my intrinsic value estimate.
Whatever the impact, it will be temporary, even though it won’t necessarily preclude lower prices from this point. During the GFC, Cochlear shares fell from $78 to $44. No company is immune to lower share prices and I don’t know when or in what order they will transpire.
What I do know is that in 2021 we aren’t likely to be thinking about this recall, just as nobody now talks about the Wembley Stadium delays that dogged Multiplex back in 2006. Mercifully, investors’ memories tend to be short.
Recalls, competition, marketing gaffes and wayward salary packages are all part of the cut and thrust of business and if lower prices ensue for Cochlear shares, it will be important to determine whether the recall will inflict permanent scars. My guess is that it will not. I wonder whether you are listening for value?
Posted by Roger Montgomery, Value.able author and Fund Manager, 19 October 2011.
by Roger Montgomery Posted in Companies, Health Care, Investing Education.
- save this article
- POSTED IN Companies, Health Care, Investing Education
-
What closed Sydney Harbour Tunnel last night?
Roger Montgomery
October 11, 2011
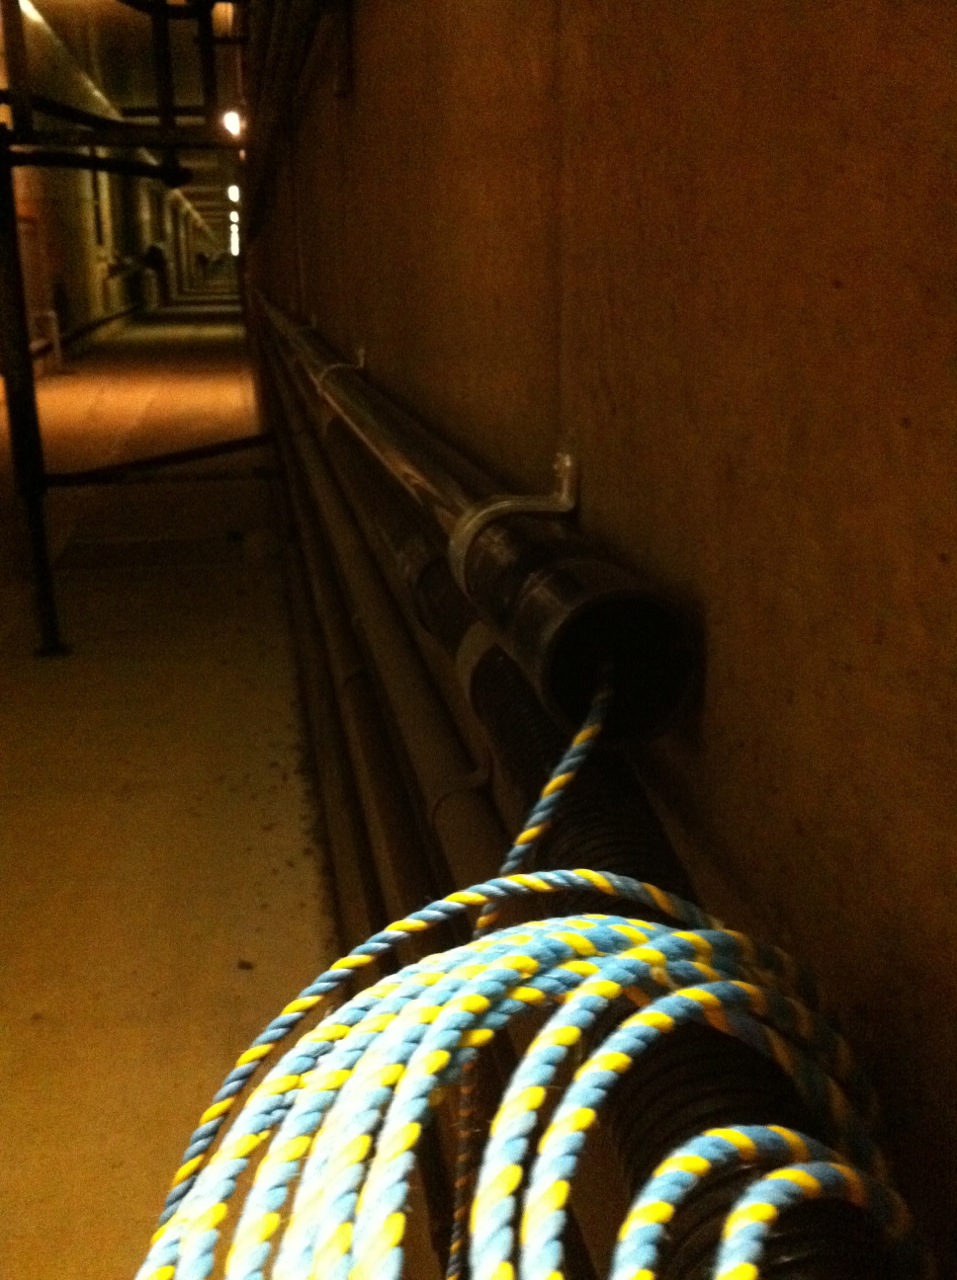
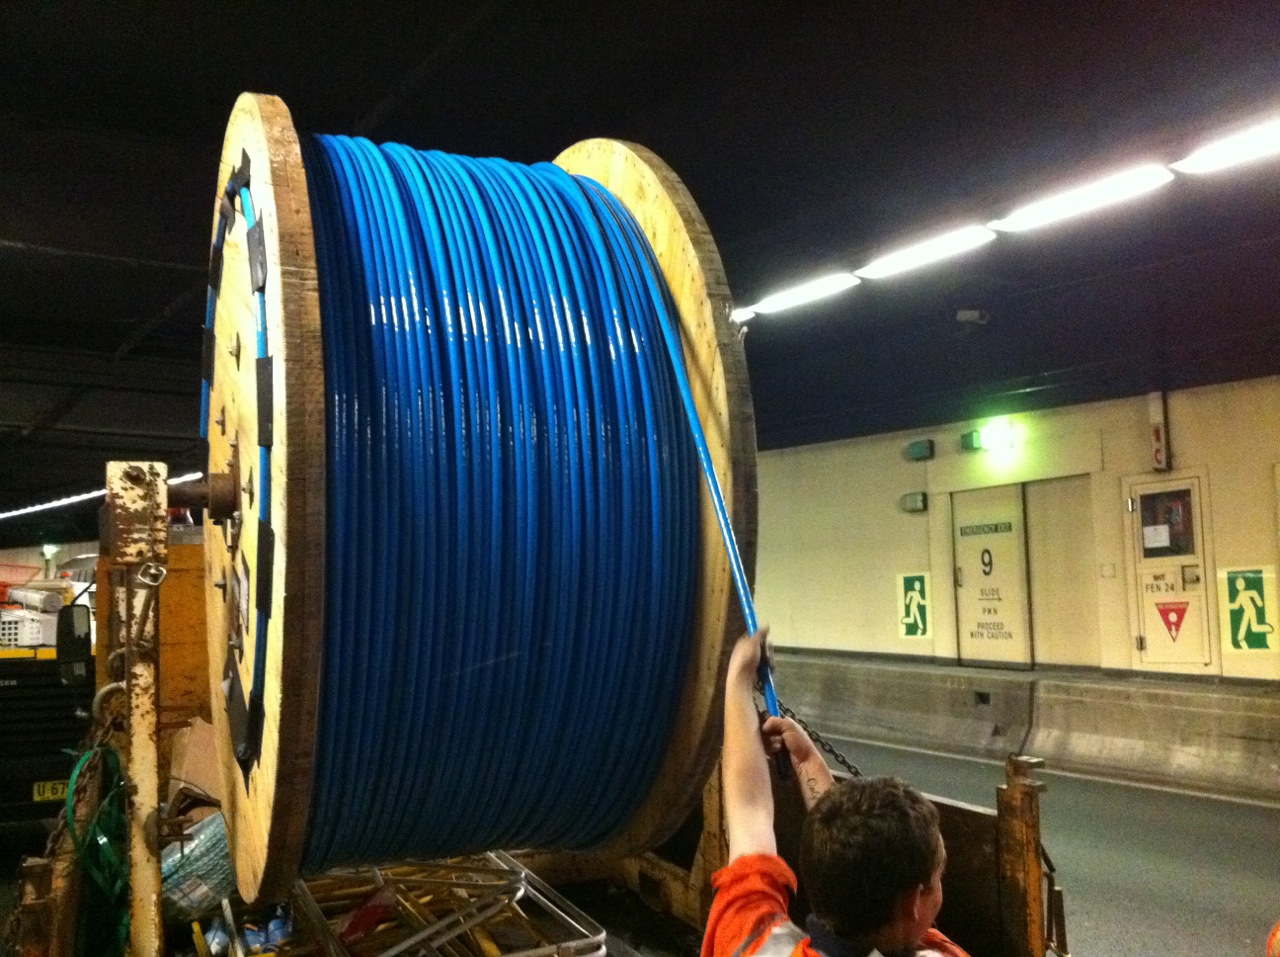
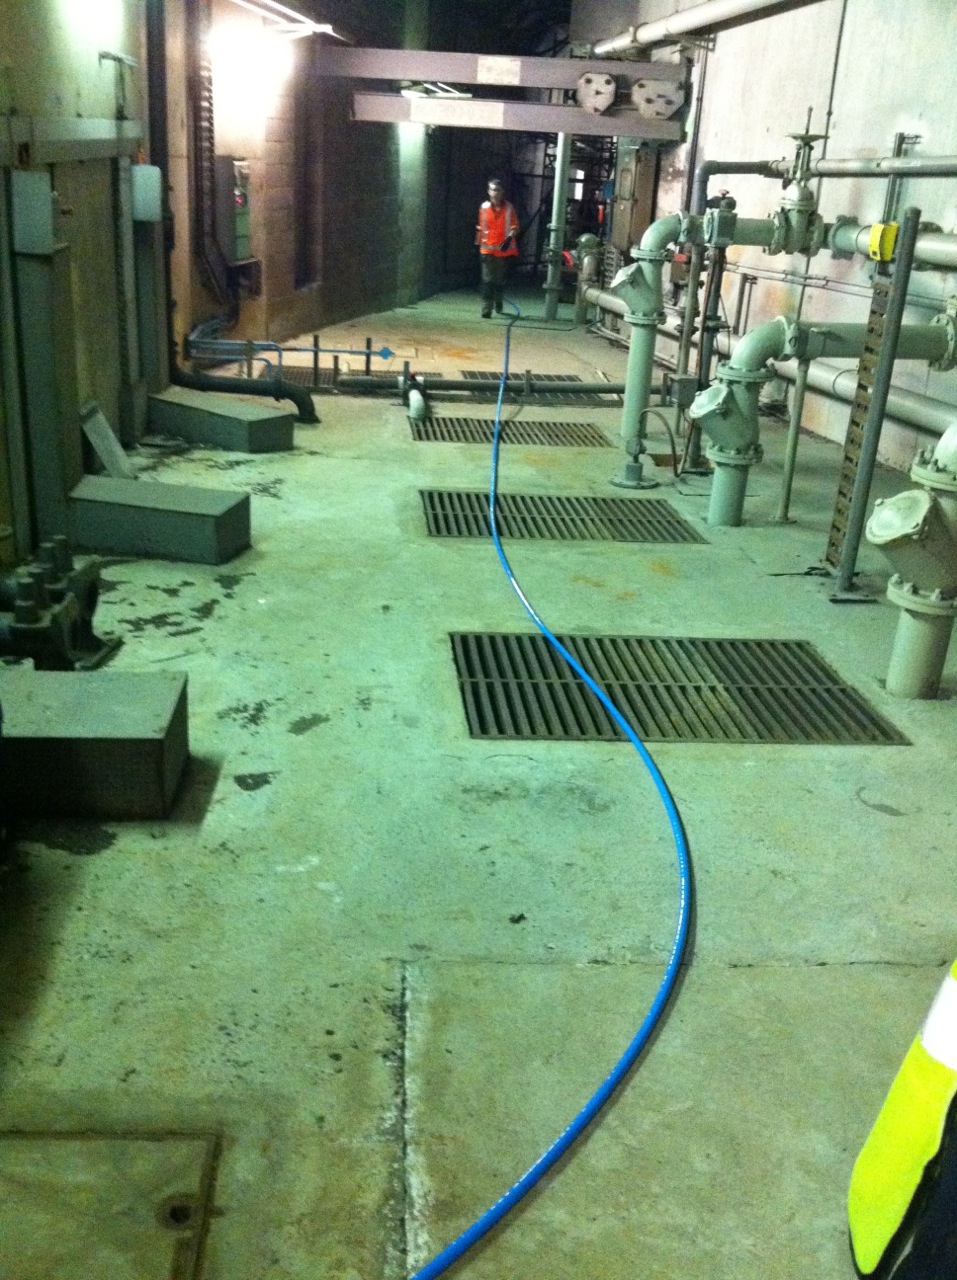
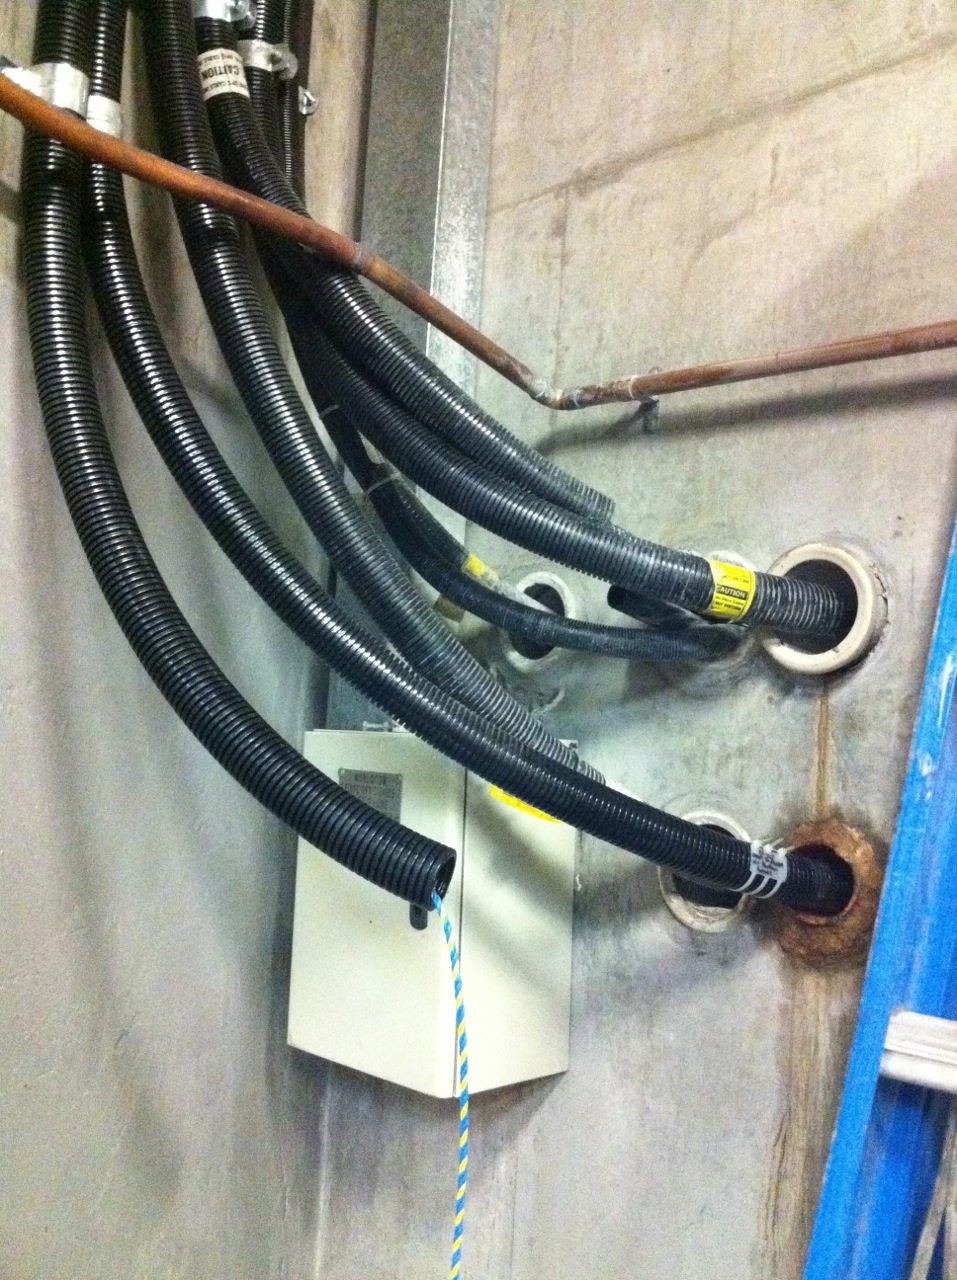
Vocus Communications is in the business of selling bandwidth. The company resells it on the cable that runs under the Pacific between Sydney and the US. Last night they laid some of their own under another sea; Sydney Harbour. The company – in which I have previously disclosed I own a small number of shares – sent me these photos of the process. As we have met with management as part of our analysis, we were delighted they remembered our interest in everything they are up to. I thought these photos were fascinating and given its something most of us wouldn’t ever get a glimpse of, I thought you’d be interested too.
There’s no investment merit in the photos so don’t go rushing off to buy shares (certainly not without conducting your own research and after seeking and taking personal, professional advice).
Think of this post as a Value.able photo essay of what some people are up to while you were sleeping.
Meeting point and briefing at the North end of the Tunnel
A closed Sydney Harbour Tunnel
A very empty Sydney Harbour Tunnel
Hauling starts about 900mtrs from the South Exit. It’s a single piece of fibre from end to end
3kms of conduit installed the previous few nights
First meter of fibre coming off the drum
Energy Australia, the RTA and the other carrier’s fibre exiting the tunnel on the South Side
Fibre coming out of the Tunnel on the North side
Posted by Roger Montgomery and his A1 team (courtesy of Vocus Communications), fund managers and creators of the next-generation A1 stock market service, 6 October 2011.
by Roger Montgomery Posted in Companies, Investing Education, Technology & Telecommunications, Value.able.
-
Which A1 twin is outperforming?
Roger Montgomery
October 6, 2011
 This journey began with the simple question Will David beat Goliath?
Value.able Graduate Scott T resolved to take up a fight with conventional investing, by tracking the performance of a typical and published ‘institutional-style’ portfolio against a portfolio of companies that receive my highest Montgomery Quality Ratings.
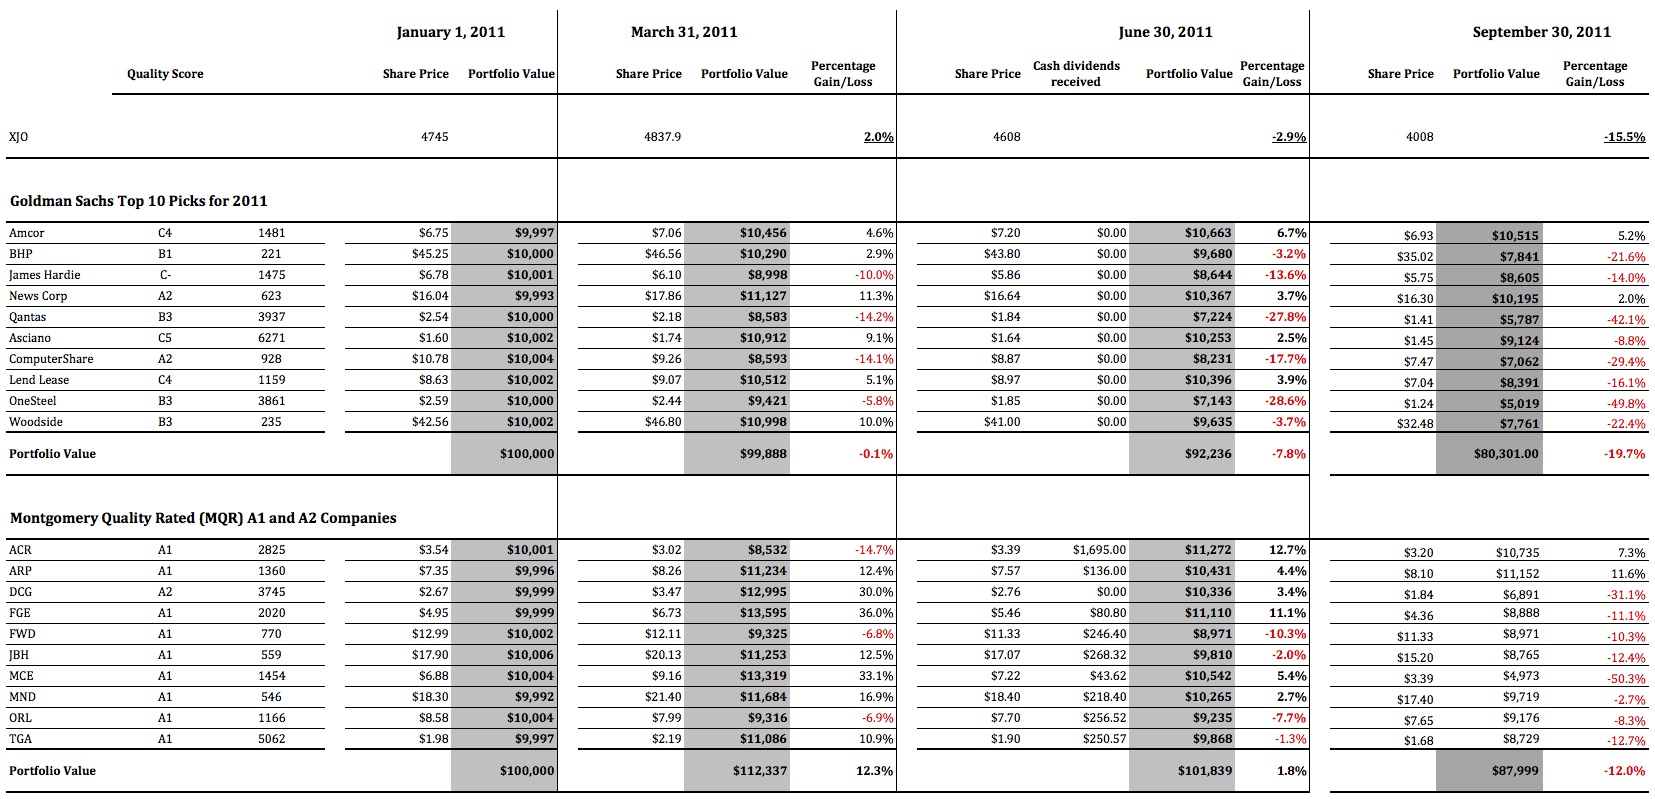
By 30 June 2011 the A1 portfolio was up 1.8 per cent compared to the XJO, which was down 2.9 per cent. As for the conventional ‘institutional’ portfolio, the bankers were down 6.2 per cent.
Over to Scott T for his third quarter update…
“For new readers to Roger Montgomery’s Insights Blog, welcome. Here at Roger’s blog we are conducting a 12-month exercise measuring the performance of a basket of 10 stocks recommended by Goldman Sachs, against a basket of 10 A1 or A2 businesses that were selling for as big a discount to Intrinsic Value as we could find.
“Nine months have now passed since our twin brothers each invested their $100 000 inheritance, and it has been a very turbulent time in the market.
“Our Queensland regional accountant has had his head down at the office for the entire quarter. The end of the financial year had come and gone and hundreds of clients where sending in their tax documentation, calling with questions and chasing their refunds. Time flew by in the office, and he hardly had time to try to attract new clients, let alone watch the daily gyrations of the global equities markets. By the end of September when he was finally able to take a breath and look at the performance of his portfolio.
“He was surprised at how poorly his portfolio of A1 and A2 companies, acquired at prices less than they were worth, had faired. But he quickly realised the overall market had done even worse. Loosing 12 per cent, or $12 000, YTD was bad. But it could have been worse, much worse.
“His twin brother was in a world of pain. The federal department he worked for felt like it was under attack. The mood in the department was that the media seemed hell bent on criticising everything the government did. No initiative was well received and every announcement was instantly compared to last months failure. To top it all off, every night he would check his portfolio, to see how much more of his inheritance had vanished. The red negative number on his spreadsheet just seemed to steadily increase. With little information to go on, and a feeling of helplessness washing over him, he thought seriously about visiting his financial advisors, desperately seeking reassurance, and perhaps changing the mix of the stocks held. He resounded, “Buying what they advised would be good for 2012”.
“As per the first half of the year, dividends will be picked up in the fourth quarter, when shares have finished going ex-dividend and the dividends have actually been received.
“In summary for the nine months to 30 September 2011:
The XJO is DOWN 15.5 per cent
The Goldman Sachs Portfoliois DOWN 19.7 per cent
The A1 and A2 Portfolio is DOWN 12.0 per cent
The A1 and A2 Portfolio has achieved an OUTPERFORMANCE of 3.5 per cent over the XJO and 7.7 per cent over the Goldman Sachs portfolio.“Here are the portfolios in detail, including cash dividends received in the first half (click the image to enlarge)
“We will visit the brothers again at the end of December for a final wrap up of their first year, and discuss their strategies for 2012
“All the Best
Scott T”Thank you Scott.
How is your A1 portfolio performing?
Posted by Roger Montgomery and his A1 team, fund managers and creators of the next-generation A1 stock market service, 6 October 2011.
by Roger Montgomery Posted in Companies, Insightful Insights, Investing Education, Value.able.
-
Should you be readying yourself?
Roger Montgomery
September 23, 2011
 If you’re sitting at home or in your office wondering if the party is over and it’s all turned to pumpkins and mice, allow me to offer you a few insights.
I know of seasoned market practitioners that have deferred the upping of stumps to set up new businesses because they believe there is worse to come. I also know of prominent Australians that are cashing up and I have met with many professional investors who liken the current conditions to those preceding a severe recession or even depression. Berkshire Hathaway shares are trading below $100,000 for the first time in a while (not that it matters). And Bill Gross at Pimco reckons the fact that you can get a better yield over two years by ‘barbelling’ – putting 10 per cent into 30 year bonds and 90 per cent into cash – and beat the yield on 2yr T-Notes is destroying credit creation and so low yields are having the opposite effect to the stimulation they are intended to generate.
Ok. So what do I think?
These are the times to prepare yourself for the possibility of another rare opportunity to buy extraordinary businesses at even more extraordinary discounts to intrinsic value. You have to be ready, you have to have your Value.able intrinsic valuations prepared and your preferred safety margins calculated.
In the short term (6-12 months), on balance, I think shares could get even cheaper (As I write those words, I log on to see the European markets down five per cent and the Dow Jones opening down more than 3 per cent and I am conscious of the fact that an outlook can be tainted by the most recent price direction). But our large cash proportion/position in The Montgomery [Private] Fund since the start of the calendar year has reflected for some time the impact of this possibility on future valuations and our requirement for larger discounts to intrinsic value.
Longer term, I like some of the research put out by McKinsey. The new infrastructure, such as roads, ports, railways and terminals that developing countries such as China, India and South America will need, will require tens of trillions of dollars. McKinsey Global Institute analysis reckons that by 2030 the supply of capital could fall short of demand to the tune of $2.4 trillion – a credit crunch that will slow global GDP growth by a percentage point annually. Even if China and India cool off, a similar gap could occur.
Back to the immediate outlook and there is a simple mental framework that I have been using to think independently about all the ructions impacting our portfolios.
I am no economist, but its pretty easy to see that if trend line US economic growth is barely 1 per cent, then any slowdown in the business cycle will push the economy towards the zero growth line. One per cent is quite simply very close to zero and the business cycle can push growth rates around more than the difference between them. Every time there is a whiff of a slowdown, there will, at the very least ,be fears of another recession. Again, I am not forecasting a recession nor am I forecasting slow growth. Indeed, I am not forecasting at all. I am simply pointing out the fact that tiptoeing on the edge of a precipice (the US at 1 per cent growth) is more frightening than doing circle work in a paddock a long way from any edge at all (China at 7, 8 or 9 per cent growth). Bill Gross’s comments about the destruction of credit further feeds the idea of a slowdown.
On balance I believe there will be some very attractive buying opportunities in the next six to twelve months. Before you read too much into this statement, I should alert you to the fact that I say it every year.
Analysts are prone to optimism too.
I think it’s also appropriate to remember that analysts typically are generally optimistic about earnings forecasts at the start of a financial year. This can be seen in another McKinsey research note (as well as thousands of other similar studies), where analysts commented:
“No executive would dispute that analysts’ forecasts serve as an important benchmark of the current and future health of companies. To better understand their accuracy, we undertook research nearly a decade ago that produced sobering results. Analysts, we found, were typically overoptimistic, slow to revise their forecasts to reflect new economic conditions, and prone to making increasingly inaccurate forecasts when economic growth declined.
Alas, a recently completed update of our work only reinforces this view—despite a series of rules and regulations, dating to the last decade, that were intended to improve the quality of the analysts’ long-term earnings forecasts, restore investor confidence in them, and prevent conflicts of interest. For executives, many of whom go to great lengths to satisfy Wall Street’s expectations in their financial reporting and long-term strategic moves, this is a cautionary tale worth remembering.”
And concluded: “McKinsey research shows that equity analysts have been overoptimistic for the past quarter century: on average, their earnings-growth estimates—ranging from 10 to 12 percent annually, compared with actual growth of 6 percent—were almost 100 percent too high. Only in years of strong growth, such as 2003 to 2006, when actual earnings caught up with earlier predictions, do these forecasts hit the mark.”
Demand bigger discounts
Those thoughts provide the ‘Skaffolding‘ in my mind around which I construct an opinion of where the landmines and risks may be for an investor. I tend to 1) look for much bigger discounts to intrinsic values that are based on analyst projections for earnings and 2) lower our own earnings expectations for those companies we like best.
Cochlear is one example of this. Many analysts have forecast a 10-20 per cent NPAT decline from the recent recall of their Cochlear implant. Only one analyst has considered and forecast a 40-50 per cent NPAT decline. The truth will probably be somewhere in between. Such a decline however would come as a shock to many investors if it were to transpire. And so it is important to be aware of that possibility when calibrating the size of any position in your portfolio. In other words, be sure to have some cash available for such an event because intrinsic value based under that scenario is between $23 and $30.
Your “Top 5”
Earlier this month I asked you to list your “Top 5” value stocks – those that you believed represented good value at present. I was delighted to receive so many contributions.
On behalf of the many Value.able Graduates and stock market investors who read our Insights blog thank you for sharing with us the result of all your fossicking, digging and analysis.
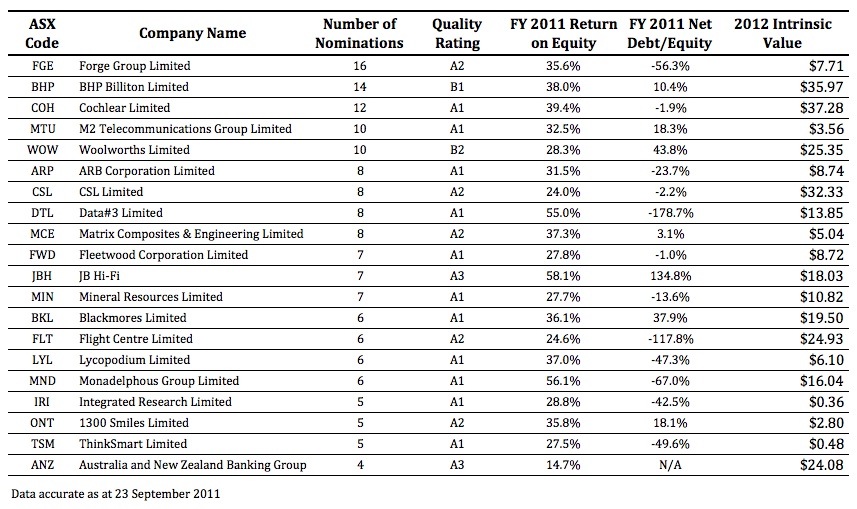
There were more than 115 suggestions. The most popular was Forge Group with 16 mentions.
The following table presents the Quality Score, FY2011 ROE, FY2011 Net Debt/Equity and 2012 Value.able Intrinsic Value for Forge Group (FGE), BHP, Cochlear (COH), M2 Telecommunications (MTU), Woolworths (WOW), ARB Corp (ARP), CSL , Data#3 (DTL), Matrix (MCE), Fleetwood (FWD), JB Hi-Fi (JBH), Mineral Resources (MIN), Blackmores (BKL), Flight Centre (FLT), Lycopodium (LYL), Monadelphous (MDN), Integrated Research (IRI), 1300 Smiles (ONT), ThinkSmart (TSM) and ANZ.
As you know these quality scores and the estimates for intrinsic values can change at a moments notice (just ask those working at Cochlear!) so be sure to conduct your own research into these and any company you are considering investing in and as I always say, be sure to seek and take personal professional advice.
Posted by Roger Montgomery and his A1 team, fund managers and creators of the next-generation A1 stock market service, 23 September 2011.
by Roger Montgomery Posted in Companies, Insightful Insights, Investing Education, Market Valuation.
-
Are these the best value stocks right now?
Roger Montgomery
September 8, 2011
 With reporting season over, and armed with the Value.able mantra, how are you uncovering the very best stocks worthy of your attention?
Lifebuoy soap was once marketed as Floating Above the Rest. Are there any companies post reporting season doing the same?
While many of my peers believe 2012 could be a very difficult year for investors, there are currently a selection of companies that appear to be both high quality and trading at prices offering a rational safety margin compared to our estimates of their intrinsic value.
Each reporting season we present a short-list of companies worthy of careful analysis. This reporting season is no different. As always, the list is not exhaustive. You are free to agree, disagree or append the list. Indeed, I encourage you to do so. For debate often brings A1 ideas.
I decided to look for Large Caps, Mid Caps, Small Caps, Micro Caps and Nano Caps with an A1 or A2 Quality Score across all sectors and industry groups.
I’m also interested in companies for which there are analyst forecasts for at least one year ahead and whose current market price offers a safety margin of more than 10 per cent.
From over 2080 listed companies, 17 meet the criteria.
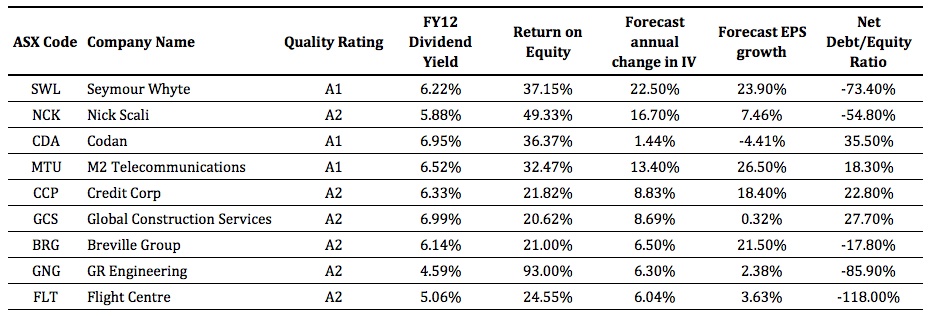
An attractive and sustainable Return on Equity is also important, so let’s seek out companies whose ROE is greater than 20 per cent in the most recent financial year, have a forecast dividend yield of more than four per cent and whose intrinsic value that is forecast to rise at least six per cent per annum.
The result?
Nine companies trading at a discount to intrinsic value that may be worthy of your attention.
Here they are: Seymour Whyte (ASX:SWL), Nick Scali (NCK), Codan (CDA), M2 Telecommunications (MTU), Credit Corp (CCP), Global Construction Services (GCS), Breville Group (BBG), GR Engineering (GNG) and Flight Centre (FLT).
If we were in a bull market, I suspect a stampede to get ‘set’ may ensue, without proper research. With the luxury of a market where the tide may still be going out, you may just have the indulgence of time to conduct plenty of research. Regardless, independent research is essential. As is seeking personal, professional financial advice.
So, what have you been researching? Go ahead and list your “Top 5”. We’ll put together a worthy riposte.
Alternatively, put forward your A1 suggestions and we’ll compile a list of intrinsic valuations and Skaffold® Quality Ratings for the next blog post.
Finally, keep in mind that I cannot predict where the share prices for these companies are headed. They could all halve, or worse. And remember, seek and take personal professional advice.
Posted by Roger Montgomery and his A1 team, fund managers and creators of the next-generation A1 stock market service, 8 September 2011.
by Roger Montgomery Posted in Companies, Market commentary.
- 317 Comments
- save this article
- POSTED IN Companies, Market commentary
-
Your next-generation A1 invitation
Roger Montgomery
September 6, 2011
My team and I are delighted to invite Value.able Graduates to pre-register for Skaffold®, our next-generation A1 service.
Skaffold is the stock market like you’ve never seen it before – the world’s best visuals combined with its most reputable information and ideas.
Amazing, incredible, simple. That’s Skaffold.
Those who have already seen Skaffold called it “the missing piece”.
Value.able Graduates will receive a personal invitation today. Keep an eye out for an email from me with the subject line “Your next-generation A1 invitation. Here it is”.
IMPORTANT: It has come to our attention that some @optusnet.com.au email addresses did not receive my invitation. Rest assured, if you have contacted us, posted a comment here at the blog or on my Facebook page, or simply not received your invitation, my team will be in touch.
Posted by Roger Montgomery, Skaffold® member #1.
Skaffold® is a registered trademark of Skaffold Pty Limited.
by Roger Montgomery Posted in Companies, Investing Education.
- 87 Comments
- save this article
- POSTED IN Companies, Investing Education
-
How much capital intensity does it take to sell seats?
Roger Montgomery
August 30, 2011
 Did you know some of Qantas’ planes are more than twenty years old? And our estimate is that they fly, on average, 14 hours per day. The rest of the time they mimic that expensive bit of fashion in your garage, earning no income. That garage/hangar time has expensive ramifications for the economics of airlines, just as your decision to buy an expensive but garaged ‘fashion’ item has expensive ramifications for you.
Capital-intensive businesses, such as airlines, erode shareholder wealth. Inflation ensures their maintenance and replacement is a significant proportion of cash flow, which could otherwise be paid out to shareholders. Parts plus labour, which protect the business assets from wear and tear, actually causes wear and tear on shareholders’ funds.
Raising capital and increasing debt, has hitherto been easy for Qantas, but the market is slowly coming to the realisation that it cannot continue. The market capitalisation of Qantas – the ‘value’ the market ascribes – is less than all the equity that the company has raised – much less.
As a result of the market’s slow migration to understanding the economics of airlines, fresh management have had to respond quickly.
The best measure of economic performance is Return on Equity (ROE). This year QAN achieved a ROE of just over four per cent. Meanwhile, Oroton shareholders have been enjoying eighty per cent returns. Did you know there are 267 companies that earn more than 15 per cent returns on equity?
The business of selling seats is an expensive one for Qantas, and while the business of selling the hope-of-getting-a-seat (the Frequent Flyer program) is extremely profitable, owning planes means the cash is always inhibited – it can’t be distributed to shareholder owners.
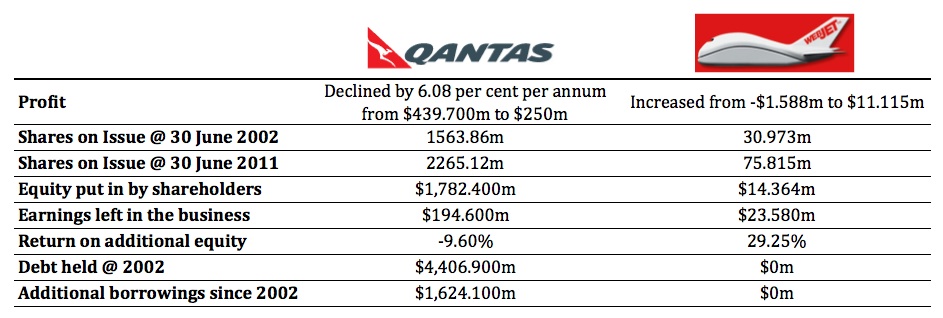
Qantas however isn’t the only seller of seats on planes. Indeed there are businesses that sell seats on planes and they don’t have any planes. Let’s compare two seat-sellers: Qantas and Webjet.
I believe the very best businesses online are lists – lists of jobs, lists of apps, lists of songs, lists of cars, lists of houses, list of flights and lists of seats. What is particularly attractive is that a business with a list of seats doesn’t have any planes. Sure its revenue is going to be lower, but what about its profit?
Let’s compare…
Now, lets take a look the economics of these businesses over the past ten years.
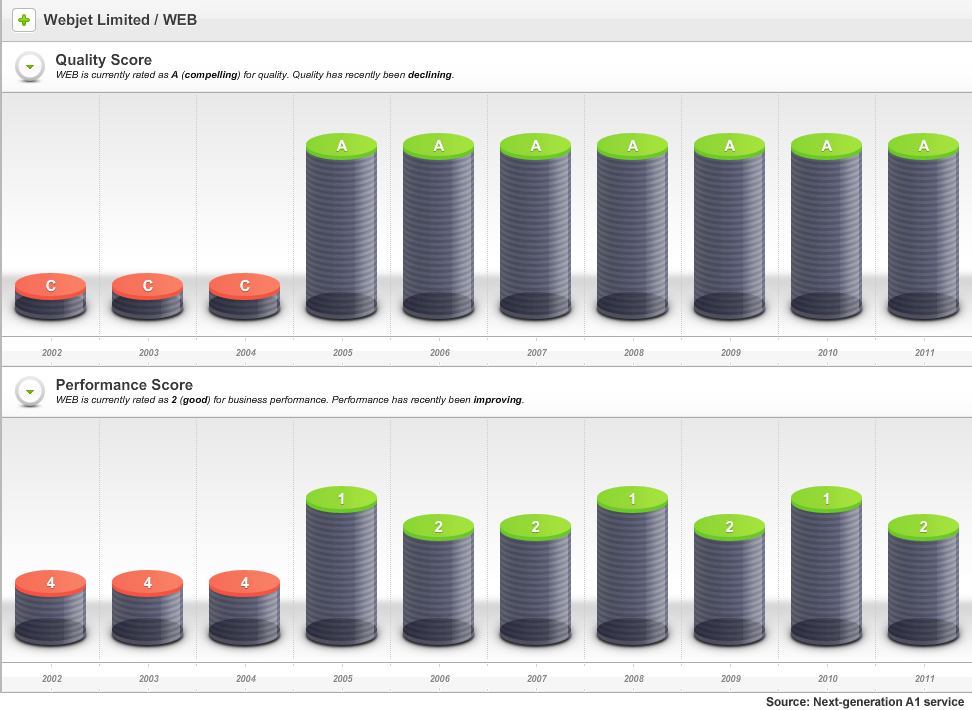
As the following sneek peek charts from our soon-to-be-released next-generation A1 stock market service display, Webjet has scored, on average, an A2 since 2005.
In this example, the Quality Score information tells us that something dramatic happened in the 2004/2005 financial year.
Webjet was once called Roper River Resources Company and in July 1999 the shares, under the ASX code; RRR, were trading at 25 cents. By March 2000 – near the peak of the internet bubble – RRR shares were trading at $1.38.
The reason is now obvious, although at the time it may have been a bit of a mystery.
In January 2000, Roper received a ‘speeding ticket’ from the ASX to which it responded on 14 January with the following statement:
“1. There are no, matters of importance, about to be released to the market.
“2. The Company is not aware of any information to explain the recent trading in the shares.
“3. The Company can offer no other explanation for the price change and increase in volume in the securities of the Company.”
“4. I confirm that the Company is in compliance with the listing rules, in particular, listing rule 3.1.”
On 27 January 2000 however – less than two weeks later – Roper River Resources (ASX:RRR) announced it was issuing 50 million shares to acquire Webjet Pty Ltd.
By June 2004 the shares were still trading at 15 cents, however the company announced the previous October that it was trading in the black for the first time. By November 2004, it was reporting 400 per cent monthly increases in sales. Almost every month to its full year results in June 2005, it continued to report 400 plus percentage increases in monthly sales.
And in that year Webjet’s Quality Score jumped from C4 to A1. As you can see, Webjet has maintained an A1 or A2 quality rating since.
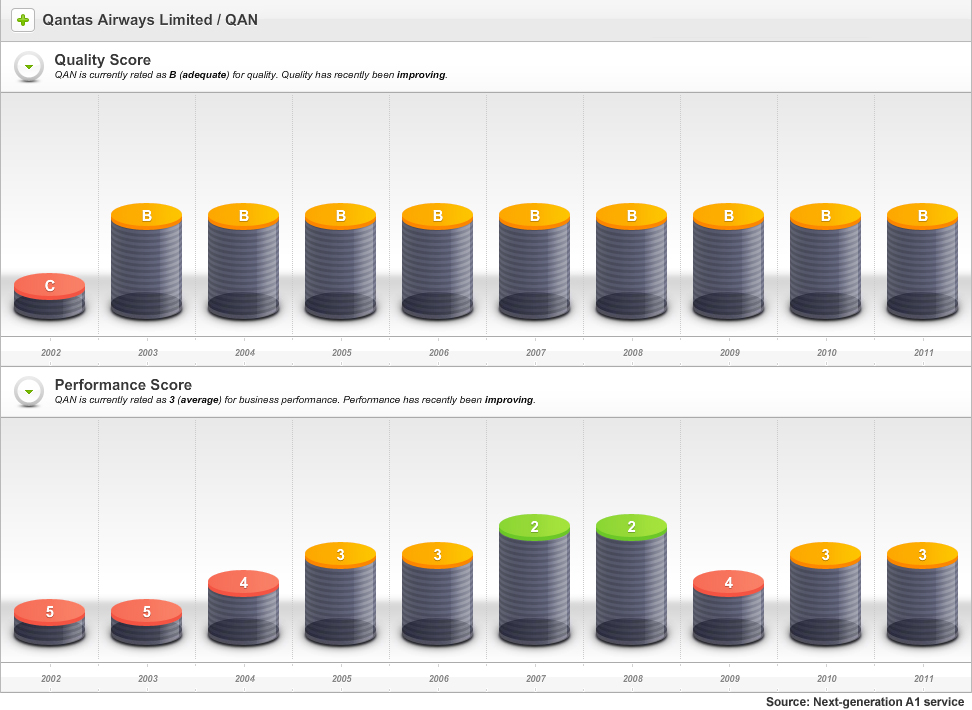
By comparison, Qantas’s Quality Score profile has been more marginal. This should be unsurprising to many, if not most Value.able Graduates, who understand the downside of capital intensity. Lots of property plant and equipment results in more equity for a given profit, and that means lower returns.
So, what do you think?
With reporting season about to end, your mission, if you choose to accept it, is:
Source the latest Annual Report for each business in your portfolio. Go to the Balance Sheet and under ‘Non-Current Assets’ find ‘Property, Plant and Equipment’.
If you have any, how many capital-intensive businesses are hiding in your portfolio?
Making this process simple and easy is something we have been working on for you. We created our next-generation A1 service because we wanted to make finding extraordinary companies offering large safety margins easy. And, of course we love investing. The above graphics are just one
It’s an A1 service that is like nothing you have ever seen before.value
Value.able Graduates – your invitation to pre-register is coming soon.
If you haven’t graduated to guarantee your invitation, click here to order your copy of Value.able immediately. Once you have 1. Read Value.able and 2. changed some part of the way you think about the stock market, my team and I will be delighted to officially welcome you as a Graduate of the Class of 2011 (and invite you to become a founding member of our soon-to-be-released next-generation A1 service).
Posted by Roger Montgomery and his A1 team, fund managers and creators of the ext-generation A1 stock market service, 30 August 2011.
by Roger Montgomery Posted in Airlines, Companies, Insightful Insights, Value.able.
-
What has probing the reporting season avalanche revealed?
Roger Montgomery
August 24, 2011
With reporting season in full swing, I would like to share my insights into whose Quality Score has improved, and whose has deteriorated. Remember, none of this represents recommendations. It is intended to be educational only. You must seek and take personal professional advice before acting or transacting in any security.
To date, 232 companies have reported their annual results. I am sure you can understand why we feel snowed under. With almost 2,000 companies listed on the ASX, the avalanche still has a way to roll.
We have updated all of our models for each of the 164 companies that we are interested in. As you know, we rank all listed companies from A1 down to C5. The inputs for those rankings always come from the company themselves. I would hate to think how bipolar they would be if we allowed our emotions and personal preferences to infect those ratings (or be swayed by analyst forecasts)!
Rather than arbitrary and subjective assessments, we download some 50-70 Profit and Loss, Balance Sheet and Cash Flow data fields from each annual report to populate five templates. All of these templates employ industry specific metrics to calculate the Quality Scores. This allows us to rank every ASX-listed business from A1 – C5. Its our objective way to sort the wheat from the chaff.
For Value.able Graduates not familiar with our scoring system, company’s that achieve an A1 Score are those we believe to be the best businesses, and the safest. C5s are the poorest performers and carry the highest risk of a possible catastrophic event.
A1 does not mean nothing bad will ever befall a company. A1 simply means to us that it has the lowest probability of something permanently catastrophic. Further, ‘lowest probability’ doesn’t mean ‘never’. A hundred-to-one horse can still win races, even though the probability is low. Similarly, an A1 business can experience a permanently fatal event. In aggregate however, we expect a portfolio of A1 businesses to outperform, over a long period of time, a portfolio of companies with lesser scores.
With that in mind, we are of course most interested in the A1s and – on a declining scale – A2, B1 and B2 businesses.
So, who has managed to retain their A1 status this reporting season? And which businesses have achieved the coveted A1 status? If you hold shares in any of the companies whose scores have declined (based of course on their reported results), please read on.
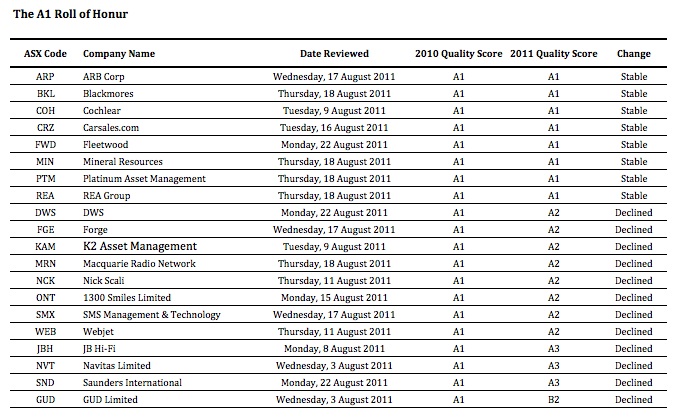
Of the companies that have reported so far, last year 20 of them were A1s, 28 were A2s, one was a B1 and 13 scored B2. That’s an encouraging proportion, although we tend to discover each reporting season that the better quality businesses and the better performing businesses are generally keen to get their results out into the public domain early.
Its towards the end of every reporting season where the quality of the businesses really drops off. This is always something to watch out for – companies trying to hide amongst the many hundreds reporting at the end of the season. It’s always a good idea to turn up to a big fancy dress party late, if you aren’t in fancy dress.
This year we have seen the number of existing A1s fall to nine from 20, A2s from 28 to 24, B1s rise from one to two and B2s fall from 13 to six.
The first table shows all twenty 2009/2010 A1 companies that have reported to date. You’ll see a number of very familiar names in here, including ARB Corp (ARP), Blackmores (BKL), Cochlear (COH), Carsales.com (CRZ), Fleetwood (FWD), Mineral Resources (MIN), Platinum Asset Management (PTM), REA Group (REA), DWS (DWS), Forge (FGE), K2 Asset Management (KAM), Macquarie Radio Network (MRN), Nick Scali (NCK), 1300 Smiles Limited (ONT), SMS Management & Technology (SMX), Webjet (WEB), JB Hi-Fi (JBH), Navitas Limited (NVT), Saunders International (SND) and GUD Limited (GUD). Nine have maintained their A1 rating this year.
Now, before you go jumping up and down, a drop from A1 to A2 is like downgrading from Rolls Royce to Bently. When we talk about A2s, its not a drop from RR Phantom to a Ford Cortina, not that there’s anything wrong with the old Cortina (if you are too young to know what I am talking about Google it!).
The only big rating decline is GUD Holdings, which made a large acquisition (Dexion) during the year. Indeed, a common theme amongst the higher quality and cashed up businesses this reporting season has been the deployment of that cash towards, for example, acquisition or buybacks (think JB Hi-Fi).
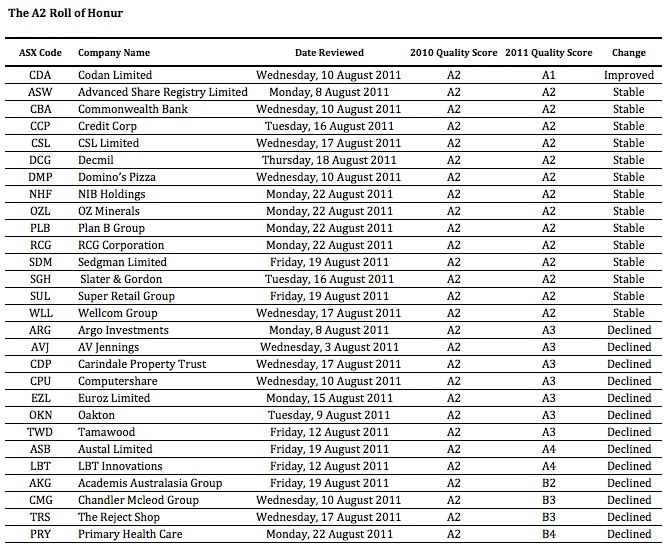
Moving onto the 2009/2010 A2 honour roll: Codan Limited (CDN), Advanced Share Registry Limited (ASW), Commonwealth Bank (CBA), Credit Corp (CCP), CSL Limited (CSL), Decmil (DCG), Domino’s Pizza (DMP), NIB Holdings (NHF), OZ Minerals (OZL), Plan B Group (PLB), RCG Corporation (RCG), Sedgman Limited (SDM), Slater & Gordon (SGH), Super Retail Group (SUL), Wellcom Group (WLL), Argo Investments (ARG), AV Jennings (AVJ), Carindale Property Trust (CDP), Computershare (CPU), Euroz Limited (EZL), Oakton (OKN), Tamawood (TWD), Austal Limited (ASB), LBT Innovations (LBT), Academis Australasia Group (AKG), Chandler Mcleod Group (CMG), The Reject Shop (TRS) and Primary Health Care (PRY).
The businesses that make up this list showed slightly more stability. The biggest fall in quality this year was Primary Healthcare (PRY),which is still struggling to digest the large purchases it made a few years ago. The Reject Shop (TRS) also declined, to B3. TRS is still investment grade and we would lean towards believing this is a short-term decline, given the floods in QLD that caused the complete shutdown of their new distribution center and the massive disruptions subsequently caused. As the company said, you can’t sell what you haven’t got!
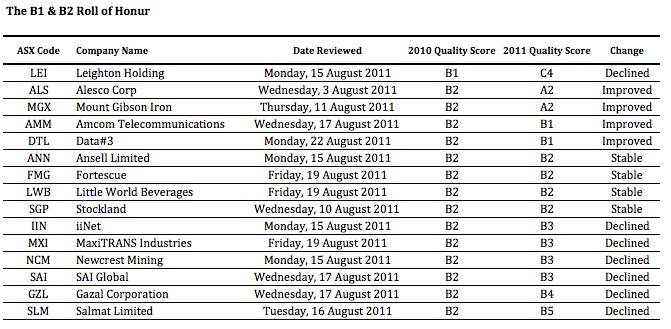
Finally, B1 and B2 companies: Leighton Holdings (LEI), Alesco Corp (ALS), Mount Gibson Iron (MGX), Amcom Telecommunications (AMM), Data#3 (DTL), Ansell Limited (ANN), Fortescue (FMG), Little World Beverages (LWB), Stockland (SGP), iiNet (IIN), MaxiTRANS Industries (MXI), Newcrest Mining (NCM), SAI Global (SAI), Gazal Corporation (GZL) and Salmat (SLM).
About half the companies in the B1/B2 list retained or improved their ratings from last year. Mind you, half also saw their rating decline!
The clear fall from grace is Leighton Holdings, whose problems have been well documented in the media and via company presentations.But once again, like The Reject Shop, this could be a temporary situation. If the forecast $650m profit comes through, I expect LEI’s quality score will improve. What the dip will do, however, is remain a permanent reminder that Leighton is a cyclical business. Getting the quote right on a job is important, even more a massive enterprise like Leightons.
Are you surprised by any of the changes? We certainly were!
Sticking to quality is vitally important. That’s what my team and I do here at Montgomery Inc, and its what our amazing next-generation A1 service is all about. Value.able Graduates – your invitation is pending.
If you are yet to join the Graduate Class, click here to order your copy of Value.able immediately. Once you have 1. read Value.able and 2. changed some part of the way you think about the stock market, my team and I will be delighted to officially welcome you as a Graduate of the Class of 2011 (and invite you to become a founding member of our soon-to-be-released next-generation A1 service).
Remember, you must do your own research and remember to seek and take personal professional advice.
We look forward to reading your insights and will provide another reporting season update soon.
Posted by Roger Montgomery and his A1 team, fund managers and creators of the next-generation A1 service for stock market investors, 24 August 2011.
by Roger Montgomery Posted in Companies, Insightful Insights, Investing Education, Value.able.
-
Is iiNet worth two Bob?
Roger Montgomery
August 15, 2011
 iiNet’s full-year results have been released. I have taken particular interest because communications and data is one sector of the marketplace I believe is relatively less affected, in terms of share-of-wallet, by the ructions in the US Europe.
The results released today (15 August 2011) were marginally below the expectations of several analysts we correspond daily with. Underlying EBITDA was up just shy of 30 per cent to $104.8 million (some analysts were expecting $106 million and a little more).
With DSL (Digital Subscriber Line) – the technology that significantly increases the digital capacity of ordinary telephone lines, and excluding HFC (Hybrid Fiber-Coax network – CABLE) – iiNet is now the number two competitor and the leading “challenger “in the Australian residential telecommunications market. As an investor, I am always interested in the number 1 or 2 player in town. However the gap between number 1 (Telstra) and iiNet (#2) is enormous. iiNet have 641,000 paid DSL subscribers (up 19 per cent). Telstra has 2.4 million.
The company reported its underlying Net Profit After Tax was $39.0m, up 12.4 per cent on FY10, while reported NAPT fell 3.7 per cent to $33.4m (FY10 $34.7m). On a quick glance, I reckon underlying profit was $37 million (you have to add back $3.9 million in deal costs, redundancy costs of $1.2 million and legal costs of $1.4 million but tax effect it). Stripping out the impact of the acquisition, I also estimate cash flow was close to $40 million.
The reason for the less than stellar growth in reported net profit was because iiNet’s tax bill was much higher than last year. The increase in tax wiped out all of the increase in the net profit before tax.
Whilst many analysts will look at the growth in operating profit (EBITDA), I’d look at the net profit before tax. If I add the legal costs in 2010 back to that year’s profit-before-tax and then add the one-offs for 2011, I get a jump in net profit before tax from $43.85 to $53.4 million and a reduction in margins from 9.25 per cent to 7.6 per cent. Hopefully the company’s expected ‘synergies’ (an extra $10 million from porting AAPT customers across to the iiNet billing system?) raise this to 8.5 per cent.
Net debt increased to $96.4m from $56.3m as a result of the AAPT Consumer division. This has had an impact on our Quality Score (the A1-C5 system), which was B2 previously. Gearing will be 40 per cent. And the the balance sheet? It now contains $302 million of goodwill compared to $242 million of equity.
Revenue and operating cash flow was up significantly with the full year’s benefit of the Netspace acquisition and a nine month benefit of the AAPT consumer division. What really would be interesting however is an estimate of what like-for-like revenue and operating cash flow is. Sure iiNet has no ‘stores’, but acquisitions and synergy extraction doesn’t have the same whiff of sustainability as a business that can grow organically. I would like to see how the old business (excluding the acquisitions) is travelling. Value.able Graduates – would you?
And when I hear company say that it is “Ideally positioned for the future“, I want answers as to whether they were previously ideally positioned for ‘now’.
The 19 per cent growth in DSL subscribers includes AAPT’s consumer division, so it doesn’t give us much insight into the organic growth of the company. With ARPU (Average Revenue Per User) largely unchanged, yet network and carrier costs up 56 per cent – above the 47 per cent increase in revenue – some insights into organic growth would be helpful. I suspect subscriber growth will reflect slow organic growth in FY12, and any margin/profit improvement will come from ‘synergies’. While these may be significant ($9 – $12 million from migrating AAPT customers onto iinet billing system), they are not a long-term delivery platform for profit growth.
It is clear that management’s confidence is high. They have significantly increased the dividend from $12.1 million last year to $16.7 million this year and have announced separately a share buy-back of up to 7.6 million shares, or about 5 per cent of the issued capital (about $17 million at current prices), despite the fact that debt has risen substantially by a net $52 million. Perhaps when you have $766 million coming through the door you can afford to be a bit fancy-free with your capital allocation? Thoughts anyone?
I hear whispers in the background… Roger, how do you know all this? Yes, I do listen to company presentations and we do read investor briefings. But nothing compares to the clarity that comes from using our A1 service. It is, quite literally, extaordinary. And we can’t wait to share it with you. Value.able Graduates – expect to receive your invitation very soon. Now, back to the program…
If organic growth is slow and acquisitions begin to thin out, one would expect debt repayment followed by an increase in the payout ratio. Or perhaps the other way around, if share price support is contemplated?
The prices paid for acquisitions does not immediately cause concern for me, because the returns on equity being reported aren’t poor. But they aren’t A1 either.
Investors have tipped in $223 million and left in $15 million. On those amounts, iiNet’s Return on Equity is about 16 per cent.That’s not bad, but are there better opportunities out there. Before you suggest Telstra, keep in mind it is 140 per cent geared and profits are boosted by the failure of the company to recognise software development expenses in the year they are incurred.
The old fashioned Value.able investor in me doesn’t like looking at a balance sheet that reveals the debt-funded acquisition of goodwill. I have witnessed far too many examples of this turning out poorly. Sure, some of you may say that MMS did the same thing? But while debt rose significantly there, the corresponding asset was PP&E, not goodwill. You may instead point out that interest cover is still high at 9 times (20 times last year). That, I accept.
Finally, the NBN. What does it mean for iiNet?
First, some background. An ‘Off-net’ customer is provided a DSL service through another network – usually Telstra wholesale. An ‘On-net’ customer is one that is provided a DSL service through the iiNetwork (iiNet’s own broadband network). The NBN is expected to reduce the average monthly cost of broadband + Voice bundling to $33, which compares favourably to the current off-net cost of $57. This is a potentially major saving, but the reason I am not as excited about this as the company is because as the transition is made, there will be some leakage. It will occur over an unexciting period of time and any number of offsetting factors could adversely impact revenues, costs and profits during that time.
I am more excited about other companies at the moment. A growth by acquisition strategy may offer wonderful potential in the short-term, but it can also be used to mask slow organic growth. The buy-back can be a sign that cashflow will be strong, but it can also be used to merely ‘display’ confidence and support the share price. At Montgomery HQ, we reckon the shares are very close to their Value.able intrinsic value, but iiNet’s fall in quality, from A3 to B2, suggests shifting your attention to other opportunities.
You should be practising your own Value.able valuations. So what do you get for iiNet for 2011, 2012 and 2013?
Posted by Roger Montgomery and his A1 team, fund managers and creators of the next-generation A1 service for stock market investors, 15 August 2011.
by Roger Montgomery Posted in Companies, Insightful Insights, Investing Education, Technology & Telecommunications, Value.able.


