Companies
-

MEDIA
It’s a Tasty,Tempting Mix
Roger Montgomery
November 1, 2012

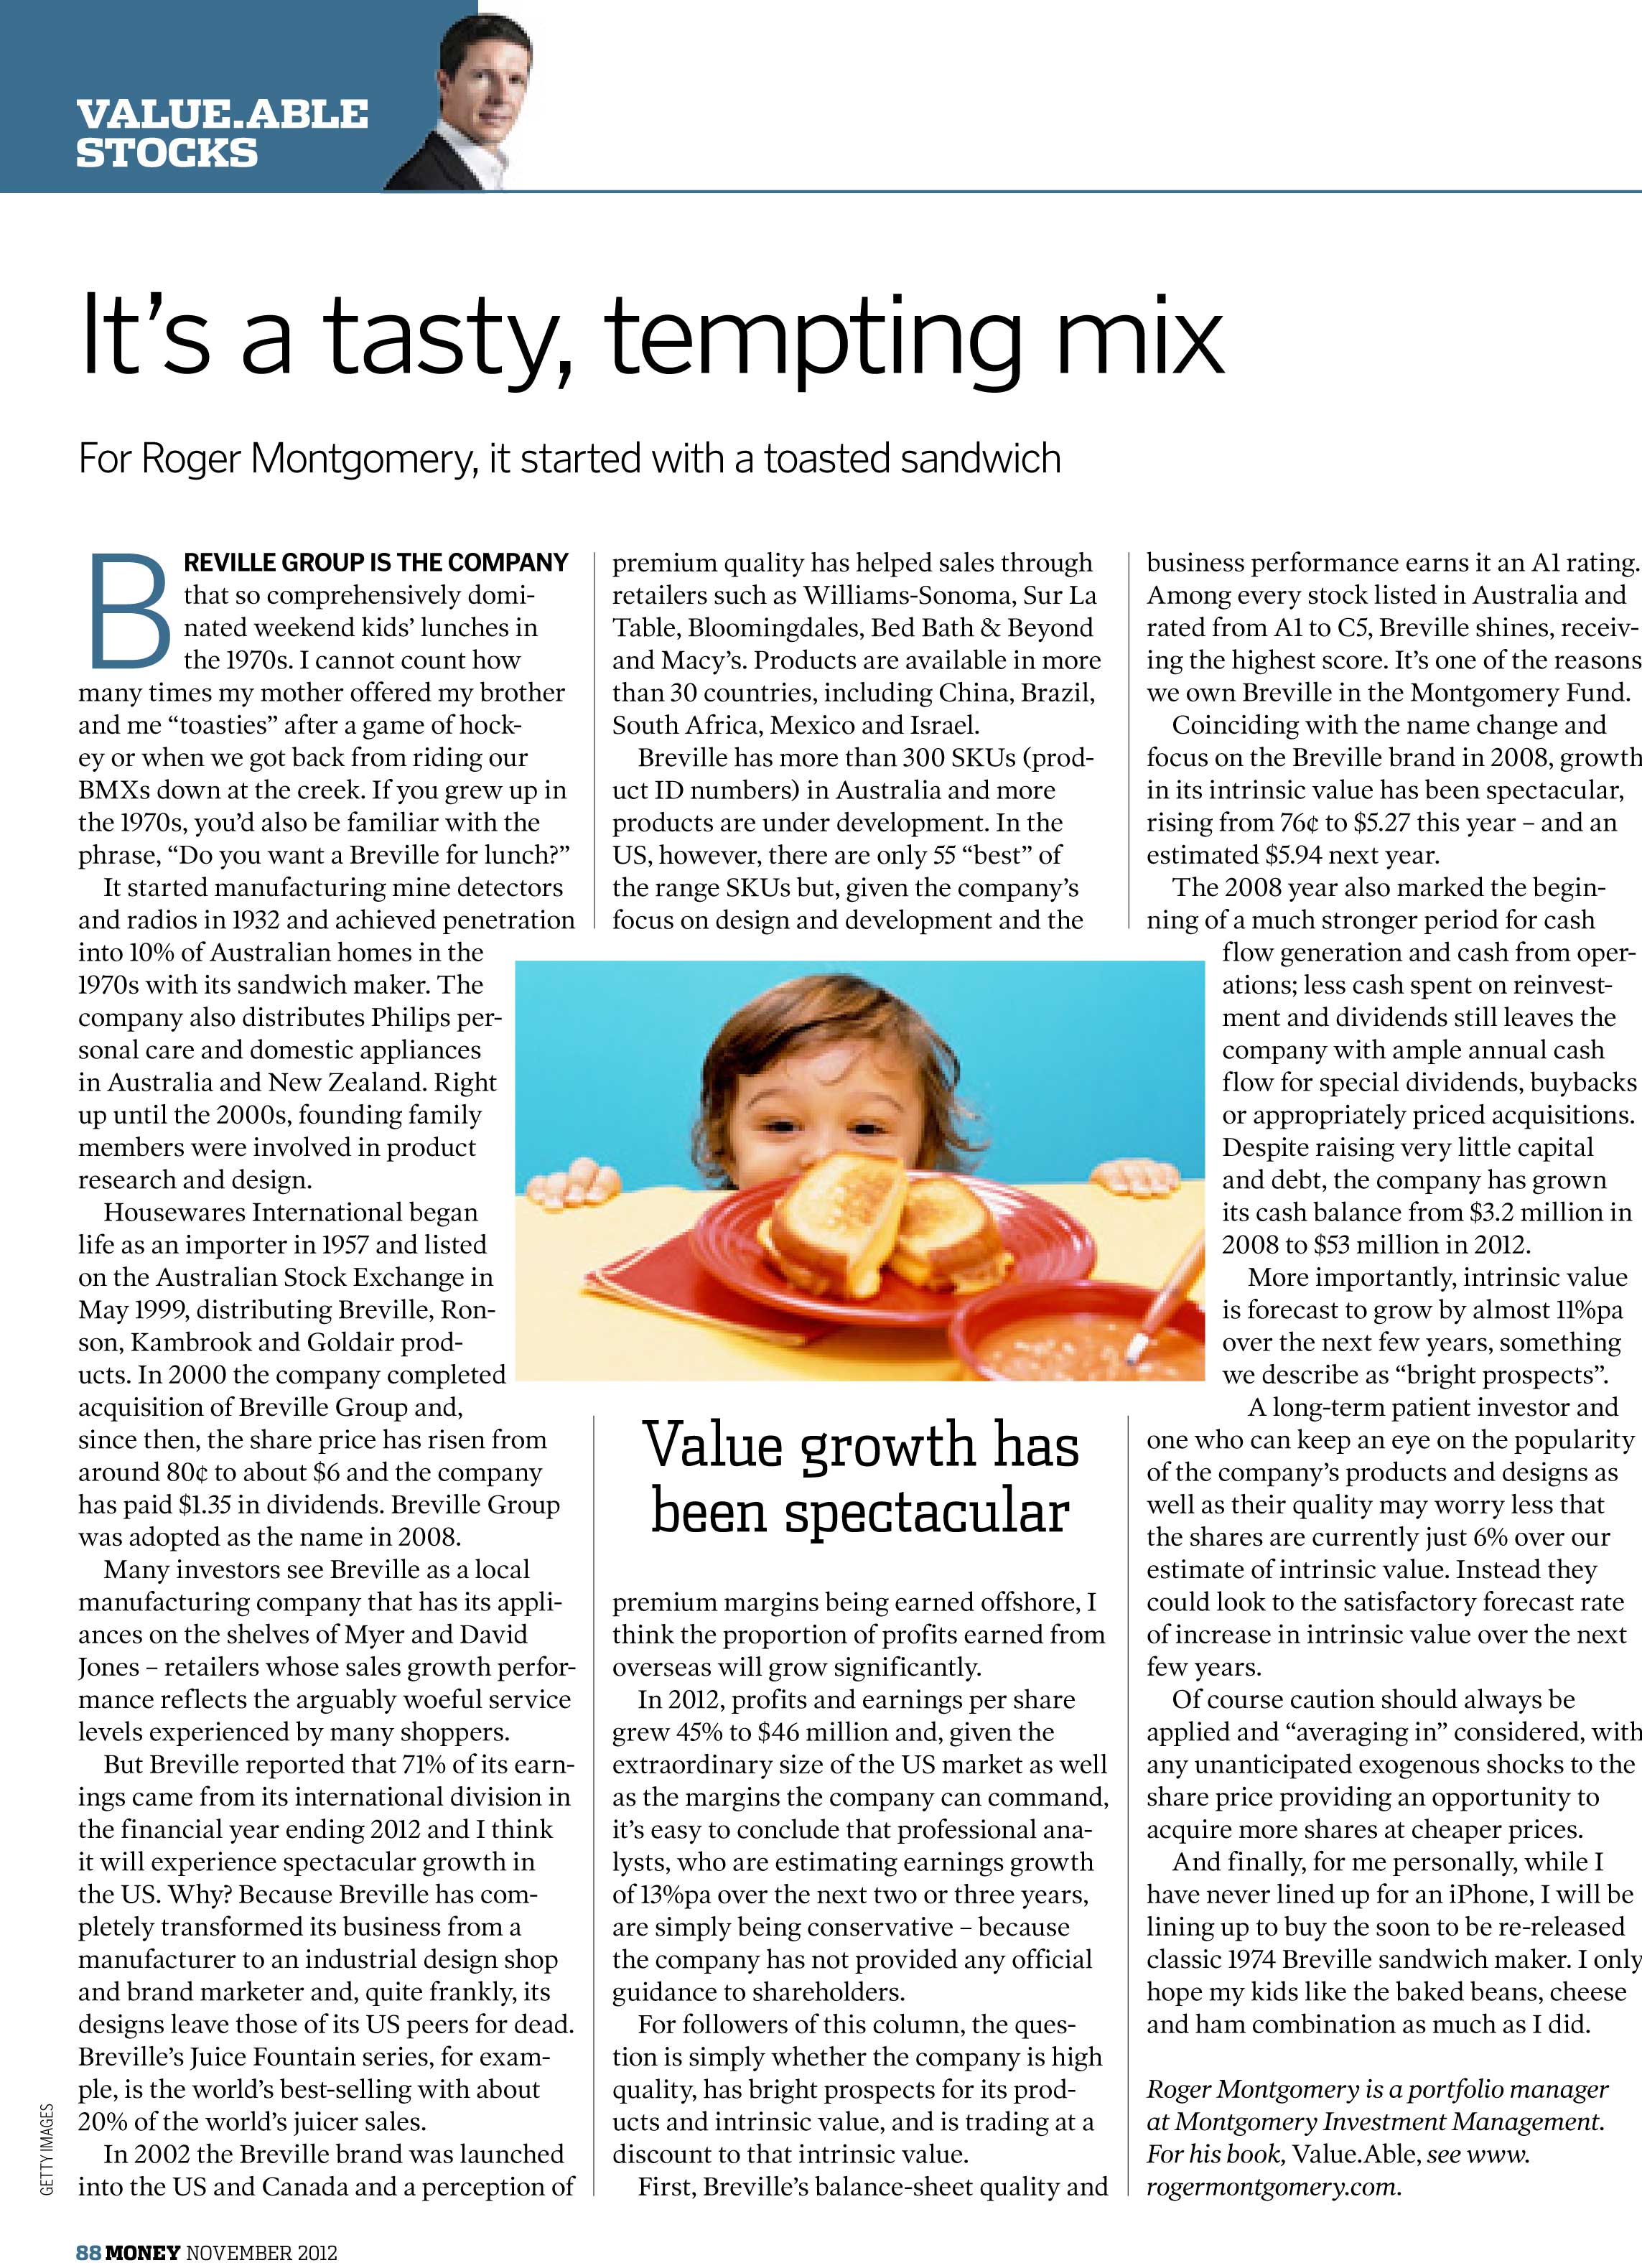
In his Money Magazine November 2012 article, Roger highlights the ongoing competitive advantage of Breville Group (BRG). Read here.
by Roger Montgomery Posted in Companies, Market Valuation, On the Internet.
- save this article
- POSTED IN Companies, Market Valuation, On the Internet
-
Where is the value? Let Skaffold keep you posted!
Roger Montgomery
October 22, 2012
Last week on 2GB I didn’t speak to Ross Greenwood as I normally do. He was off in New York for Channel Nine. Instead I had a terrific chat with my friend and former fund manager Matthew Kidman.
As usual we didn’t have a great deal of time but I asked Matthew whether he was seeing much value and his reply was telling. Like me, it seems to Matthew that value was getting thin on the ground, particularly among the higher quality companies.
There is still a few pockets of value and we named a few stocks. Matthew mentioned that he also predicted that the market would now strengthen and stocks that are fairly valued may continue to rally well beyond fair value.
I am less able to predict stocks and their short term price direction. To reduce risk what we do is simply analyse those companies that come into value as their prices, values and quality scores change.
by Roger Montgomery Posted in Companies, Insightful Insights, Intrinsic Value, Skaffold.
-
MEDIA
What is Russell Muldoon’s outlook on Commodities?
Roger Montgomery
October 17, 2012
Do CSL (CSL, Silverlake (SLR), FKP (FKPDA), Breville Group (BRG), Codan (CDA), QBE Insurance (QBE), NAB (NAB), Wesptac (WBC), AMP (AMP), ALS (ALQ), Prima (PRR), Rio Tinto (RIO), Lynas (LYC), or Mesoblast (MSB) achieve the coveted A1 grade? Watch this edition of Sky Business’ Your Money Your Call 17 October 2012 program now to find out, and also learn Russell’s insights into the commodities sector. Watch here.
by Roger Montgomery Posted in Companies, Financial Services, Insightful Insights, Intrinsic Value, TV Appearances.
-

Back to the Future
Roger Montgomery
October 17, 2012
By Russell Muldoon and Roger Montgomery
Growing up in inner Melbourne in the 1970’s I cannot tell you how many post hockey-game lunches my mother trotted out on the ‘Breville’. The original scissor action Breville Sandwich Toaster was released in 1974. It sold 400,000 in its first year and reached 10% of Australian households. It was quickly improved in 1976 with the release of the Breville Snack’n’Sandwich Toaster (pictured) which was the first sandwich toaster to cut and seal sandwiches in half. It was a revelation and became an icon of the appliance world – we could eat a sandwich while riding our BMX’s without the contents of the sandwich spilling everywhere. And Mum was happy because a healthy and warm lunch was done in a few minutes and while it was being made, she could get the carpet sweeper out and do a quick run up and down the hallway or throw a slipper at any kid that was mucking up because they were hungry!
by Roger Montgomery Posted in Companies, Manufacturing.
- 6 Comments
- save this article
- POSTED IN Companies, Manufacturing
-

Iluka confirms all our fears…
Roger Montgomery
October 16, 2012
Didn’t think a free blog could be a valuable use of your time?
Back on 13 July 2012 (read here), we warned that Iluka Resources announced their 2012-2014 Key Physical and Financial Guidance previously released in February 2012 was “now redundant and as such no longer applicable”. Management had said volumes for the December 2012 half-year were indicating “lower ordering patterns or an unwillingness to commit to volumes except on an “as needed” basis”.
As with other miners described here at the blog over the last year, the boom appeared to be over and reports were confirming our earlier appraisal of the likely impact from a China – led slowdown. Iluka’s exposure is both direct and indirect and the grim conditions were confirmed yesterday with the release of the Iuka Resources September Quarterly report. Combined sales volumes of zircon, rutile, synthetic rutile and ilmenite at 306,300 tonnes, were down 29% on the September Quarter 2011. Revenue at $225m was down an extraordinary 58% from $533m recorded in the September Quarter 2011. This means the average selling price for Iluka’s mineral sands declined by 41% year on year. In response, the Iluka share price fell 6.6% to $9.00 and is back to trading where it was in February 2011. Essential reading indeed.
by Roger Montgomery Posted in Companies, Insightful Insights.
- 3 Comments
- save this article
- POSTED IN Companies, Insightful Insights
-

WHITEPAPER
THE PROPERTY RUG PULL
Discover how proposed changes to negative gearing, Capital Gains Tax and holiday home tax rules could reshape property investing, and why investors may consider private credit as property returns become less certain and tax advantages diminish.
READ HERE -
When genius fails?
Roger Montgomery
October 15, 2012
CVC has wrestled with its ownership of Nine ever since it bought the network from James Packer’s PBL Media for $5.3 billion in 2007. And now CVC’s man Adrian McKenzie has quit the nine board and Goldman Sachs as swapped debt for equity.
Equity owners are last in line and its a salient lesson for investors who must always remember that there is a very high risk owning businesses. In this environment of low interest rates its easy to value companies on equally low discount rates to try and produce a valuation close to the current price to justify a purchase. This is the basic lesson for CVC.
Even in an environment such as this we’d be using 10%, 11% even 13% required returns and walking away from anything that is not cheap enough.
With money burning holes in pockets and fees based on the employment of capital the temptation to bit off more than one can chew is ever present.
The late Kerry Packer taught the world a valuable lesson when he said ‘You only get one Alan Bond’. And James was obviously paying attention.
by Roger Montgomery Posted in Companies, Media Companies.
- 4 Comments
- save this article
- POSTED IN Companies, Media Companies
-
MEDIA
What are Tim Kelley’s insights into the Australian Banks?
Tim Kelley
October 10, 2012

Do Ten Network (TEN), Seven West Media (SWM), Aurora Oil (AUT), Origin Energy (ORG), Santos (STO), Cedar Woods (CWP), Slater and Gordon (SGH), IMF (IMF), Roce Oil (ROC), The Reject Shop (TRS), Challenger (CGF), Bluescope (BSL) or Adelaide Brighton (ABC) achieve the coveted A1 grade? Watch this edition of Sky Business’ Your Money Your Call 10 October 2012 program now to find out, and also hear Tim’s thoughts on the big Aussie banks. Watch here.
by Tim Kelley Posted in Companies, Financial Services, Insightful Insights, TV Appearances.
-
What is your best performing stock pick for the next 9 months?
Roger Montgomery
October 5, 2012
September was a challenging month for investors but Montgomery chalked up another outperformance in both The Montgomery [Private] Fund and The Montgomery Fund (see figure 1).
Of course in the short term the performance of share prices can be attributed to noise and randomness and so the bigger question is always; which businesses will be worth substantially more in the future?
What is your suggestion for the best performing stock for the next nine months to June 30, 2012?
Pick the best performing stock in the next nine months and gain fame and notoriety, kudos and credit.
Each month we’ll track the list and present the table until June 30, 2012.
All the best and stay tuned.

by Roger Montgomery Posted in Companies, Intrinsic Value, Investing Education.
-
Gunns collapse. If only they’d been Skaffold members!
Roger Montgomery
September 29, 2012
Chalk up another win for Skaffold members.
Substantial capital losses are difficult to make back and irrespective of whether you are still in accumulation mode, retiring or retired it is essential to avoid major losses. One way to do this of course is to diversify and ensure that losses are mitigated through position sizing. Another technique and the one we will discuss here, is to simply avoid the companies most likely to collapse.
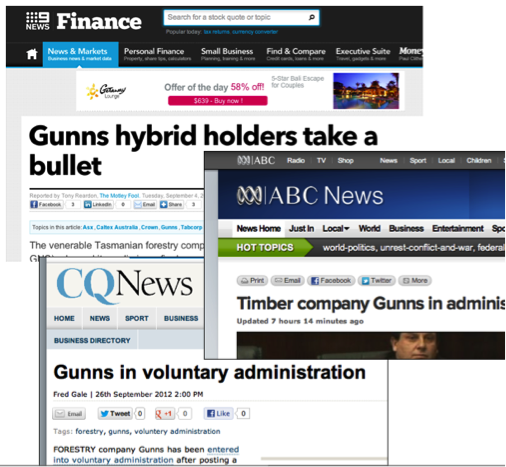
This week Gunns (ASX:GNS), was placed into voluntary administration and happily for Skaffold members it is unlikely that anyone owned shares.
Gunn’s was never investment grade. Anyone who purchased the stock from 2003 onwards were taking a massive risk and Skaffold can explain why.
Skaffold’s Verdict (Figure. 1) is a picture of danger.
by Roger Montgomery Posted in Companies, Insightful Insights, Market Valuation, Skaffold, Value.able.
-
MEDIA
What are Tim Kelley’s insights into Cabcharge’s prospects?
Roger Montgomery
September 25, 2012
Do Sedgman (SMD), Decmil Group (DCG), cochlear (COH), Seek (SEK), IAG (IAG), Resolute Mining (RSG), Magellan Financial Group (MFG), Syrah Resources (SYR), ASG (ASZ), Goodman Group (GMG), Silex Systems (SLX), AMP (AMP) or Service Stream (SSM) achieve Roger’s and Tim’s coveted A1 grade? Watch this edition of Sky Business’ Your Money Your Call broadcast 25 September 2012 program now to find out, and also learn Tim’s insights to the outlook for Cabcharge (CAB). Watch here.
by Roger Montgomery Posted in Companies, TV Appearances.
- save this article
- POSTED IN Companies, TV Appearances