Companies
-
Are the pizzas better at Dominos?
Roger Montgomery
March 27, 2012
 PORTFOLIO POINT: Despite the headwinds facing retailers in Australia, Domino’s Pizza is growing and expanding its margins. But is that growth already be priced in?
Retailers in Australia are facing a perfect storm of weak consumer spending, online competition and a rising Australian dollar. But despite these headwinds, there’s one company that is not only expanding its physical footprint, but is becoming a serious force online. It’s also notching up double-digit growth in Europe, in spite of the economic climate, and breaking records to boot. You may be surprised to learn that this success story is in fact Domino’s Pizza Enterprises (ASX: DMP).
Domino’s Pizza listed on the Australian stock exchange in May 2005, and opened its 400th store in the same year. The company is the largest pizza chain in Australia and enjoys a growing presence in France – a country that, with the exception of the United States, consumes more pizza per head than anywhere else in the world – Belgium and the Netherlands, having bought existing operations in those countries in 2006 and becoming the largest Domino’s franchisee in the world. Domino’s Pizza now operates more than 889 stores, employs more than 16,500 people and, according to one report, makes more than 60 million pizzas per year. And all of this is run by a Lamborghini-driving CEO, who is as obsessed about Domino’s today as he was when he merged his 17-store franchise company into what is now Domino’s Pizza Enterprises.
The company’s online strategy has been a raging success, not only for pizza ordering but also for recruitment. When the company launched its iPhone App in 2009, it became the number one free app on the iTunes site within five days. Today, 40% of orders are made online and the company expects this to be 50% in the next six months, with a third of these orders to come from mobile devices.
Domino’s recently reported its half-year results and saw an improvement on almost every KPI. Same-store sales growth was strong, exceeding expectations in both Australia and Europe; margins improved and stall rollouts continued; the balance sheet strengthened, as did free cash flow; and, despite even lower debt, returns on equity increased. Domino’s concluded by upgrading its full-year 2012 guidance.
My friends at American Express should be able to confirm that while fashion retailing is one of the hardest gigs to be in, restaurants and cafes are one of the best. This is something Domino’s Pizza CEO Don Meij would know only too well. Despite challenging economic conditions, particularly in Victoria and New South Wales, same-store sales grew by almost 9% and total sales were up 11.2%. In Europe, where conditions are arguably much worse and youth unemployment is in the high double-digits, Domino’s recorded 12.6% total sales growth and 7.5% same-store sales growth. By the end of financial year 2012, another 60 to 70 stores will have been opened, net profit is expected to grow by 20% (despite adverse currency movements), and same-store sales growth is expected to be in the order of 5 to 7%.
In the last three years, earnings per share have doubled (no doubt the company has also taken market share from its peers, such as KFC) and despite a substantial decline in borrowings, return on equity has increased from 17% to 23% (see Skaffold.com screenshot below)Rising returns on equity, with little or no debt, is an indication of powerful business economics. Generally, as a company gets larger, its returns on equity stabilise or decline. Domino’s, however, enjoys an ability to raise prices and, some say, reduce pizza sizes without a detrimental impact on volume sales. This is, in my estimation, the most valuable competitive advantage it has. Granted, it’s a surprising conclusion to put forward for a franchisee (for a look at how things can go wrong for a franchisee company, look no further than Collins Foods).
Dominos displays declining debt (red columns), rising equity (grey columns), rising return on equity (blue line) and rising profits (green line). Source: Skaffold.com
Since 2004, Domino’s profits have increased 40.11% p.a. from $1.954 million to $20.7 million. To generate this $18.759m increase in profit, shareholders have tipped in an additional $64.37 million of equity and left in earnings of $34.82 million. In other words every additional dollar contributed and retained has returned around 19%. During the period under review the company has also reduced its borrowings by $9.11 million from $24.65 million it held in 2004 to $15.54 million at the end of FY2011.
Analysts worry about the risks associated with growing a business in Europe in the present climate. Rising commodity input prices, including oil for delivery vehicles and wheat for flour, and the stronger Australian dollar are also points of concern. In the face of these perceived challenges, the company continues to grow and expand its margins. It also expects greater than 25% profit growth from Australia within three years. Clearly, Domino’s competitive advantages are proving those analysts who said Australia was ‘ex-growth’ wrong. And the company is also moving to electric delivery scooters to hedge against higher fuel prices.
Domino is a high quality business – Source: Skaffold.com
I have not been able to buy Domino’s shares – as much as I would like to – because they have not been cheap enough for me. My valuation is based on the idea that I want to reduce my risks as much as possible by ensuring I obtain a bargain. DMP has simply never traded at a bargain price. But with a price close to $9.00 today, you could (admittedly with the benefit of hindsight) put forward the argument that the $2.65 the shares traded at in 2009 was every bit a bargain. The issue is simply the discount rate that I am willing to use to arrive at my valuation. If I use 8% to 9%, my valuation approximates the lower historical prices. But is 8-9% enough? I think not.
What would you pay for a business earning $25 million this year and $29 million next year, perhaps $35 million the year after that? If you said $300 million or $350 million, I’d label you a value investor, but today the market capitalisation is more than half a billion dollars. At that kind of multiple, I would guess the growth has been ‘priced in’. I would rather be certain of a modest return than hopeful of a great one, and at current prices – despite the obvious track record of the company and the very great skill of its management – I think buyers are being hopeful. Unless, of course, they know a takeover is imminent.
Posted by Roger Montgomery, Value.able author, Skaffold Chairman and Fund Manager, 27 March 2012.
by Roger Montgomery Posted in Companies, Consumer discretionary, Investing Education, Value.able.
-
Guest Post: Forcing Bright Prospects
Roger Montgomery
March 23, 2012
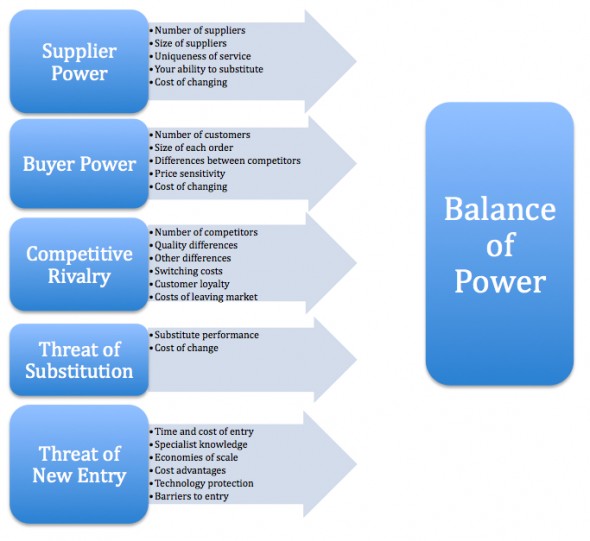 Created by Harvard Business School professor Michael Porter to analyze the attractiveness and likelihood of profitability of an industry, Porter’s Five Forces are a simple but powerful tool for understanding where power lies in any business situation. Using this tool, you can gain insight into the competitive strength of an investee candidate.
While these Five Forces are typically used by companies to determine whether new products, services or businesses may be profitable, investor’s can use them to analyze the competitive position of any industry member.
The importance of ROE and buying companies with bright prospects is sacrosanct here at the Insights Blog but why? Return on equity is an important explanatory variable for superior share price performance and so we want businesses that can sustain high rates of return. When I talk about bright prospects it is the sustainability of these high rates of return that I am referring to. Whether the bright prospects relate to a rising tide of customers, the ability to pass on rising costs, the ability to be the low cost provider or the changing competitive landscape, how these factors serve to produce a high rate of return on equity is what we care about.
Numerous economic studies have shown that different industries can sustain different levels of profitability. This can be attributed to differences in industry structures. Within those industries however there is a pecking order of companies and Kathy’s column on Porter’s five forces reinforces the need to understand where your investee candidate sits and whether that high ROE being produced today can be sustained.
Porter’s Five Forces model is made up by identification of 5 fundamental competitive forces:
Barriers to entry
Barriers to entry measure how easy or difficult it is for new entrants to enter into the industry.Threat of substitutes
Every top decision makes has to ask: How easy can our product or service be substituted?Bargaining power of buyers
the question is how strong the position of buyers is. For example, can your customers work together to order large volumes to squeeze your profit margins?Bargaining power of suppliers
This relates to what your suppliers can do in relationship with you.Rivalry among the existing players
Finally, we analyze the level of competition between existing players in the industry.Kathy writes…
Calculating the ROE or debt levels of a company is the easy part. But how does one determine if a company has bright prospects? The Porter’s Five Forces model is a tool that I have found to be helpful when picking companies in which to invest. I came across this model while I was studying an Information Systems subject at University.
The Porter’s Five Forces model was developed by Michael Porter to help understand a company’s competitive advantage. The five “forces” that are identified by Porter are:
1) Threat of new entrants
New entrants can increase market competition between companies. In the absence of a dominant player, this can lead to erosion of profit margins.
The threat of new entrants is highly dependent on the barriers to entry. For example, it is relatively easy to start a small pizza business, but it would be difficult to compete with or replicate Cochlear’s business due to the massive R&D costs and intellectual property that is hard to obtain.
2) Power of suppliers
Suppliers can place pressure on margins if they are dominant players in the market. This can be observed in the computer chip manufacturing space where Intel and AMD are the dominant manufacturers. These two companies arguably control the technology that is available to consumers because the manufacturers of computers must build them to accommodate AMD and Intel’s CPUs.
The power of suppliers can also be witnessed in the building industry where suppliers increase their prices as a result of rising commodity costs. These price increases are difficult for builders to pass on in the current subdued climate as consumers are already stretched with high housing costs.
3) Power of customers
A profitable company depends on attracting and retaining customers. However, customers hold the power when they can easily switch to a competitor’s product or service.
In a competitive market where there is little product differentiation, particularly in industries where products have become commoditised, customers have the power to force businesses to compete on price. This is evident with online book stores, where consumers have the ability to search for and compare the cheapest prices across online retailers such as Amazon, eBay, Book Depository and Booktopia, forcing traditional bricks and mortar book stores to compete.
4) Availability of substitutes
In the majority of industries there are substitutes that a customer might use if prices become prohibitively high. Substitutes can be seen in the energy sectors, for example, petrol is increasingly being substituted with ethanol in cars.
New technologies also create substitutes. The introduction of electronic downloadable music has been very popular with consumers who wish to purchase and download music at their convenience. CD sales have dwindled much to the dismay of record labels. Companies need to be agile and adapt to new trends. Kodak is a classic example of a company that did not move with the times.
5) Existing competitors
Competitors all fight for market share by developing their brands and by attempting to attract customers. Increased competition can lead to the erosion of profit margins. Innovation can help, however this is difficult for businesses that operate in a commodity-type business. Retailers (e.g. Coles, Woolworths, Myer) typically sell the same products as their competitors, and perhaps their private label products are a means for them to differentiate themselves from their competitors.
I hope this has given everyone some food for thought. These are the things
I try to think about before I invest my hard earned money.Thanks Kathy for your post. If you would like to list a couple of companies that you believe dominate their industry and will sustain high rates of return on equity, simply click on the Leave A Comment link below.
by Roger Montgomery Posted in Companies, Insightful Insights, Value.able.
-
Are recurring profits worth chasing?
Roger Montgomery
March 15, 2012
 Week after week our email inbox is filled with investor’s questions: A reasonably frequent one is about the performance of a portfolio of stocks that I wrote about last year filled with companies whose revenues had a large recurring component to them. If you know anything about the recurring patterns in fractal geometry, you know how beautiful the recurring theme can be.
The lift in the market over recent months has heightened anticipation. Today I will outline the performance of the six stocks I chose at the start of October last year.
But first: do you remember what we wrote about back then? The market was down 20% and radio news programs led with stories of large losses overnight in foreign markets. Shortly afterwards the market officially entered a “bear” market.
And then it promptly bounced. I remember this period because it was when we started a new Sub-Portfolio with six stocks that had one thing in common: a high percentage of recurring revenue. We called it the Recurring Value.able Portfolio.
As I wrote back then: “All the companies selected enjoy high rates of return on equity; they all have manageable, little or no debt; and they all enjoy the benefits of low levels of capital intensity, helping to generate copious cash.
“But what really marks these companies: Hansen, Iress, REA, Reckon and M2 Communications as a little special is the significant levels of recurring revenue. Iress (ASX: IRE, MQR: A1), enjoys close to 80% recurring revenue through the supply of its information and trading platforms; Hansen (HSN, A1) close to 70% through the supply of billing platforms and software; Reckon (RKN, A1) close to 60% through its provision of online accounting, personal finance and practice management software; and M2 Telecommunications (MTU, A1) close to 67% through telecommunications and internet access plans.
“Think of the advantages of running a business that begins each year with a material amount of its revenue locked in for the next 12 months. It is these recurring revenue streams that help derisk a company through strengthening balance sheets. The solid financial position then enables a business to comfortably expand current operations and take maximum advantage of other opportunities as they arise.”
A year ago I wrote that a portfolio constructed from high recurring revenue businesses and purchased at prices representing a margin of safety, should outperform the index. It was on that basis that I created a second Value.able portfolio called the Recurring Value.able Portfolio. Sitting within the Value.able portfolio its purpose is simply to demonstrate to you the relative performance of these holdings compared to the market.
You may recall I also overweighted the stocks that were trading at the largest discounts to my then estimate of intrinsic value and said: “I don’t believe the level of recurring revenue will change materially if Greece defaults and even if equity risk premiums increase because of more frequent recessions in the US” …adding “these holdings should perform as true defensives”.
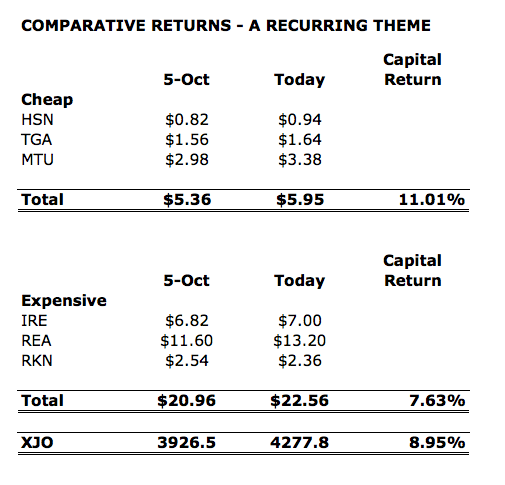
Since I penned those thoughts, what has been the performance of each of the six companies’ shares? Hansen, Thorn Group and M2 were all trading at discounts to our then estimate of intrinsic value and M2 at the largest, while Iress, Reckon, and REA Group, were all at premiums to intrinsic value. The following table shows the share price increases and decreases for each of the six.
What I have done, is grouped those same companies by premium or discount to intrinsic value.
Those that were cheap are in the top half of the table, and produced a simple average return of 11.01%. Those that were expensive produced an average simple return of 7.63%. In other words, those with a high level of recurring income that were also cheap outperformed the All Ordinaries index; while those with a high level of recurring income but were expensive, on average, underperformed the All Ords.
Now, if you’ve been reading my column here long enough, you’ll know that a short period is not long enough to measure relative or absolute performance and neither is a small sample, but nevertheless, we have to start somewhere and the reality is we have plenty of experience to support the notion that quality and value combined leads to outperformance over the long run.
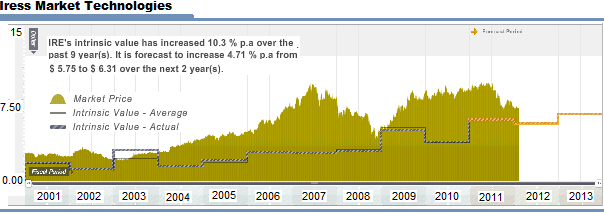
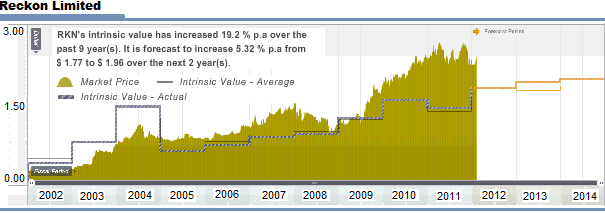
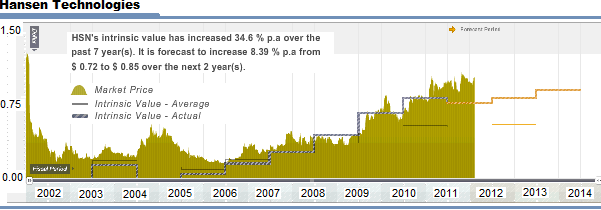
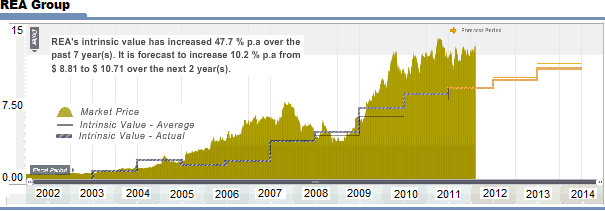
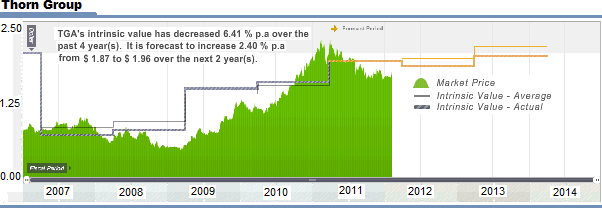
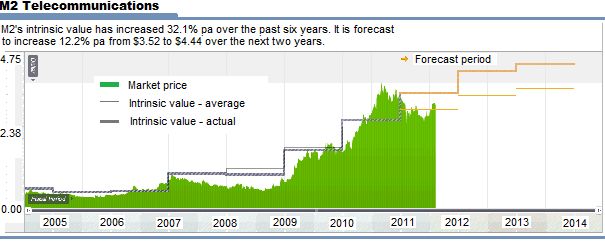
As an update to our October piece on this subject, find following the Skaffold intrinsic value line charts for each of the six companies. They describe where the current price is compared to Skaffold’s estimate of intrinsic value and whether, based on current forecast earnings, intrinsic value is expected to rise materially in coming years.
What are your favourite recurring revenue companies? By thinking laterally you may discover a couple of companies that wouldn’t normally be thought of as enjoying recurring revenues. To leave a comment click on the link below and enjoy reading the two further new posts below.
Posted by Roger Montgomery, Value.able author, Skaffold Chairman and Fund Manager, 15 March 2012.
by Roger Montgomery Posted in Companies, Investing Education.
- 47 Comments
- save this article
- POSTED IN Companies, Investing Education
-
Is there beauty in boring?
Roger Montgomery
March 15, 2012
 Making winches and bullbars for four-wheel drives sounds boring, but the latest figures from ARB offer exciting reading.
I am most excited about companies that are in boring industries. You might recall my column (here) enthusiastically discussing Embelton, a manufacturer and distributor of … wait for it … hardwood flooring. Since that article the stock has surged to new all-time highs. Great companies that are run by reliable and trustworthy managers can produce returns that are anything but boring.Right now, retail and other sectors such as property have declined in prominence in the various indices. As a result, fund managers worried about their “tracking error” don’t need to own as much of these companies’ shares, which in turn means brokers don’t receive sufficient brokerage fees to warrant an analyst covering them. The net result is that analysts are made redundant, and coverage of the stocks declines along with the price multiples being asked for the shares. For a long-term value investor, this is bliss.
And with that we turn to the results of another of my candidates for most boring industry award: ARB Corporation. ARB manufactures and distributes 4WD aftermarket accessories. Think bull bars, snorkels, fridge-freezers and winches (among other items) manufactured in Thailand and Kilsyth and distributed around the world, now through 43 stores (16 company owned – think of the long-term store rollout potential!) from Africa and the Emirates to Mongolia.
Strong local demand has protected ARB from the impact of Thai floods on vehicle supply and a very strong previous corresponding period (thanks to a large order). And just as local demand in January (holidays) and February (job losses) will trim sales, a restoration of car manufacturing supply chains offshore will offset it.
In the most recent half, ARB increased sales 2.3% to $132.1 million, maintained its EBIT of $24.9 million, increased its net profit by 1.6% to $18.3 million and its earnings per share by 1.6% to 25.2¢. The interim dividend also rose by one cent to 11¢ a share.
Many investors might be concerned about the flat EBIT. Don’t be. This reflects increased staffing and in particular staff in the research & development department. It’s this department that is responsible for the company’s innovative product lineup that included the release of the Sahara bull bar range (2000), the Emu Dakar leaf springs (2005), the recovery strap range (2007) and the fridge freezer (2008). While the cost is expensed, investors should think of it as an investment in the future. EBIT was also flat thanks to store expansion and the NPAT increase merely reflected an increased interest income item. Like I said, don’t get too excited!
Some of our “informers” have, however, explained that price rises have been possible and if you have read my book Value.able (click here), you will discover just why I think this is the most valuable competitive advantage.
The resource boom in Queensland and WA is having a positive impact on smoothing the company’s revenues and earnings in addition to the obvious direct impact on aftermarket product sales. The company’s production facilities have been running full-tilt and this appears to have resulted in some buildup of inventory, which in turn has had an impact (not material) on cash flows and the value of materials and consumables used compared to sales.
Full capacity production facilities add to inventory that has become backlogged as a result of slow vehicle throughput, due to the Thai floods and Japanese earthquake. I expect the inventory will run down again as deliveries of post-flood vehicles overseas ramps up.
I am encouraged by the Thai facility being at full production so soon after commissioning, because it suggests that management were unduly conservative in their estimation of their global reputation. I expected more cash to be needed for an upgrade or expansion and that has been announced. With returns on equity the envy of their listed peers, I am delighted to see the company invest more.
At an ASX seminar I presented yesterday, one attendee asked about the impact of currency on the company. This was a very good question: It’s important to note that for ARB there are two impacts. The first is a strong Australian dollar is great for margins when inputs are purchased from overseas. The flipside is that marked-up revenues earned offshore are impacted negatively as the dollar strengthens and those revenues are repatriated.
Historically, the company has a record of paying special dividends and, with $32 million in the bank, it is understandable that many analysts would use this line to woo investors into the stock (as an owner of the stock; “go for it” I say!). But the large cash balance is partly the result of $7 million raised in 2010 (through an underwritten DRP if I recall correctly) and special dividends will also be dependent on the level of investment the company makes in plant:
Such an outcome is not beyond the realms of possibility but neither is a permanently higher dividend payout ratio. The latter of course reduces the intrinsic value of the company – better that MD Roger Brown keeps the money in ARB and reinvests it at near 30% returns on equity.
At the current price of about $8.63, ARB is trading just above its 2012 intrinsic value estimate (see above Skaffold chart). With only 43 stores globally and only 16 company owned, fully utilised production facilities however suggest the company has plenty of scope to grow while sustaining high rates of return on incremental capital for decades – notwithstanding management’s energy to do so. It seems boring but slow and steady seems to be winning the 4WD race.
Posted by Roger Montgomery, Value.able author, Skaffold Chairman and Fund Manager, 15 March 2012.
by Roger Montgomery Posted in Companies, Insightful Insights.
- 13 Comments
- save this article
- POSTED IN Companies, Insightful Insights
-
Is it time to buy QBE?
Roger Montgomery
March 15, 2012
 QBE shares are trading at their lowest price since 2007, and they’re trading at Skaffold’s estimate of Intrinsic Value. They could be a compelling investment if premiums rise, US bonds collapse (interest rates therefore rise) and return on equity improves.
The release yesterday of QBE’s 2011 financial results, along with news of its planned $500 million capital raising ($450 million of which has now been raised from institutional investors), reminded me that there are many investors who may not understand the machinations of an insurance company. With that in mind, I thought some practical help in this regard would benefit those investors trying to make a decision about whether the lowest prices in QBE shares since 2007 represent good value.
Insurance companies can generally be divided up into two main businesses: underwriting, which is the practice of writing and collecting premiums on insurance policies, and paying claims on some of them; and the investment of those premiums – also known as ‘float’ or reserves – for the benefit of the companies’ owners.
It may surprise you to know the insurance business is relatively easy to understand, if you think about it from your own perspective. You pay an insurance company money to cover you for the risk of something undesirable befalling you. The amount of money you pay to the insurance company is the premium. Thousands of customers do exactly the same thing but not all of them will make a claim on their insurance policy. So the company attempts to make a profit from collecting and aggregating the premiums, paying commissions and expenses to the staff and resellers who market the insurance policies and then paying some portion of those premiums back out in claims.
At any period in time, there are insurance policies just written, insurance policies about to mature and insurance policies anywhere in between – and some of them will receive claims against them. At any point in time there is a pool of money that can be invested. These represent the unclaimed premiums on policies that are yet to mature. The income or profits earned from investing this, as well as claimed and immature premium revenue, is the second source of an insurer’s profit.
Many investors find analysing a balance sheet and profit and loss statement challenging. Analysing the reports of an insurance company is made doubly difficult by the fact that insurance companies use unique language to report their results.
Typically, insurance company results are displayed in two ways: there is the underwriting result, which is the result that excludes investment returns, and the insurance result, which includes investment returns.
The first line of an insurer’s profit and loss statement is the gross written premium. This is the total amount of money the company received in the form of payment for insurance policies for that year.
Now you may recall I mentioned earlier that at any period in time there are insurance policies just written, insurance policies about to mature and insurance policies anywhere in between. There are different contingent liabilities associated with the time remaining to maturity of a policy and maturity of a policy does not always occur at the end of the company’s financial year. For that reason, when premiums are adjusted for the period to which remaining possible (contingent) liability exists, the adjusted revenue is referred to as the gross earned premium. Some insurance companies also report this number.
From your perspective, the total amount of premium you pay represents the gross written premium, but if you paid for your insurance policy two months before the end of the company’s financial year, then the gross earned premium would be the amount you paid adjusted for two months.
By subtracting reinsurance costs from gross written premium, the net written premium is produced. If timing adjustments or accrued adjustments for contingent liabilities are made at this point, the result is net earned premium.
To recap, net earned premium is simply the revenue from writing all policies, less reinsurance costs and adjusted for timing.
Subtracting claims and expenses from the net earned premium produces the underwriting result which, you may recall, excludes investment returns. Adding investment income on the float or reserves to the underwriting result produces the insurance result.
Without trying to confuse you, the insurance result does not include investment returns on the shareholder capital part of the business. The shareholder capital part of the business raises equity capital from the owners to meet capital adequacy or prudential regulation requirements and these funds may also be invested.
With a typical industrial business, we might assess its performance using the profit and loss statement and a variety of ratios, such as gross profit margin, net profit margin or EBIT margin. We can do the same thing with insurance companies, but the ratios are given different names.
If we divide the insurance result (think of the insurance result as the EBIT of the whole company) by the net earned premium (which you should think of as the net revenue), we produce the insurance trading result (ITR). The insurance trading result is like the EBIT margin in that it is a pre-tax number – it also excludes interest on any debt.
There are rough rules of thumb about what numbers like the ITR should be. One dollar of premiums can be supported by about $0.50 of equity. If the insurance trading result is 10%, then the result is equivalent to a 20% return on equity. And if an investor is seeking a 10% required return, the right price to pay for an insurer might be double their equity.
The loss ratio is the ratio of paid claims to the net earned premium during the year. By comparing the amount paid out to the amount received, it measures the insurance companies’ effectiveness in pricing and predicting insurance policies and claims.
The expense ratio measures the proportion of sales the company expended on overheads. It measures operating expenses by comparing them to premium income. It is an efficiency measure, much like the cost to income ratio used by banks.
Finally, the combined ratio: this is a measure of profitability of daily operations. A ratio below 100% indicates that the company is making underwriting profit, while a ratio above 100% means that it is paying out more money in claims that it is receiving from premiums.
The combined ratio is reported in the context of the underwriting and insurance profit. It combines the claims ratio and the expense ratio. Remember, the claims ratio is claims owed as a percentage of revenue earned from premiums. And the expense ratio is operating costs as a percentage of revenue earned from premiums. The combined ratio is calculated by taking the sum of both types of incurred losses and expenses (underwriting expenses, including commissions, as well as claims) and then dividing them by earned premium. In short, combined ratio is the amount that revenue was eroded by to leave the profit margin, and doesn’t include investment income.
QBE reported its combined ratio had risen from 89.7% in 2010 to 96.8% and attributed the increase to higher costs (reinsurance and claims) associated with more frequent catastrophes and a higher net present value of claims due to a lowered discount rate (thanks to historically low interest rates overseas).
Even if the combined ratio is above 100%, a company can potentially still make a profit, because the ratio does not include income received from investments.
At the risk of completely losing you, the profit reported by the insurance company is in many ways like the profit reported by an airline – it is an accounting construct. You see, the item labelled ‘claims’ doesn’t correspond to actual cash claims made. Instead, it is invented by the accountants and actuaries and infected by an adjustment to the reserves. If you think of the reserves or float – the aggregated premiums received – as a liability or an amount set aside to cover future claims, then the claims item is an estimate based on current rates and the costs of those claims. As reported by QBE in its 2011 results this week, it is also impacted by changes to discount rates.
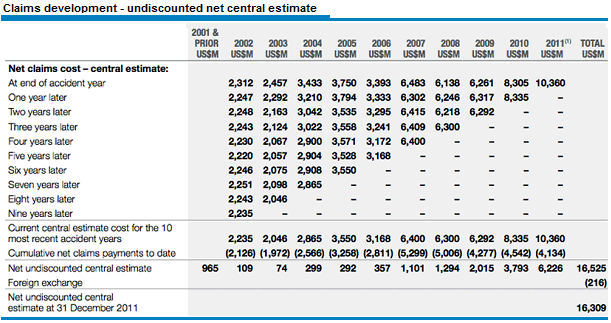
Table (E) on page 129 of QBE’s just-released annual report displays the adjustments made to the company’s flood or reserves as a result of a change in these estimates. The change to the reserve (you can see this by running your eye down a column) has an impact on the reported profit through the claims item in the profit and loss statement. For example, in 2004 the reserve changed from $3.4 billion at the end of the year of accident to $2.8 billion seven years later. This is a net benefit of $600 million to profits over that period. In the 2011 QBE result, an amount of $US64 million has been reported as “saving on prior year central estimate”.
Armed with this information, you are now a few steps closer to appreciating QBE’s results.
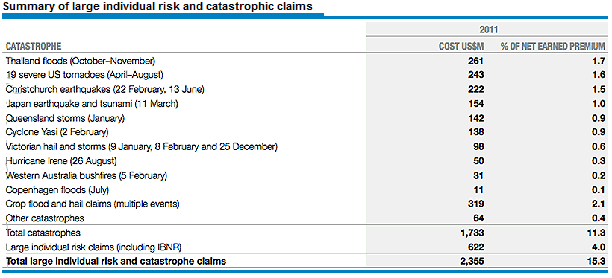
In 2011, QBE produced an underwriting profit of $US494 million compared to $US1.2 billion in 2010. QBE’s gross written premium (the total amount of money the company received in the form of payment for insurance policies for that year) rose 34% to $US18.3 billion, thanks in no small part to acquisitions. Net earned premium income (the gross profit after reinsurance and adjusted for timing) rose 35% to $US15.4 billion. Large individual risk and catastrophe claims amounted to 15.3% of net earned premium versus 9.5% in 2010 (see table).
The large number of painful hits to the company from these events have made it somewhat gun shy and it has pulled back some of its business lines in regions where reinsurance is too expensive. This may or may not be the right move. Only time will tell.
The insurance profit margin (contribution to profit from underwriting and investment income as a percentage of net earned premium) fell to 7.1%, compared with 15% in 2010.
The inefficiency of the stockmarket, however, was revealed when the company said its results were in line with the guidance it gave in January. In that trading update, the company gave guidance for all the above ratios, but analysts were left to translate the ratios into a net profit after tax figure. As at Monday this week, that translated consensus profit figure was $A936 million and 84 cents per share.
Yesterday, with its shares in a trading halt, QBE’s net profit came in at $US704 million ($A657 million) and EPS of $US0.61 cents per share ($A0.57 cps). The company also announced a capital raising through a bookbuild with a $10.50 floor, to raise $500 million, replacing Tier 2 convertible debt that under new APRA guidelines cannot be regarded as regulatory capital. This will dilute next year’s earnings.
You can see from the graph below that the reason for QBE’s terrible share price performance since 2007 is the fact that returns (the blue line) on ever increasing equity (the growing grey columns) have fallen from 26% in 2007 to less than 8% in 2011.
If, with your newfound understanding of the insurance business, you are interested in buying QBE at the lowest prices since 2007, then you need to be confident that the return on equity will begin to rise to levels that are materially above those available in a relatively risk-free bank account. And for this to happen, premiums will need to seriously pick up while claims remain low and nature stays quiet for a while.
Posted by Roger Montgomery, Value.able author, Skaffold Chairman and Fund Manager, 15 March 2012.
by Roger Montgomery Posted in Companies, Financial Services, Insurance.
- 19 Comments
- save this article
- POSTED IN Companies, Financial Services, Insurance
-
Is the rally over?
Roger Montgomery
March 8, 2012
 At the outset, let me say I am not going forecast anything. I don’t know whether the market will rise or fall next. Andy Xie however, in his column entitled; A world flying blind wrote: “Playing with expectations works temporarily. The risk-on trade is in a mini bubble, as today’s, buyers want to be ahead of the slower ones. The buying trend is sustainable only if the global economy strengthens, which is unlikely. The stocks aren’t cheap. Desirable consumer stocks are selling for 20 times earnings. Banks are cheap for a reason. Internet stocks suggest another bubble in the making. The Fed is trying to inflate an expensive asset. The rally, hence, is quite fragile. As soon as a shock like Greece defaulting or bad economic news unfolds, the market will quickly head south.”
In the great de-leveraging we are witnessing, cutting interest rates (monetary policy) doesn’t spur economic activity because businesses and individuals are simply trying to get out from under a mountain of debt first. The next option is to simply hand over money (quantitative easing) and then if that doesn’t work expand budget deficits through government spending (fiscal policy). A positive by-product of the money printing is that lower long-term bond rates guarantee a negative real yield – How can bonds be seen as ‘safe’ if they are 100% guaranteed to result in less purchasing power? – and investors are forced to buy other assets like stocks and pile into the “risk on” trade referred to above. Sadly, just as the money being printed isn’t finding its way into the economy – its being hoarded by the zombie banks who should have been allowed to collapse and/or write off their bad loans – the rally in the stock market isn’t helping the masses and indeed may itself be fading.
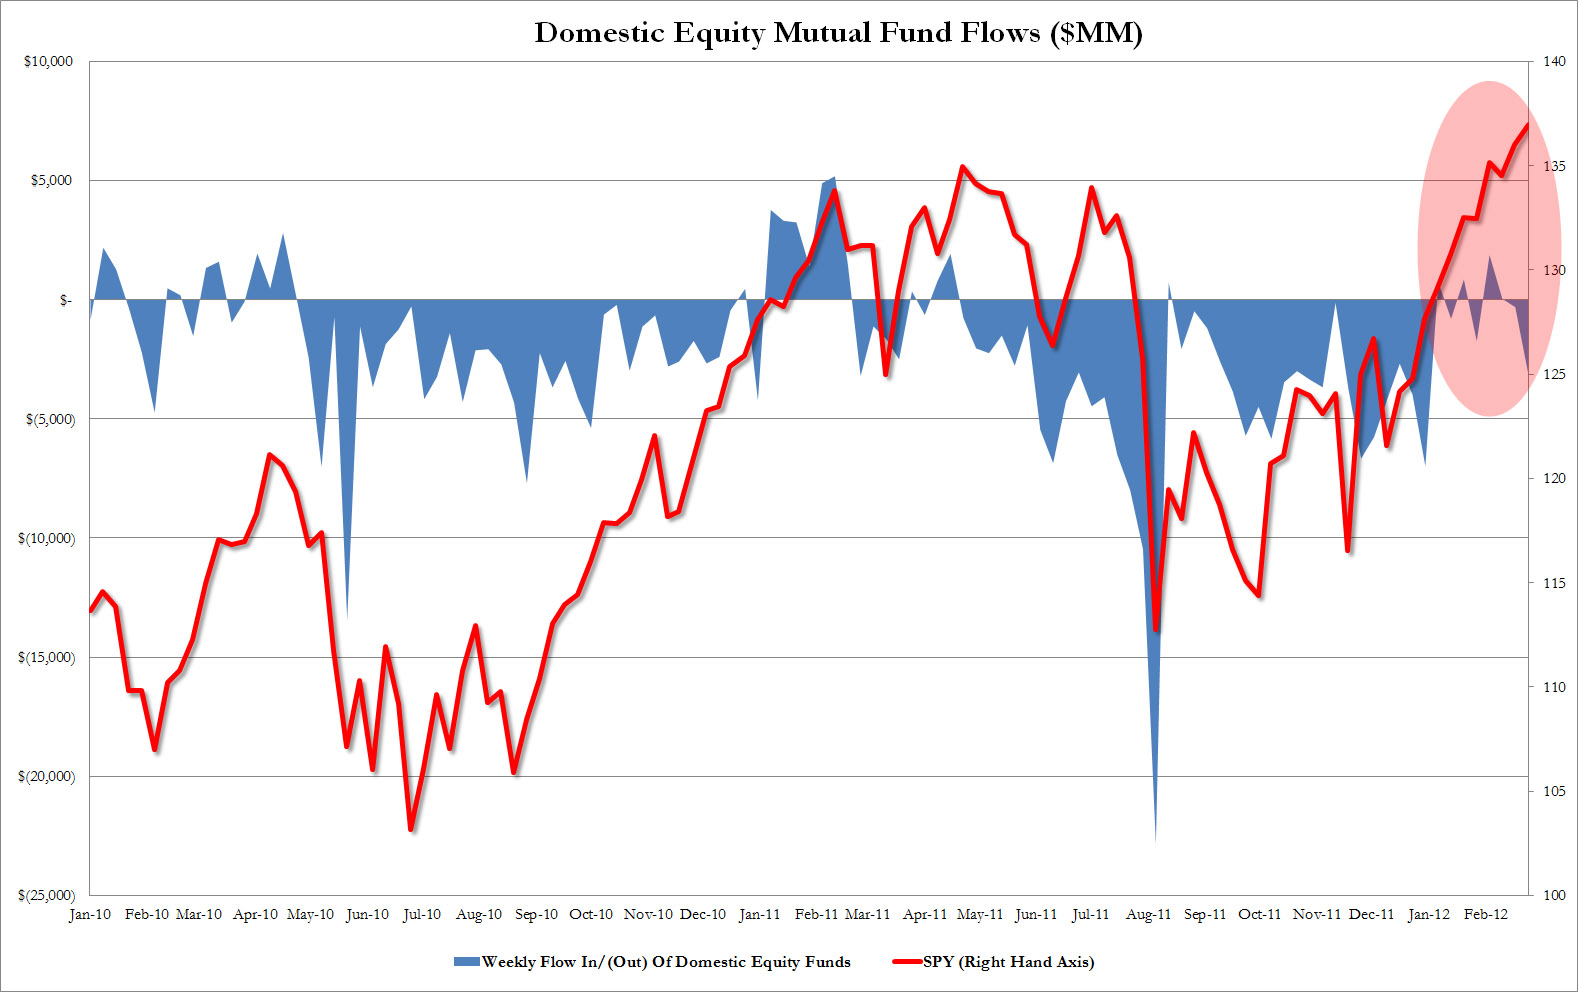
Chart 1 suggests to some investors that the latest attempt to encourage participation in the stock market hasn’t worked.
Chart 1 reveals that not only have retail investors continued to pull out cash from US equity mutual funds (about $66 billion since October), but the market peak of the week of February 29 coincided with the biggest weekly outflow for 2012 – $3 billion.
The Globe&Mail reported: “Retail investors, after gutting it out through years of awful returns, have finally fled. In a normal market, retail participation – Mr. and Mrs. Public trading their personal accounts – should be about 20 per cent. That plunged in November and December, traders say…
Traders Magazine noted: “On Wall Street, risk is suddenly a four-letter word. Retail investors can’t stomach it. Pension plan sponsors are allocating away from it.
“That’s bad news for stocks. Volume has been dropping almost nonstop for three years and shows no signs of improvement. The situation is worse than it was following the crash of 2000. It’s worse than it was after the crash of 1987. Fearful of the future and still wincing from 2008, investors are moving funds into bonds, commodities, cash, private equity, hedge funds and even foreign securities-anything but U.S. stocks.
“Our bread and butter is the retail investor,” Scott Wren, a senior equity strategist at Wells Fargo Advisors, one of the country’s four largest retail brokerages, told Bloomberg Radio recently. “They’re not jumping into the market. They’re not chasing it. Those who have been around for a little bit have been probably burned twice here in the last 10 years or so. They’re definitely gun-shy. They’re not believers. I’m not sure what it’s going to take to get them back in the market.”
As an aside, the reference to declining volumes over the last three years reminds me to republish the chart that I first published here: http://rogermontgomery.com/perhaps-one-of-the-most-important-charts/
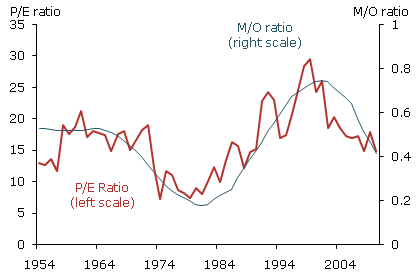
We wrote back in February; “A key demographic trend is the aging of the baby boom generation. As they reach retirement age, they are likely to shift from buying stocks to selling their equity holdings to finance retirement. Statistical models suggest that this shift could be a factor holding down equity valuations over the next two decades.
“The baby boom generation born between 1946 and 1964 has had a large impact on the U.S. economy and will continue to do so as baby boomers gradually phase from work into retirement over the next two decades. To finance retirement, they are likely to sell off acquired assets, especially risky equities. A looming concern is that this massive sell-off might depress equity values.”Chart 2. Ratio of accumulators to dissavers plotted against P/E ratios
Back to more recent observations and the 20% stock market rally over the last four months has been described as a completely artificial “ramp” by some and has been driven entirely by the global liquidity injections of the US, UK, European and Japanese central banks. The conclusions for some investors is that the smart money – those that have bought in anticipation of retail ‘follow-through’ will soon scramble for the exits. What do you think?
Skaffold’s ASX200 Value Indicator is a live and automatically-updated valuation estimate of the ASX200. It updates and changes every day. The future valuation estimates are based on the the constantly updated forecasts for earnings and dividends of the biggest 200 companies. You can’t beat it as a guide to the overall market level and whether you should be enthusiastic or not about looking more deeply for value.
Chart 3. ASX200 Value Indicator
Source: Skaffold.com
Based on current forecasts for 2012 you can see that the market looks about fair value. It isn’t overly expensive but neither is it, in aggregate, cheap. Based on 2013 forecasts however the market appears to be reasonable value. So the question is whether those 2013 forecasts are reasonable. Typically, forecasts are optimistic. We have previously written here of the persistence of optimism in forecasts by analysts. If that is again the case for 2013, then you wouldn’t be getting overly enthusaistic about our market unless there was a pull back. And according to those referenced above, a pull back is on the cards. What do you think?
I believe there are individual companies that have produced amazing results this reporting season and in an upcoming post we will list the very best. I also think that there is still some value among these companies. The challenge for those new to long term value investing is to be able to stick to your guns, accumulate positions in extraordinary companies at deep discounts to rational estimates of intrinsic value and stand apart from the daily gyrations of fear and rumour about default, money printing and recession.
Looking forward to your comments.
Posted by Roger Montgomery, Value.able author, Skaffold Chairman and Fund Manager, 8 March 2012.
by Roger Montgomery Posted in Companies, Insightful Insights, Market Valuation.
-

MEDIA
What can Directors’ Dealings tell you about Business Performance?
Roger Montgomery
March 1, 2012
Roger Montgomery discusses why ‘watching the Directors’ is a “Value.able” strategy when assessing future business performance in his March 2012 Money Magazine article. Read here.
by Roger Montgomery Posted in Companies, Intrinsic Value, Investing Education, On the Internet.
-

MEDIA
What future prospects does Roger see for Seek, Bluescope Steel and BHP Billiton?
Roger Montgomery
February 29, 2012
Do BHP Billiton (BHP), Fortescue Metals (FMG), Seek (SEK), Bluescope Steel (BSL), GR Engineering (GNG), CSL (CSL), Peak Resources (PEK), Harvey Norman, (HNN), Buru Energy (BRU), The Reject Shop (TRS), ASG Group (ASZ), Tatts Group (TTS) and Webject (WEB) make Roger’s coveted A1 grade? Watch this edition of Sky Business’ Your Money Your Call broadcast 29 February 2012 to find out. Watch here.
by Roger Montgomery Posted in Companies, Energy / Resources, Investing Education, TV Appearances, Value.able.
-
Another strong result from small Co.
Roger Montgomery
February 26, 2012
We have been delighted with the reports coming out from the smaller industrial companies and note again the growing divergence in the performance of the XJO versus the XNJ (ASX 200 versus All Industrials). We attribute this to a declining enthusiasm for the ‘resource story’ and the fact that many of the industrial companies we like (and own, including MTU) are producing such fantastic results despite evidence of a terrible domestic economic backdrop.
Headline revenue was down 14% as a result of the reduction of unprofitable EDirect business activity. Thats good. Underlying revenue (excluding the zero margin Edirect business) rose 8% and the dividend was up 29%. Business cash flow was $17.5mln compared to reported profit of $16.7mln. The impact on valuations should be positive again but ultimately will be determined by the returns generated on the $21.8mln paid for the two acquisitions made in the current half.
Since 2003 (the year before MTU listed) the company has increased profits by more than 91% per annum and is forecast to grow profits again to $36 mln in 2012. To generate the increase in profits (of $27mln to 2011) $60 million has been raised and $30 million borrowed. The return on incremental equity is about 50% suggesting the acquisitions made thus far have reflected an astute allocation of capital. We’ll be keeping an eye on the debt but reckon a recovery in the local economy (as interest rates are lowered and hopefully passed on by the banks) will give MTU another boost.
According to one of our brokers who has a buy recommendation on the stock, the following stocks are at risk of reducing their dividends: Examining for factors…”forecast earnings revisions, payout ratios, stock price stability and free operating cashflows, the companies that are most at risk of further dividend cuts are SWM, GWA, TTS, HVN, QBE and MYR. Those that have reduced dividends but continue to pose a risk include BBG, CSR, DJS, GFF, HIL, MQG, OST, PPT, PBG, PTM, TAH, and TEN.”
Not a recommendation of course. Seek and take personal professional advice before engaging in ANY securities transactions.
Posted by Roger Montgomery, Value.able author, Skaffold Chairman and Fund Manager, 27 February 2012.
by Roger Montgomery Posted in Companies, Insightful Insights, Investing Education, Skaffold.
-
Rejected?
Roger Montgomery
February 24, 2012
 We all know retail businesses are swimming against the tide. We have written about that subject here at the blog on many occasions and below is a brief list of more recent posts:
We are not investors in momentum or sentiment however this blog allows me to share our thoughts with you and we are noticing a shift in investor sentiment now. The stock market indices with exposure to resources are underperforming the indices without. The industrial indices are rising at a faster rate and falling at a slower rate than their resource-rich bretheren. Today is a classic example, This tells us that a shift is afoot. If you have been reading this blog regularly, you will know that we are also not enthusiastic about Iron Ore prices and believe prices of $100 per tonne or less are possible in coming years. On air, I have explained that is our reason for not purchasing BHP despite optimistic earnings forecasts by analysts.
I think the lower-iron-ore price story is catching on and quietly but surely investors are reducing their relative weighting to resource heavyweights.
With that in mind, it could be that most down-in-the-dumps retail sector that now holds a few gems. Next week we’ll explore the results of the reporting season but for today I thought we should revisit The Reject SHop following its half year results.
Here’s the list of recent posts covering retail stocks and the retail sector.
http://rogermontgomery.com/invest-in-kfc-or-just-eat-it/
http://rogermontgomery.com/is-it-just-harvey-norman-or-bricks-mortar-retailing-generally/
http://rogermontgomery.com/are-bargains-available-at-woolworths/
http://rogermontgomery.com/now-waving-drowning/
http://rogermontgomery.com/not-so-high-at-jb-hi-fi/
http://rogermontgomery.com/dumped-by-the-wave-of-fashion/Way back in September 2009, I published my reason for selling The Reject Shop:
“I can’t stop thinking that the value of the business just cannot rise at a fast enough clip to justify the current price. I really don’t like trading things that I have bought but I don’t think the value of the business can continue to rise indefinitely. With a share price of $13.45 (intraday today) and a valuation of $11.27, the shares are 24% above their intrinsic value. This combination of factors tells me we are safer in cash.”
Like many value investors, I was a little premature and the price first rallied to more than $17.00. Since then the price has steadily declined to $11.80 after hitting a low of $9.12.
More recently – in December – I wrote:
“The Reject Shop still enjoys its high brand awareness but, as is typical in many store roll out stories, as the offer matures the later sites are less profitable than the early sites.
This doesn’t fully explain the fact that during a period in the economy where one would expect a bargain offering to shine, it hasn’t. Eighty percent of Australians still know the brand but I believe consumer experience and mismanagement has done it some damage.
According to one report, 20% of the population believe the company offers rubbish – cheap Chinese junk that quickly breaks after use and fills our tips. It’s the very reputation China itself is trying, but frequently failing, to shake off.
The other reason for damage to the brand is confusion brought on by mismanagement. Several years ago the average unit price was about $9 and basket size was $11, but over the years one cannot help but have noticed many higher-priced items creeping into the stores.”
Value investors are often early to buy and early to sell but over the long run, being certain of a good return is safer than being hopeful of an exceptional one and so, when it comes to buying decisions a demonstrated record is often essential.
In TRS’s FY12 earnings guidance, the company noted “Significant expenditure on increasing brand awareness”. This is a real shame because at the time the company float The Reject Shop enjoyed 90% brand recognition and thats why its store roll out was working so well – shoppers knew the company, the store and the offer even though they had never been into a store in their area.
The company has provided earnings guidance for the full year 2012 of $20.5 to $22 million and while some smart analysts will note this is a 53 week year – we don’t care about such arbitrary lines in the sand. Our approach to investing is involves treating any purchase and ownership as if we owned the whole company. In that light and over the long term it doesn’t matter whether there are 52 weeks in a year or 52.5 or 53.
Thirteen analysts cover the stock and this week, eight have upgraded (only one downgraded) their forecasts for 2012 (remember the downgrade could be an error on the part of teh analyst rather than the company disappointing) . I still believe the business will mature but there could be some value in the turnaround and a stabilisation of strong cash flows, and returns on equity over the next few years around 35%. This is the rate of return on equity the company generated on $21 million of equity in 2005 (its intrinsic value then was around $4.00). Today the company is expected to return to 35% returns on equity but on 3 times the equity. You should be able to estimate the intrinsic value from those metrics.
There have been terrific results amongst our fund holdings such as Credit Corp, Seek, Breville Group, ARB, Decmil and Maca. Have you been encouraged by any of the results? Start a discussion by clicking on the Comments button below.
Posted by Roger Montgomery, Value.able author, Skaffold Chairman and Fund Manager, 24 February 2012.
by Roger Montgomery Posted in Companies, Consumer discretionary, Value.able.


