Market Valuation
-

MEDIA
Back to the Good Old Days?
Roger Montgomery
January 29, 2013

In his first television appearance for 2013, Roger provides his insights into the reasons behind the recent rallies on Australian and Global Markets and how and if these trends will continue in discussion with Ticky Fullerton on ABC1’s The Business (Roger appears at 3:30). Watch here.
This edition of The Business was broadcast on Tuesday 29th January 2013.
by Roger Montgomery Posted in Companies, Insightful Insights, Market Valuation, TV Appearances.
-

Codan – a golden opportunity
Russell Muldoon
January 25, 2013
On 18 January, it was reported here that a 5.5 kg gold nugget (worth up to $300,000) was found in Ballarat with the help of a Minelab GPX-5000 metal detector. Minelab is a world class brand owned and managed by Codan Limited (ASX: CDA), a company that we hold in our investment funds.
continue…by Russell Muldoon Posted in Energy / Resources, Market Valuation.
-

Brand Manager Battles
Russell Muldoon
January 24, 2013
The half-year reporting season has begun in earnest this week with a slight trickle of financials coming through.
Of little interest to us so far are the reports from a number of listed investment companies (LIC’s) and also Agenix Limited (ASX: AGX), an unprofitable early-stage medical device company. These reports and many others like them are quickly pushed to one side to ensure we focus our time, energy and effort on more productive outcomes. Conversely, we have read GUD Holdings half year with interest.
continue…by Russell Muldoon Posted in Insightful Insights, Market Valuation.
-
McMillan Shakespeare
Russell Muldoon
January 18, 2013
The recent share price fall (now partially recovered) in McMillan Shakespeare over the past week can largely be attributed to this article in The Australian.
by Russell Muldoon Posted in Insightful Insights, Market Valuation.
-

We are delighted by Silver Chef
Russell Muldoon
December 20, 2012
We are delighted by the trading update provided late Wednesday night by Silver Chef’s (ASX: SIV) – a business I mentioned just last week on the Sky Business Channel as a ‘Stock to Watch’. It is also one we own in the both The Montgomery Fund and The Montgomery [Private] Fund.
Management have forecast strong EPS growth of 12.7% to 18.3% for the first half. This would be an excellent achievement in what many have dubbed a tough retailing environment. Clearly not everyone in the retail sector deserve to be tarred with the same brush.
Our expectations are for the business to report earnings at the top-end of this range given the underlying momentum and demand for their product suite.
Silver Chef provides lease financing to hospitality businesses under the Silver Chef brand and more recently, for commercial businesses under its GoGetta brand and excellent risk management processes appear to be in place. Both brands enjoy a growing a reputation as industry-leading financing product providers. In particular Rent-Try-Buy and Rent-Grow-Own put less stress on a businesses cash flow in their start-up phases, a large reason for their take-up.
Management have indicated to us that they believe their potential market is equivalent to about $250m in revenue per annum. At the full year 2012, SIV reported $85m in revenue. With the potential to expand by a factor of 3x from here, we are long-term holders and anticipate many more positive future updates. Keep watching this space.
A word of caution. We have a large holding across our two well-diversified funds in Silver Chef and as shown, the share price has performed spectacularly well recently. Please therefore seek professional advice and understand the risks.

by Russell Muldoon Posted in Companies, Insightful Insights, Market Valuation, Value.able.
-

WHITEPAPER
THE PROPERTY RUG PULL
Discover how proposed changes to negative gearing, Capital Gains Tax and holiday home tax rules could reshape property investing, and why investors may consider private credit as property returns become less certain and tax advantages diminish.
READ HERE -

A 2012 Report Card
Tim Kelley
December 20, 2012

At this time of year, many of us are inclined to take stock of highlights and lowlights of the year gone by, and perhaps to consider what we might wish for the year ahead. Accordingly, we thought it might be interesting to look at the best and worst performing ASX stocks during the past 12 months, and see what sort of story they tell.
The list below sets out the top performers according to Bloomberg. We have limited the analysis to stocks with a market capitalization of at least $200m.
continue…by Tim Kelley Posted in Insightful Insights, Market Valuation, Value.able.
-
MEDIA
What are Roger Montgomery’s insights into value in the current market?
Roger Montgomery
November 21, 2012
Do Maxitrans (MXI), QBE (QBE), ARBE Corporation (ARP), Cobar Consolidated (CCU), IOOF (IFL), Seek (SEK), Fleetwood (FWD), Adelaide Brighton (ABC), NIDO Petroleum (NDO), Boral (BLD), Cardno (CDD), Jumbo Interactive (JIN) or Coca Cola Amatil (CCA) achieve the coveted A1 grade? Watch this edition of Sky Business’ Your Money Your Call 21 November 2012 program now to find out, and also learn Roger’s insights into value in the current market in resource stocks. Watch here.
by Roger Montgomery Posted in Companies, Investing Education, Market Valuation, TV Appearances.
-
Is Telstra in love with Ten?
Roger Montgomery
November 16, 2012

With the Ten share price up 5% today we reckon some participants must be trading on rumours. In this case, rumours are swirling around the market that Telstra is about to buy Ten. We don’t of course trade in rumours and we won’t be starting now. We are keen however to watch Telstra’s content strategy roll out – in anticipation of the NBN being completed. As we have previously mentioned, by 2017 Telstra will likely dominate the digital delivery of content. The delivery platform will have been levelled and so the competitive focus for Telstra needs to be content. They’ll knock on your door with a big black box and bundled deal offering IPTV, Foxtel, FoxSports and (Ten?) all on the one platform for one great price….
So could Ten be part of that strategy? As is always the case with rumours, time will tell.
by Roger Montgomery Posted in Companies, Insightful Insights, Market Valuation.
-
MEDIA
What are David Buckland’s insights into Small Cap Mining stocks?
Roger Montgomery
November 6, 2012
Do Imdex (IMD), Sundance Resources (SDL), Woodside (WPL), Axiom Mining (AVQ), Seven West Media (SWM), Silverlake Resources (SLR), Mesoblast (MSB), Titan Energy (TTE) , Metcash (MTS), Emeco (EHL) or Magellan (MFG) achieve the coveted A1 grade? Watch this edition of Sky Business’ Your Money Your Call 6 November 2012 program now to find out, and also discover how David approaches investing in small cap mining stocks. Watch here.
by Roger Montgomery Posted in Companies, Insightful Insights, Market Valuation, TV Appearances.
-
MEDIA
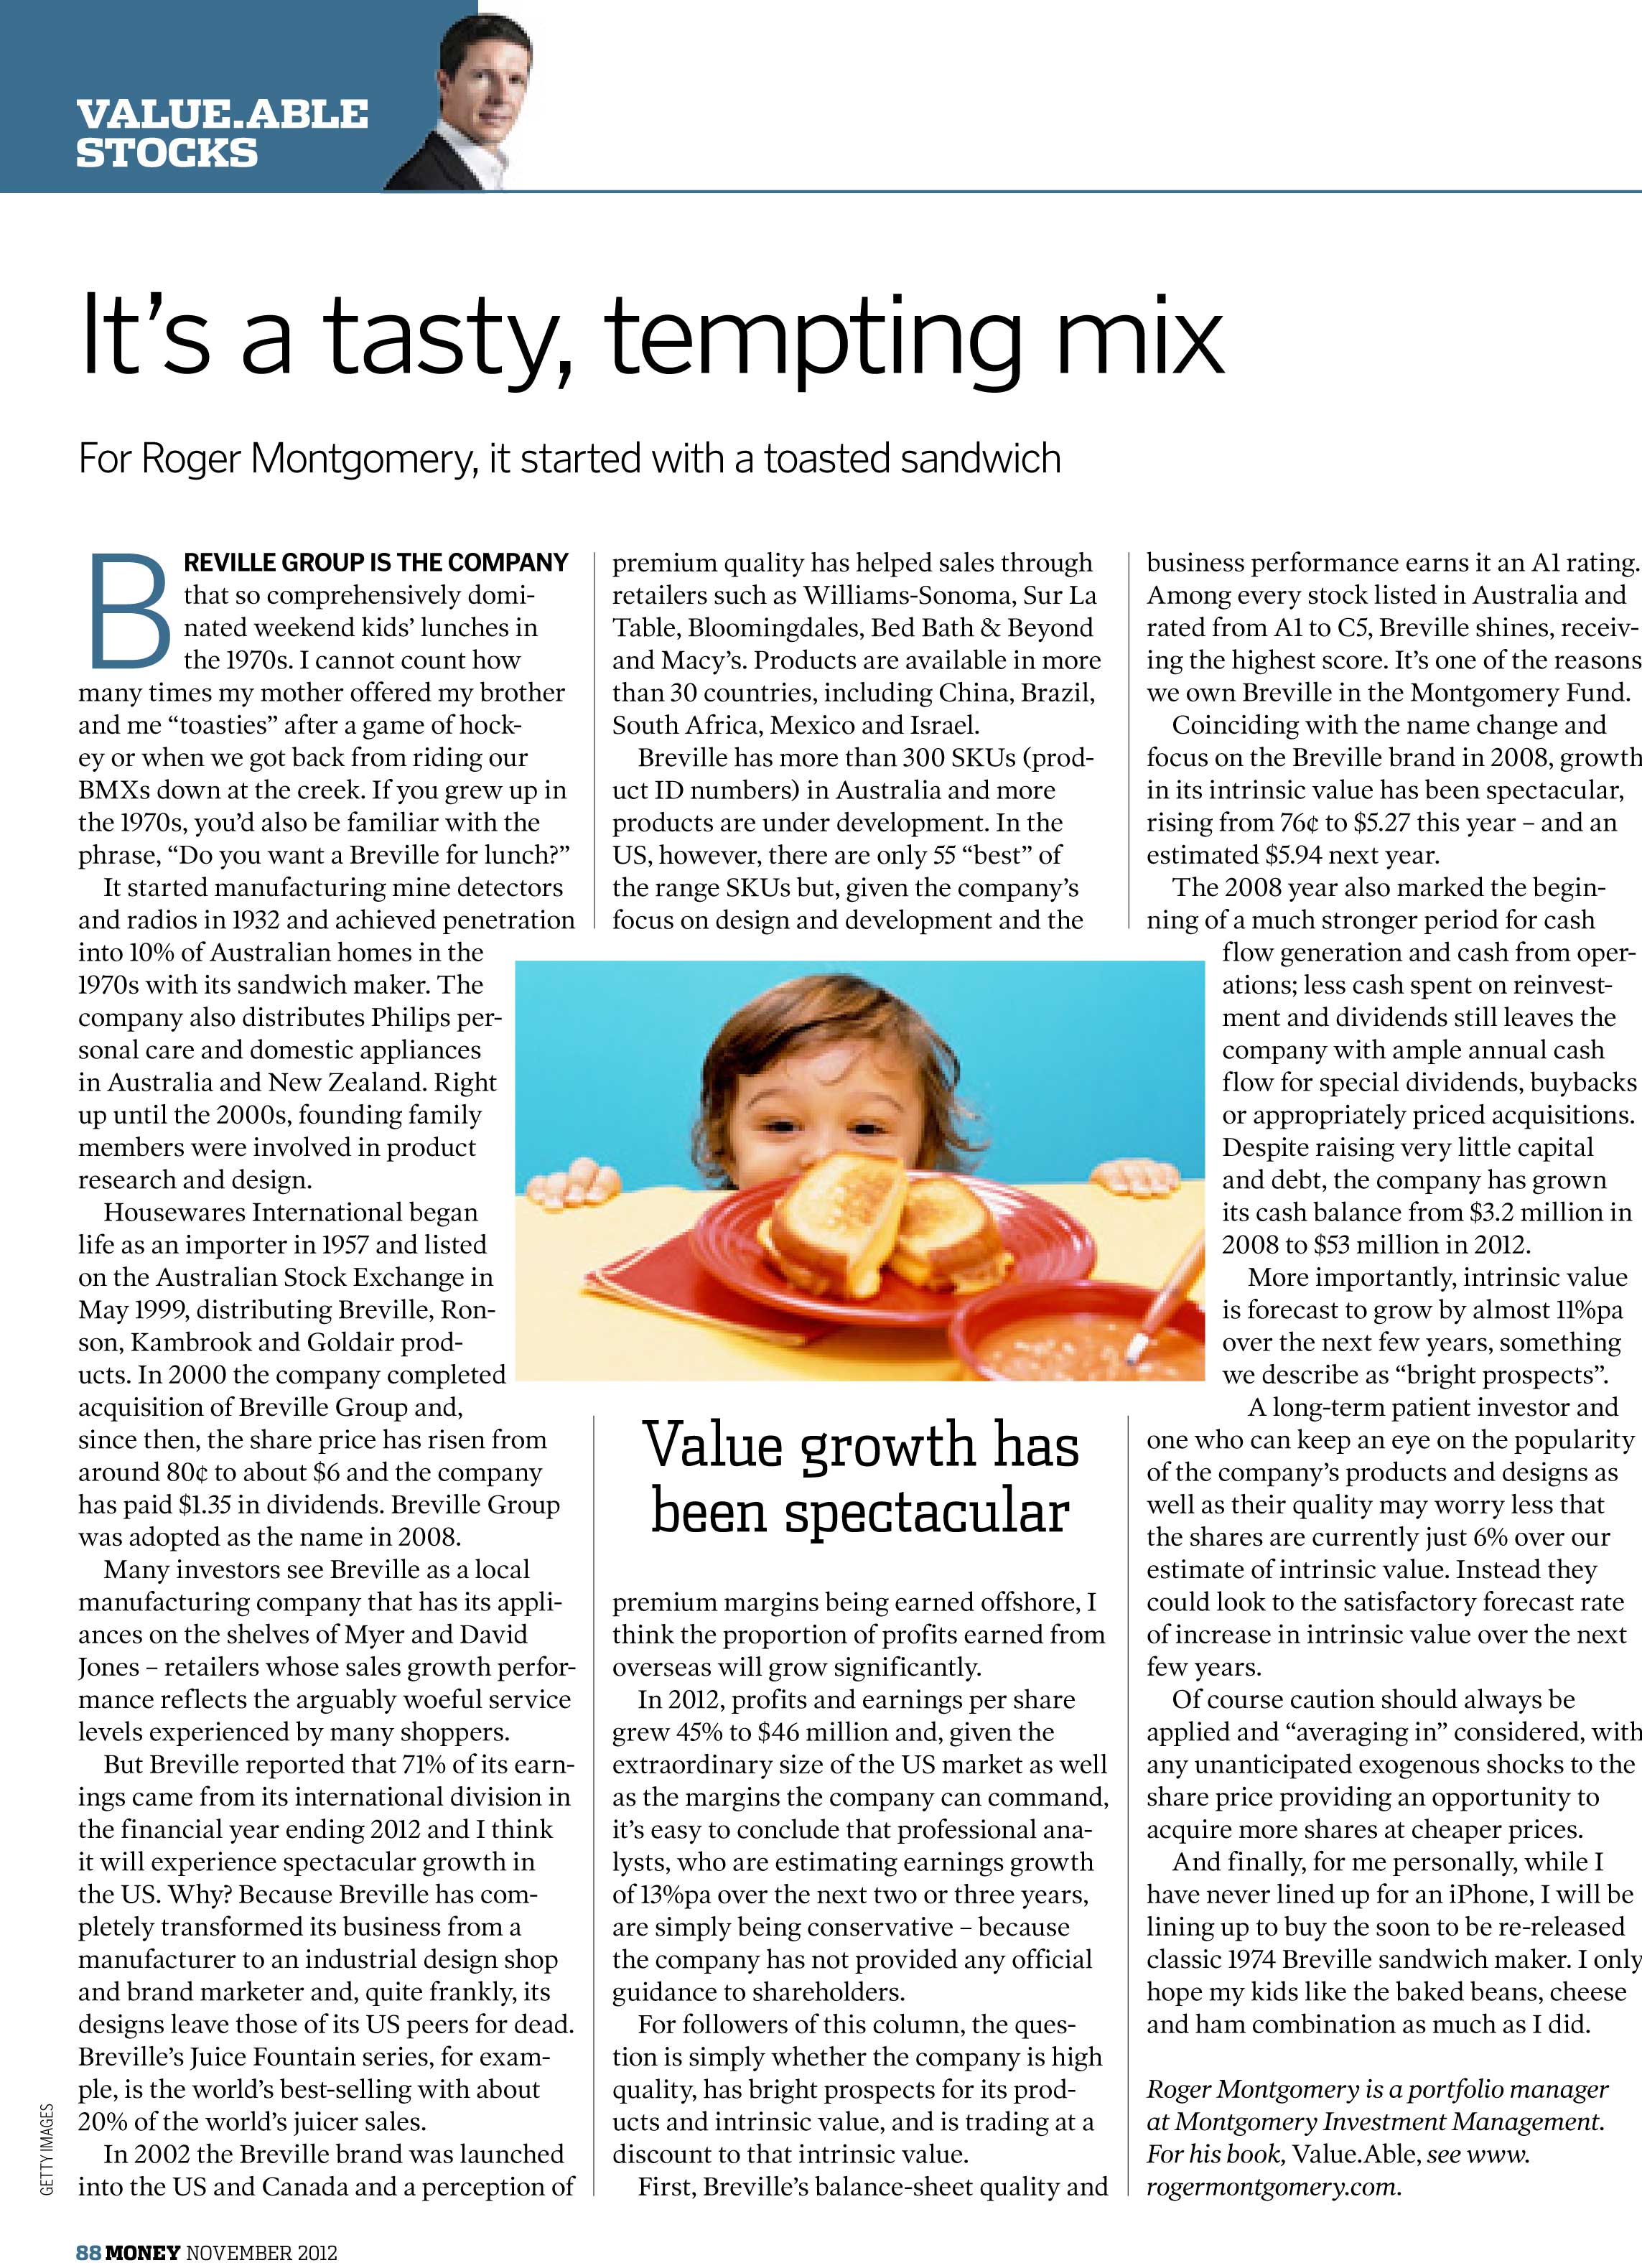
It’s a Tasty,Tempting Mix
Roger Montgomery
November 1, 2012
In his Money Magazine November 2012 article, Roger highlights the ongoing competitive advantage of Breville Group (BRG). Read here.
by Roger Montgomery Posted in Companies, Market Valuation, On the Internet.
- save this article
- POSTED IN Companies, Market Valuation, On the Internet
