
What could a crash look like?
The defining irony of today’s stock market has got to be the yawning chasm between asset prices and their intrinsic values. As equity indices scale ever higher peaks, and as hyper-parabolic Price-to-Earnings (P/E) and Price-to-Sales (P/S) ratios are normalised, the underlying truths don’t seem to have changed. Eventually even this bubble must bust.
U.S.-based senior economist at the Centre for Economic and Policy Research (CEPR) in Washington, DC, and author of the ‘AI Bubble Monitor’, and U.S.-based antitrust and policy analyst Matt Stoller reckon this dynamic can be attributed to something Stoller calls the “Number Go Up Rule”– a systematic rewiring of institutional incentives to ensure corporate valuations ascend at all costs, and frequently favouring speculative mania over fundamentally productive or socially additive enterprises.
Historically, the sort of extreme decoupling we’re witnessing today resolves itself only when governance is imposed on the system after a systemic breakdown. The idea that ‘we can’t let it happen again.’ Financial history chronicles policy being shaped in the immediate aftermath of structural failures, when an isolated rupture – the collapse of Long-Term Capital Management in 1998, the Thai Baht Devaluation in 1997 and the BNP Money Market Fund freeze in 2007 – rapidly metastasised into an economy-wide crisis.
With capital expenditures in artificial intelligence (AI) projected to consume between US$750 billion and US$1 trillion globally this year alone, the pressing macro question is structural financing, remembering also that a mere seven tech giants account for roughly one-third of the total capital value of the U.S. equity market.
What if, as we’ve seen in all prior episodes of significant concentration, the current instance also represents an unsustainable bubble? What happens when the music stops?
Figure 1. Prior Instances of market concentration
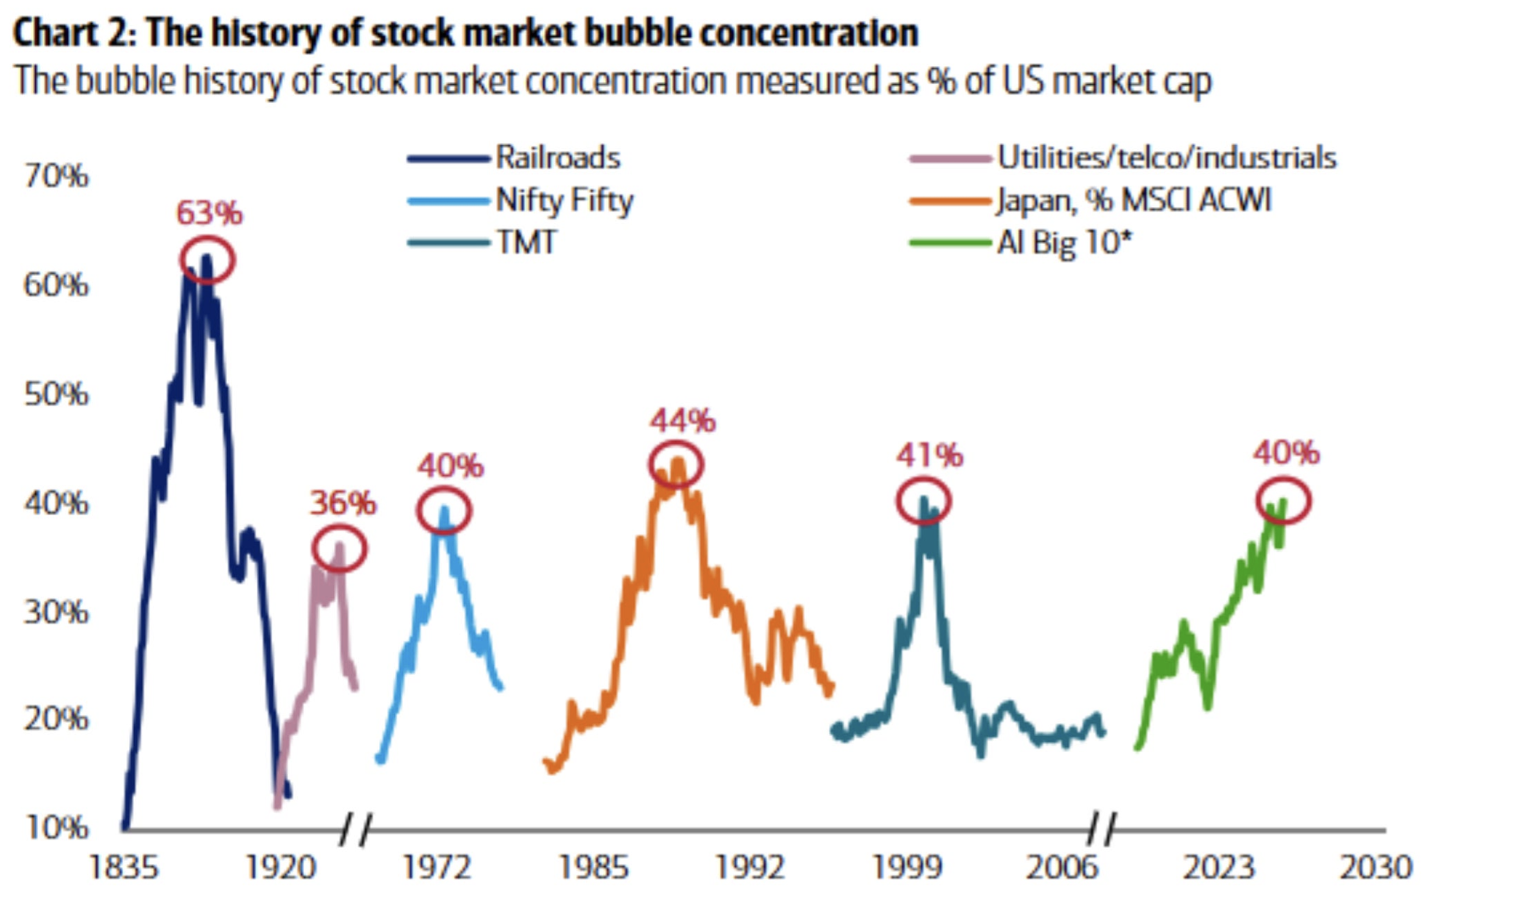
Source: BofA Global Investment Strategy GFD Finaeon, Bloomberg. Note: Japan is measured as a % of MSCI ACWI, all others as % of US stock market. *AI Big 10 = Magnificent 7 + Broadcom, AMD, and Micron.
By examining the mechanics of financial contagion and tracing how shocks cascade across corporate balance sheets, we can contrast a potential AI drawdown against the two defining structural collapses of the modern era: the 2008 banking crisis and the 2000 dot-com bust.
Anatomy of contagion: Debt vs. Equity shock
To evaluate the systemic risk of an investment class, economists look to the funding mechanism. As Carmen Reinhart and Kenneth Rogoff noted in their 2009 book, This Time Is Different: Eight Centuries of Financial Folly, financial crises generally trigger deep recessions when they are fuelled by extensive leverage. When speculative assets are acquired with borrowed money, a slump in asset values ignites a rapid chain reaction of defaults, forced liquidations, and acute balance sheet distress across the banking sector.
Is the AI Boom a rerun of 2008?
The makings of the 2008 Global Financial Crisis (GFC) were built entirely on private debt. In the decade leading up to the crash, U.S. household mortgage and consumer debt expanded at an annualised rate of nine per cent, culminating in a US$14.5 trillion mountain of private obligations by 2007. At the beginning of 2008, Mexican strawberry pickers earning less than US$14,000 per year were due to make the first repayments on $300,000 home loans they’d be extended with no deposit and long repayment holidays. Many never made their first repayment. Then, when the underlying collateral – in this case, residential real estate – deflated, the entire financial system seized, suffering a dual crisis of liquidity (an inability to sell complex instruments for cash) and solvency (the reality that the underlying assets were fundamentally worth less than the debts secured against them).
As Stoller points out, the current AI capital build-out exhibits fundamentally different structural plumbing. While financial watchdogs have expressed valid anxieties over the rapid growth of private credit – unregulated shadow-lending networks that have funnelled billions into specialised data centre developers – the broader macro landscape is not defined by an over-leveraged consumer base.
Because the current AI expansion is largely funded by robust corporate balance sheets and sovereign debt rather than highly leveraged retail mortgages, a sudden correction is unlikely to trigger a banking solvency crisis.
A Dot-Com analogue?
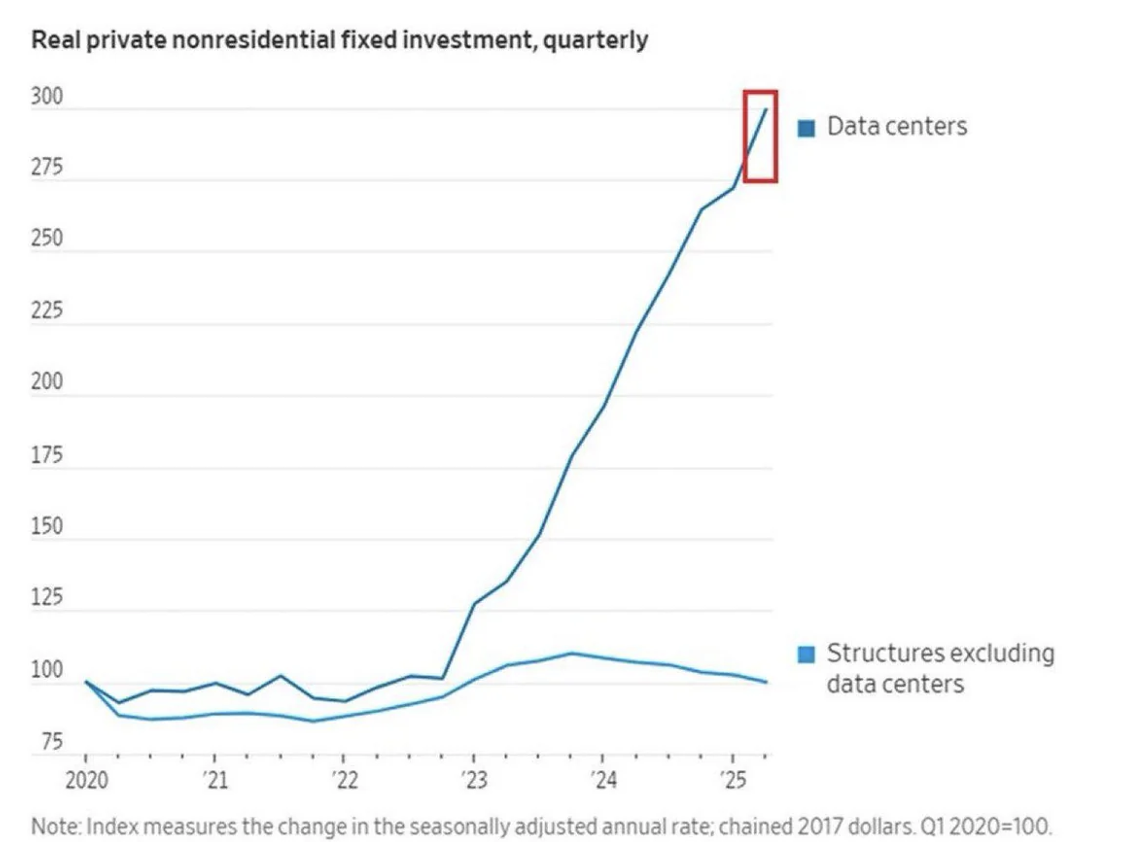
Instead, the structural dynamics of the current AI infrastructure build-out seem to closely parallel the telecom and internet boom of the late 1990s. The dot-com collapse was characterised by massive overinvestment in physical capacity.
When the tech-heavy NASDAQ cratered by 77 per cent between 2000 and 2002, it triggered a sharp corporate capital expenditures recession rather than a catastrophic banking collapse.
The current data centre and chip-procurement boom has become the primary engine of macroeconomic expansion, with consensus estimates suggesting that specialised infrastructure investment has contributed significantly to recent U.S. Gross Domestic Product (GDP) growth numbers.
Figure 2. AI has contributed about 63 per cent or 1 percentage point to GDP (Jan-Jun 2026)
Source: BofA Global Research
If the budgets of corporate enterprise customers begin to balk at high agentic AI pricing – pricing that AI providers need to generate a decent Return On Investment (ROI), a severe investment-led slowdown becomes a distinct reality.
We aren’t predicting that here, but it is worth considering the implications if it were to happen.
Second order consequences
Of course, we all know an equity ‘de-risking’ event doesn’t happen in a vacuum. If AI stocks slump, they’ll likely take the rest of the market with them. So, even without the systemic leverage of the subprime era, a steep correction in mega-cap technology valuations would rapidly spread through the broader economy via several transmission channels.
- The COVID Wealth Effect – Quadrupled!
The ‘wealth effect’ describes how changes in paper asset values influence actual consumer behaviour. Historically, equity fluctuations had a muted impact on day-to-day spending because stocks were viewed as long-term retirement holdings. However, data from consumer credit networks indicate that the wealth effect has intensified significantly.
Prior to the pandemic, every US$1 change in household paper wealth altered consumer spending by roughly US9 cents. Recent estimates show that the metric has surged to approximately US34 cents. If, on average, a household’s wealth falls by US$100,000, they are going to spend US$34,000 less at the shops.
According to estimates by Dean Baker, today’s stock market capitalisation is nearly US$80 trillion, double what it was at the peak of the tech bubble in 2000. It is also 2.5 times the size of the U.S. economy. The implication is that a stock market return to its long-term average PE of just under 20 would, according to Baker, cut US$300,000 in paper wealth per household from balance sheets. Subsequent spending would decline by more than US$100,000 per household.
Figure 3. Price-to-Earnings Ratios: “Magnificent Seven” and other tech companies vs. long-term average
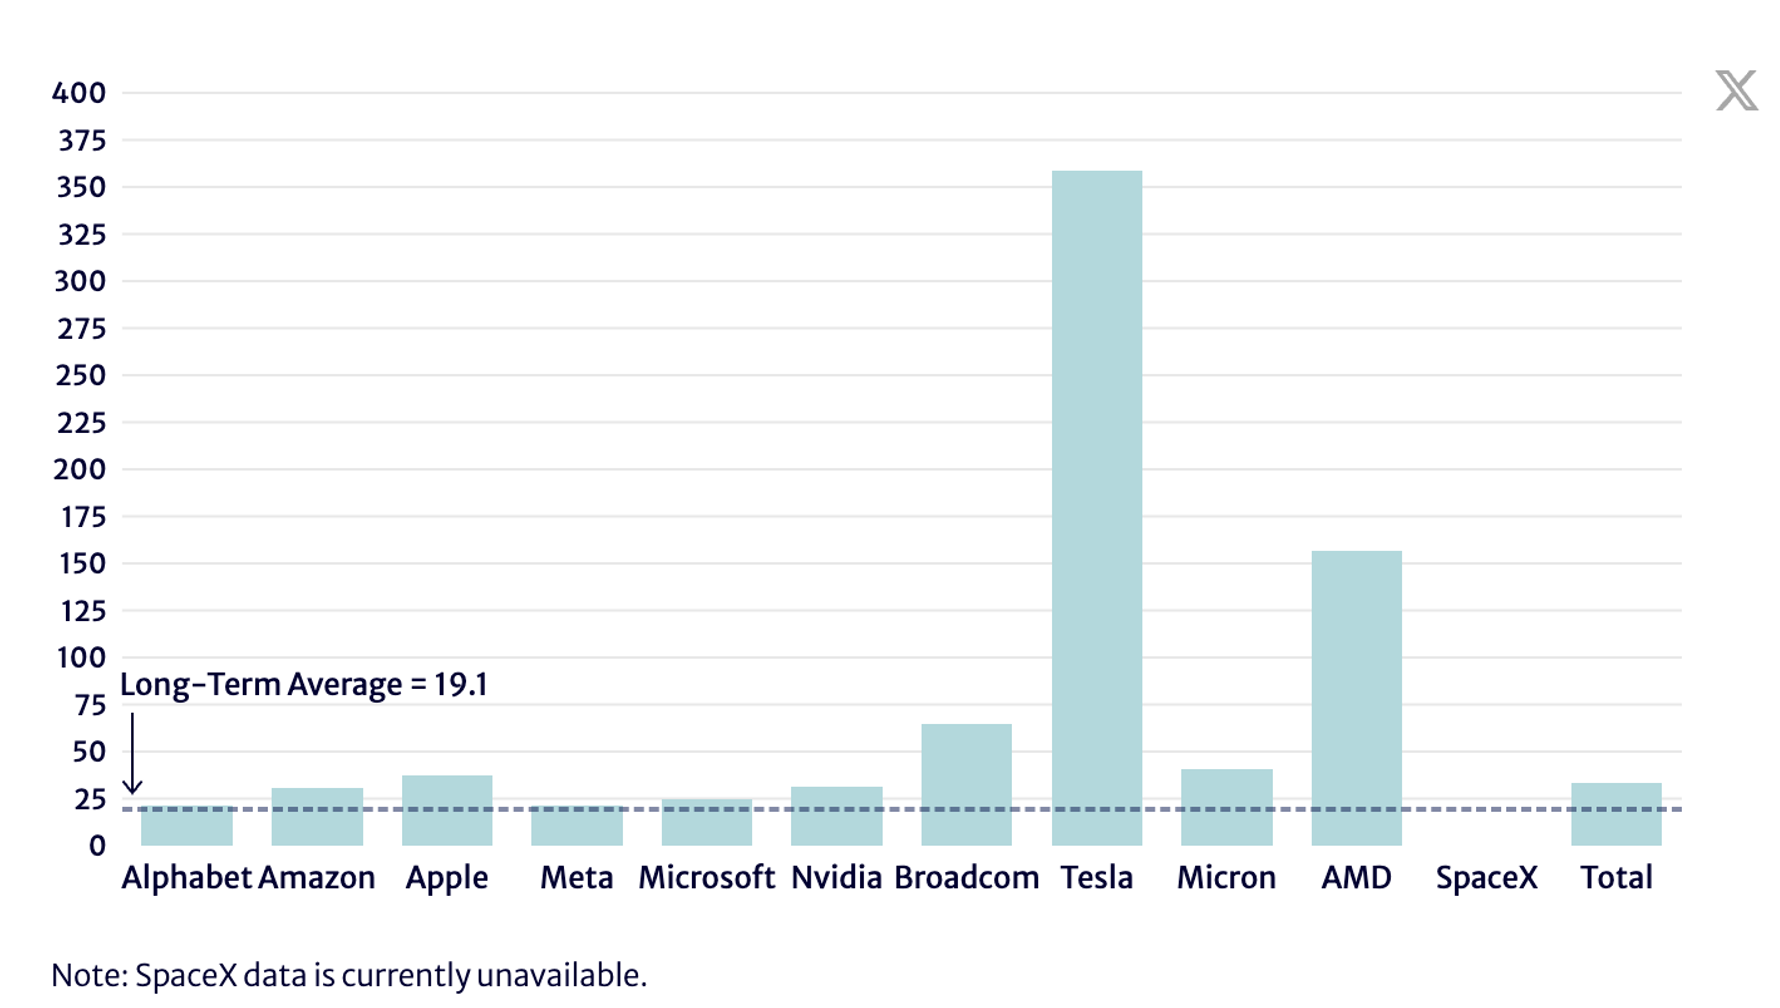
Source: Author’s calculations, Yahoo! Finance
In other words, Americans are more exposed to equity markets than ever before – with roughly 45 per cent of total household financial assets tied directly to stocks. Therefore, any sharp correction in the AI Tech leaders driving market returns would trigger an immediate contraction in aggregate consumer demand.
- Private Equity and institutional illiquidity
The shockwaves of a sell-off would immediately reverberate through the private markets. Global private equity (PE) assets under management now exceed US$23 trillion – roughly a twentyfold increase since the turn of the century.
Because PE sponsors calculate the marked valuation of their private portfolios using public market multiples, a sharp contraction in public tech valuations forces a corresponding write-down of private asset values.
This environment could create a severe liquidity strain for institutional investors, including pension funds and university endowments (some of whom annually redeem fixed portions of their portfolios), which are legally bound by capital calls to inject cash into these PE funds, precisely when their liquid public holdings are declining.
- Geopolitical balance sheets and fiscal strains
On a macroeconomic level, AI infrastructure spending has engineered massive trade surpluses for key East Asian export economies (Japan, South Korea and Taiwan) that manufacture the bulk of high-end silicon logic and thermal management hardware for data centres. A sudden drop in global infrastructure demand would force these sovereigns to rebalance their massive portfolios of dollar-denominated assets, potentially destabilising the sovereign debt markets that support the U.S. fiscal deficit.
Concurrently, U.S. regional tax bases would face immediate shortfalls. States like California and New York have seen tax receipts run ahead of projections due to windfall capital gains. A severe market reversal would flip these windfalls into structural deficits, forcing immediate state and local government expenditure cuts.
- The regulatory vulnerability
Stoller points out that a prolonged market expansion inevitably conceals structural vulnerabilities, or what economist John Kenneth Galbraith famously termed the bezzle – the temporary wealth existing in the interval between a fraudster’s embezzlement and its eventual exposure. In a highly financialised era characterised by the systematic hollowing out of key regulatory oversight frameworks – witness the NASDAQ changing the rules for the SpaceX IPO – speculative bubbles routinely obscure structural and operational inconsistencies.
When market liquidity evaporates, institutional clients aggressively recall capital, invariably exposing structural fault lines. This classic unwinding was seen clearly when the liquidity demands of 2008 abruptly dismantled completely unrelated financial irregularities, most notably Bernie Madoff’s multi-decade Ponzi scheme.
If capital allocation slows down, similar operational strains could manifest across various consumer fintech platforms, potentially catching unsophisticated depositors and retail counterparties completely off guard.
Conclusion
When a major financial bubble (like the current artificial intelligence boom?) bursts, the resulting crash is driven by panic, with everyone – from retirees trying to protect their super to corporate CEOs – stepping on top of one another in the race to ensure they’re not left holding the bag. It’s worth remembering, however, as we have written previously, it seems the U.S. financial system is set up to rescue Wall Street, to save the institutions that are ‘too big to fail’ while leaving retail stock market investors to absorb the losses. Privatising profits while socialising losses is also par for the course. So today, because people assume a bailout is all but certain, they choose to keep fuelling a dangerous bubble rather than miss out.
The ultimate takeaway is that while a recession and a burst bubble are chaotic and unpredictable, they eventually force a rest. They force capital back into productive companies that create real-world utility, making the market a much safer, healthier place to build wealth over the long run. At least, until the next bubble.
Roger Montgomery is the Founder and Chairman of Montgomery Investment Management. Roger has over three decades of experience in funds management and related activities, including equities analysis, equity and derivatives strategy, trading and stockbroking. Prior to establishing Montgomery, Roger held positions at Ord Minnett Jardine Fleming, BT (Australia) Limited and Merrill Lynch.
He is also author of best-selling investment guide-book for the stock market, Value.able – how to value the best stocks and buy them for less than they are worth.
Roger appears regularly on television and radio, and in the press, including ABC radio and TV, The Australian and Ausbiz. View upcoming media appearances.
This post was contributed by a representative of Montgomery Investment Management Pty Limited (AFSL No. 354564). The principal purpose of this post is to provide factual information and not provide financial product advice. Additionally, the information provided is not intended to provide any recommendation or opinion about any financial product. Any commentary and statements of opinion however may contain general advice only that is prepared without taking into account your personal objectives, financial circumstances or needs. Because of this, before acting on any of the information provided, you should always consider its appropriateness in light of your personal objectives, financial circumstances and needs and should consider seeking independent advice from a financial advisor if necessary before making any decisions. This post specifically excludes personal advice.
Its a Great point of view
Thanks, Ramya.