Insightful Insights
-
What on earth is a covered bond?
Roger Montgomery
November 18, 2011
When Sean Connery played James Bond in the 1967 hit, You Only Live Twice one doubts he had this week’s billion dollar covered bond issue of ANZ in mind. Asking the question “what is a covered bond?” reveals an extra life has been given to borrowers at the expense of prudent savers. Its Australia’s own little moral hazard.
moral hazard n.- a situation in which a party insulated from risk behaves differently from how it would behave if it were fully exposed to the risk.
According to the Treasurer, Wayne Swan, legislation the government passed last month will strengthen the local financial system, increase the supply of credit, and provide cheaper, more stable and longer-term funding.
ANZ this week issued $US1.25 billion of five-year covered bonds. CBA is looking to Europe for its issue while Westpac and NAB are said to be eyeing the US debt markets for theirs ahead of increases in wholesale funding costs on their upcoming refinancing.
When banks issue covered bond they pay a lower rate on their funding than if they issued senior unsecured debt. And if as some commentators suggest the banks in aggregate issue $100 billion of this stuff in coming years the savings can amount to more than half a billion in interest expenses.
The lower rate that banks enjoy on covered bonds is partly due to the AAA rating they receive. This AAA rating (which is higher than the AA rating the banks themselves enjoy) is derived from the fact that banks can use their assets (loans presumably) as collateral for issuing the bonds. If the bank goes bust, the bond holder as recourse to those assets.
Interestingly (and here’s why they just might be Triple A), if the assets are worthless the bondholder has recourse to the bank itself. In other words those bond holders get access to your deposit money and those bond holders rank BEFORE you in terms of their right to your money.
Unsurprisingly, the size of the covered bond market is therefore capped. Banks can only issue covered bonds backed by up to 8 per cent of their assets. Based on the majors’ full year results, the ANZ, CBA, WBC and NAB have a collective $2.686 trillion in assets. Eight percent of those assets amounts to $214.9 billion.
Many believe that the issues in Europe are contained to Europe. Someone wriley observed recently however that debt crises are only contained to planet earth. Investors like central banks who are limited to investing in AAA rated securities will no doubt be interested in the paper because our banks are perceived as safe. But what is that assumption based on? We’ll leave that discussion for your comments below.
What I am most interested in is the unilateral decision to allow that which has previously not been permitted; To rank a bond holder ahead of you in terms of rights to your deposits.
On the flip side, the banks argue that the cheaper funding means you can borrow from them more cheaply – assuming they pass it on of course. But like the ladies in James Bond’s bath, its all part of the policy drive in this country to make things cheap. Cheaper cars at the expense of local manufacturing, cheaper flights at the expense of local jobs, cheaper food at the expense of local farmers and cheaper bonds at the expense of your entitlement to your deposit.
Keep prices down and there won’t be an uprising. Have a good weekend.
Posted by Roger Montgomery, Value.able author and Fund Manager, 18 November 2011.
by Roger Montgomery Posted in Financial Services, Insightful Insights.
-
Are bargains available at Woolworths?
Roger Montgomery
November 17, 2011
On Wednesday November 2 Woolworths held a strategy briefing for professional investors. Woolworth’s effectively asked us to adopt a longer time frame before judging its performance and revealed four strategic priorities that I will describe in a moment.
Prior to the strategy day, the company updated the stock market with a growth outlook that was the lowest in a decade. The market responded negatively to the change and it entrenched previous sentiment by professional investors to switch from Woolworths to Coles.
But Woolworths remains a superior business from a business economics perspective, with high return on equity and it also remains cheaper than its competitor as measured by the larger discount to an estimate of its intrinsic value.
The wider sentiment towards Woolworths Supermarkets is that the period of strong growth is over, and the other businesses, such as Big W, the New Zealand supermarkets, the Masters hardware venture and a possible acquisition of The Warehouse group could be the focus of earnings growth for the company. Gambling pre-committments would not be.
Meanwhile, the Woolworths-owned Dick Smith electronics business appears to have failed to excite consumers and has certainly failed to excite investment professionals. Dick Smith is a relatively weak offering in a market that has been hit particularly hard by the empowerment of the consumer through high Australian dollar.
Moreover, in many ways these businesses are peripheral since the Australian Food & Liquor division accounts for 80% of earnings before interest and tax.
The impact of the company’s lower growth profile on intrinsic value, particularly intrinsic values over the next two years, has been negative and intrinsic value does not appear to be going anywhere in a great hurry (see Skaffold chart below).
This combination of circumstances, in my experience, set Woolworths shares up to be vulnerable to any negative shocks.
Estimating intrinsic value is not the same as predicting price direction, however the above circumstances are not unique historically in putting a lead on price appreciation.
On top of the above combination of factors, there is also the continuing debate in Parliament about the introduction of preset loss limits for poker machines, which, if introduced, would negatively impact Woolworths’ gaming business. Though it is most closely associated with supermarkets, Woolworths is actually the largest poker machine owner in the country, with more than 10,700 pokies.
And a few weeks ago, The Economic Times of India also reported that Woolworths appears to have been dumped by its Indian partner, Tata Group. Woolworths enjoyed a five-year partnership with Tata, introducing Dick Smith-style electronics stores to India under the Infiniti Retail brand. Even though foreign retailers are not permitted to have a direct presence in India, Woolworths partnership offered the hope of growth – albeit with a partner – if the rules were ever relaxed.
Nonetheless, despite these accumulative negative factors, Woolworths is regarded by conventional analysts and investors as a defensive’ company. Its strong cash flows and its status as a major retailer of food makes it an ideal investment in a recessionary or slow or low growth environment. The company also enjoys entrenched competitive advantages over smaller rivals that, until now, the ACCC has done little about. One example of this are the new EFTPOS charges.
From the first of this month, the new Eftpos Payments Australia Limited (EPAL) fees mean retailers incur a 5¢ fee for every transaction over $15 (75% of all EFTPOS transactions). Previously there was no fee and that will still be the case for transactions under $15, which means 25% of transactions.
The retailer’s bank will charge the retailers, some of whom are describing the charges as an “EFTPOS tax”, and they will have no choice but to pass on to the consumer.
Unsurprisingly, EPAL’s members include the major banks, Coles and Woolworths and, because they manage their own terminals, they can opt out of the new charges.
But despite these entrenched advantages, Woolworths has been hit – or so it says – by the state of the economy, noting in its annual report: “Consumer confidence remained historically low as customers reacted adversely to rising utility costs, interest rate hikes in the first half of the year and general global uncertainty, and opted to save rather than spend their money”.
From an investment perspective it is worth noting that retail investors now have a choice of supermarkets, with Coles improving its offering to consumers and taking market share from the incumbent Woolworths.
The investment community is not convinced that further changes to private-label offerings or more innovation around the supply chain will make a dramatic difference to the growth prospects for Woolworths, which set below forecast growth in household income, population and the economy.
One other source of earnings growth is cost-cutting, but the reality is that gains from such strategies are one-offs and again unlikely to excite investors.
Having presented the negatives – which have caused the share price to fall 12% since July, one positive was the strategy briefing’s opportunity to showcase new CEO Grant O’Brien, who replaces Michael Luscombe. The company announced that it planned to extend and defend its leadership in food and liquor, act on the “portfolio” to maximise shareholder value, maintain its track record of building new growth businesses (we’ll ignore Dick Smith) and finally, put in place the enablers for a new era of growth.
In the supermarkets business WOW hopes to grow fresh produce from 28% market share to 36% market share. If achieved this would be an additional $2.5b in sales. Woolies also wants to target a doubling of home brand sales and this aim flies in the face of the ACCC’s stated concerns.
The company will also open 35 new BIG W stores in next 5 years reaching 200 by 2016.
In a reflection of the massive structural shift online, BIG W’s 85,000 in-store SKUs will be expanded and all put online.
And the topic on the tip of everyone’s tongue; Masters. There are now five stores open, another two are due to open in December/January, there are 16 under construction another 100 in the pipeline and the company reported the venture is well ahead of budget.
I also note the advertised sale of $900 million of property ($380 million of which was sold last financial year); and, most recently, the oversubscribed $500 million hybrid note raising that substantially extend the balance sheet strength of the company.
Below we examine the intrinsic value track record and prospects for Woolworths based on current expectations for earnings growth and returns on equity using Skaffold.com
Woolworths (MQR: B2) is currently trading at the same price it was in December 2006 and February 2007, despite the fact profits have risen 11.1% pa, from $1.3 billion to a forecast $2.2 billion in 2012. This growth in profit however is offset by having 16 million more shares on issue; by increased borrowings – up $1.8 billion to $4.8 billion; and by retained earnings, which have risen by $2 billion. The increase in shares on issue and retained earnings have offset the positive impact on return on equity rising profit would normally have.
The latest estimate of its intrinsic value, of $23.23, is forecast to rise modestly over the next two years. For investors looking at opportunities to investigate only when a meaningful discount to intrinsic value is presented, a price of $19 or less for Woolworths would represent at least 20 per cent.
Posted by Roger Montgomery, Value.able author and Fund Manager, 17 November 2011.
by Roger Montgomery Posted in Companies, Consumer discretionary, Insightful Insights, Investing Education, Skaffold.
-
Is it just Harvey Norman or bricks & mortar retailing generally?
Roger Montgomery
November 17, 2011
You don’t normally expect to get investment tips from a mothers’ group get-together, but that’s what happened to me recently when the conversation turned to retail operations.
Relaxing with a glass of pinot gris the women, who have met regularly for a decade, were explaining why they spend less time in Harvey Norman stores than they used to. Why? Tired stores, tired layouts and uncompetitive prices have served the retailer only with the need to revamp its entire offering. And that, it hasn’t done.
Retailing in Australia has been in the eye of a perfect storm for some time. As I’ve written previously, the strong Australian dollar has encouraged overseas travel and online purchases from overseas businesses; and the two-speed economy has ensured that credit growth (the borrowing of more money to buy stuff) is muted.
I’ve always been suspicious of a company that issues a report to the market after the close of trade. On Monday 31 October, a major retail business in Australia did just that. After closing time, Harvey Norman released its sales and earnings for the first quarter of the 2012 financial year. Given its timing, the announcement was almost certain to be negative. Indeed, the stock fell 4% the next day.
Instead of focusing on the retailing offer, refreshing store designs and improving range, company representatives focus on property, horse racing (Gerry Harvey is one of the country’s biggest bloodstock owners), goading the Reserve Bank of Australia to cut rates in “the national interest” and campaigning to have Australians pay GST on items they buy overseas for less than $1000.
Harvey Norman’s first-quarter sales were down 3.8%, as were like-for-like sales. In Australia, like-for-like sales were down 2.8%, in New Zealand down 10.6%, down 8.9% in Slovenia and down 11.1% in Northern Ireland. A stronger currency against the New Zealand dollar, the Euro and the pound has exacerbated the results. Profit before tax – a very important measure to us when estimating intrinsic value – was down by … wait for it, 19.3%!
Harvey Norman claims the strong Australian dollar and the closure of 34 Clive Peeters stores contributed to the poor result. I would argue that a failure to reinvent the offering also contributed. More worryingly, this latter factor is unlikely to go away any time soon.
Compounding this problem is the very likely scenario that the declining iron ore price – recently at about $115 a tonne – will seriously crimp margins for the only sector that has been running at full capacity in this country. Australia’s stock market has become the tail that wags the dog. Its wealth-effect on Australians and the impact on sentiment are important determinants of activity and in particular, retail activity.
With the All Ordinaries index dominated by resource companies and financial services companies it is possible, if not probable, that a declining iron ore price leads to lower stock prices and lower economic activity. I am no economist, but I can understand some experts’ calls for further rate cuts.
Back to Harvey Norman, and like-for-like sales declines of 2.8% compares favourably with JB Hi-Fi’s decline of 3.5%. Indeed, if it became a trend, one would argue Harvey Norman is winning back market share from JB Hi-Fi.
But before you get too excited about this comparison, you have to realise JB Hi-Fi’s profits are higher than they were last year and last year’s profits were higher than the year before that. In Harvey Norman’s case, profits before tax are down 19.3% compared to the same time last year, and last year first-half profits were down 16.5% from the year before that! One retail analyst I know and respect made the point that at this rate Harvey Norman will produce an average profit slightly ahead of the first-half profit made back in 2004, when it generated sales revenue of 62% of today’s sales.
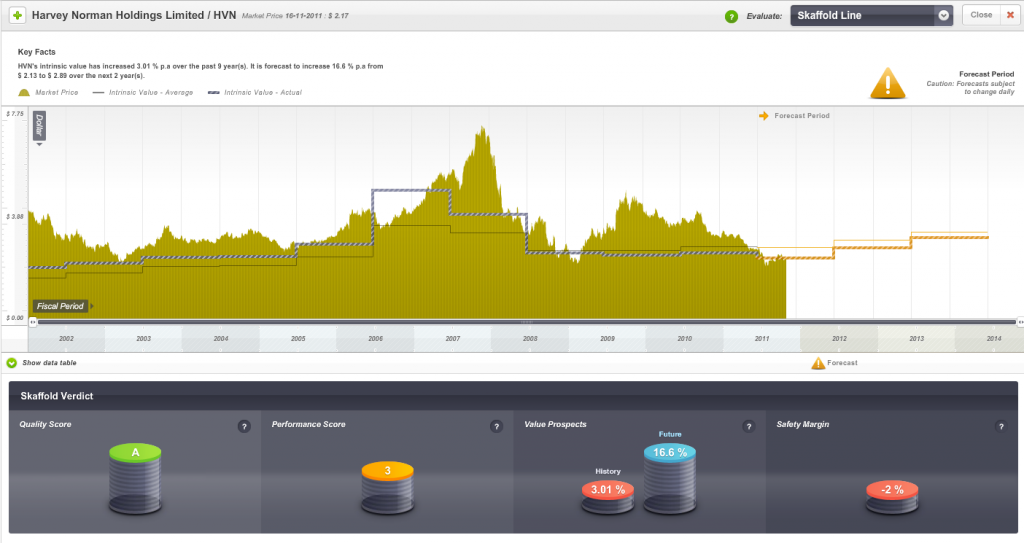
My intrinsic value estimate for Harvey Norman is about $2.00 a share against today’s share price of $2.17. However this is based on earnings per share of 23¢ for 2012 and that is, quite possibly, optimistic. Over the next few weeks, analysts will bring their earnings after tax estimates down for 2012 materially. This will have a negative impact on intrinsic values and I suspect we will discover a price above $2 is a premium to intrinsic value. Most interestingly, for followers of any rational approach to calculating intrinsic value, Harvey Norman’s updated intrinsic value is no higher today than it was nine years ago, in 2003.
This can be seen in the following chart, which plots the share price of Harvey Norman against its estimated intrinsic value. Generally, we look for companies that have a demonstrated track record of rising intrinsic values and are available at a large discount to the current year’s intrinsic value (see 2006 in the graph).
The lack of any real change in intrinsic value and prices (which follow intrinsic value in the long run) reflects the maturation of the business. You can see that in the short run (in 2007 and again in 2009-2011) prices can get ahead of themselves thanks to many factors including irrational exuberance.
In the long run, however, the market’s weighing machine will do its thing and prices generally revert to intrinsic value. That’s why having a rational method for estimating intrinsic value is so important!
The forecast change in intrinsic value may also decline now that Harvey Norman has provided lower guidance. And it’s not unusual for analyst forecasts to be “hockey-stick” optimistic at the commencement of the financial year.
But long-term, Harvey Norman is a mature business in a small country and it continues to swim upstream against the online retailing avalanche. This is a structural shift rather than a short-term trend and Harvey Norman will need to respond by convincing Australian women in mothers’ groups all round the country that it is fresh, new and competitive.
Posted by Roger Montgomery, Value.able author and Fund Manager, 17 November 2011.
by Roger Montgomery Posted in Consumer discretionary, Insightful Insights, Investing Education, Skaffold.
-
Is Australian manufacturing dead, or just in need of a cuddle?
Roger Montgomery
October 13, 2011
With high salaries, higher rents, a strong Aussie dollar and ‘level-playing-field’ policies, are Australian manufacturers being unwillingly and inexorably dragged to doormat status?
We are in a race to the bottom and run the risk of ultimately being chewed up and spat out when our commodities are no longer required with such urgency.
Driven by a belief that economists are right and the way to measure happiness is by the consumption of “stuff”, government policy in Australia is set to keep the masses happy by making that “stuff” as cheap as possible.
Our way of life, and the quality of that life for our kids, is at risk if we continue to be apathetic. Driving around Sydney’s Eastern Suburbs and Lower North Shore, its apparent there isn’t a communal approach to the solution. Instead there is an individual race to accumulate more “stuff” to protect oneself. “Forget about the neighbours”. “Look after number one”. “If I have plenty in the bank, the kids and grandkids will be set up. What do I care if the rest of Australia goes to pot?”
It’s like watching seagulls fighting over a Twistie.
When competing against a country with an ethos that puts ‘the people’ first, what hope does a country whose constituents are clambering over each other for the next short-term dollar have?
Manufacturing in Australia needs help. I am not suggesting protection or a hand out. I am suggesting a leg-up.
Singapore rolls out the red carpet for new businesses with tax-free holidays for the first few hundred thousand in profits. What does the Australian government do for new businesses in Australia? A TAFE course? R&D tax breaks are a start, but helping big business roll out classrooms at $5000 per square metre helped who exactly?
Unemployment in Australia’s wealthiest suburbs is creeping up because we don’t need so many bankers and Merger & Acquisition experts when there aren’t any businesses left to merge and acquire.
Can our current way of life survive without manufacturing? It seems we may just find out. What will we do without manufacturing?
The commodity boom will end one day and we are selling large tracts of arable land to foreign investors. Without manufacturing, will we be running around serving each other lattes? Is that it?
Australia is still the home of ingenuity. Just look at programs like the ABC’s New Inventors. The best and brightest should be receiving generous awards and access to incubator programs that ensure the international success and that the commercial benefits flow back to Australia.
One American recently lamented “10 years ago we had Steve Jobs, Bob Hope and Johnny Cash. Now we have no jobs, no hope and no cash”. If we don’t want to end up in the same place, Australia needs to do more to help incubate, nurture, commercialise and protect our best ideas.
And what are we doing bringing the brightest foreign students into Australia, giving them some of the world’s best education and sharing our IP and then, when they graduate, telling them they cannot work here and sending them home to compete with us?
“Go Australia”? Or “Go, Get Out of Australia”?
We also have some amazing established manufacturing businesses – paint, water heaters, bull bars, truck tippers, caravans, mattresses, wine, beer, pharmaceuticals, chemicals, anoraks, toilets.
The list of those producing attractive products and results is nothing short of A1.
A company that…
1) Has built a brand and or reputation for quality, value or innovation;
2) Is vertically integrated – owning the distribution channel;
3) Is manufacturing a highly specialised or customised product and not competing solely on price;…has a chance to succeed in manufacturing in Australia. And while it’s a shame our government has gradually allowed manufacturing to ‘die’, there are pockets within which Value.able Gradutes can find extraordinary businesses, especially when the market’s manic phase turns to depression.
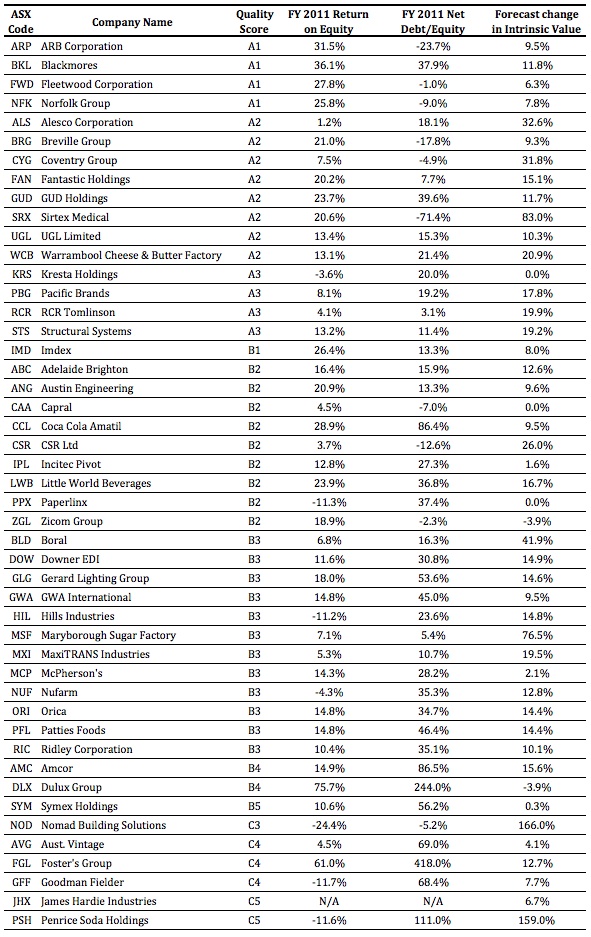
Many of the manufacturers listed in the following table have a long history of operating through a variety of economic conditions. They are ranked from A1 down to C5 – you can immediately see the broad spread of quality. I find looking at the ‘tails’ to be particularly insightful.
While declining in volume, manufacturing in Australia is not dead. Indeed some businesses are positively ‘raking it in’.
Manufacturing is tough and because inflation is always running against a business with a high proportion of fixed assets, smart managerial decisions are constantly required.
Ironically, with so many winds against manufacturers, those that have little or no debt, high rates of return on equity, bright prospects for future growth in intrinsic value and are trading at substantial discounts to current intrinsic value, may just prove to be Value.ablely positioned to leverage a broader economic recovery, locally and globally.
Who’s your top pick for Australia’s best manufacturer? I also want to hear your stories about manufacturing here. Are you a business owner that makes something we should be proud of? How is government policy or a monopoly customer affecting you? What changes need to be made to give Australia a fighting chance?
The universe of great businesses to invest in will inevitably decline unless something is done.
I look forward to your stories. They will be read by the who’s who in banking, management and government, so jot down your thoughts and share your Value.able experiences.
Posted by Roger Montgomery and his A1 team (courtesy of Vocus Communications), fund managers and creators of the next-generation A1 stock market service, 13 October 2011.
by Roger Montgomery Posted in Insightful Insights, Manufacturing, Value.able.
- save this article
- POSTED IN Insightful Insights, Manufacturing, Value.able
-
Which A1 twin is outperforming?
Roger Montgomery
October 6, 2011
 This journey began with the simple question Will David beat Goliath?
Value.able Graduate Scott T resolved to take up a fight with conventional investing, by tracking the performance of a typical and published ‘institutional-style’ portfolio against a portfolio of companies that receive my highest Montgomery Quality Ratings.
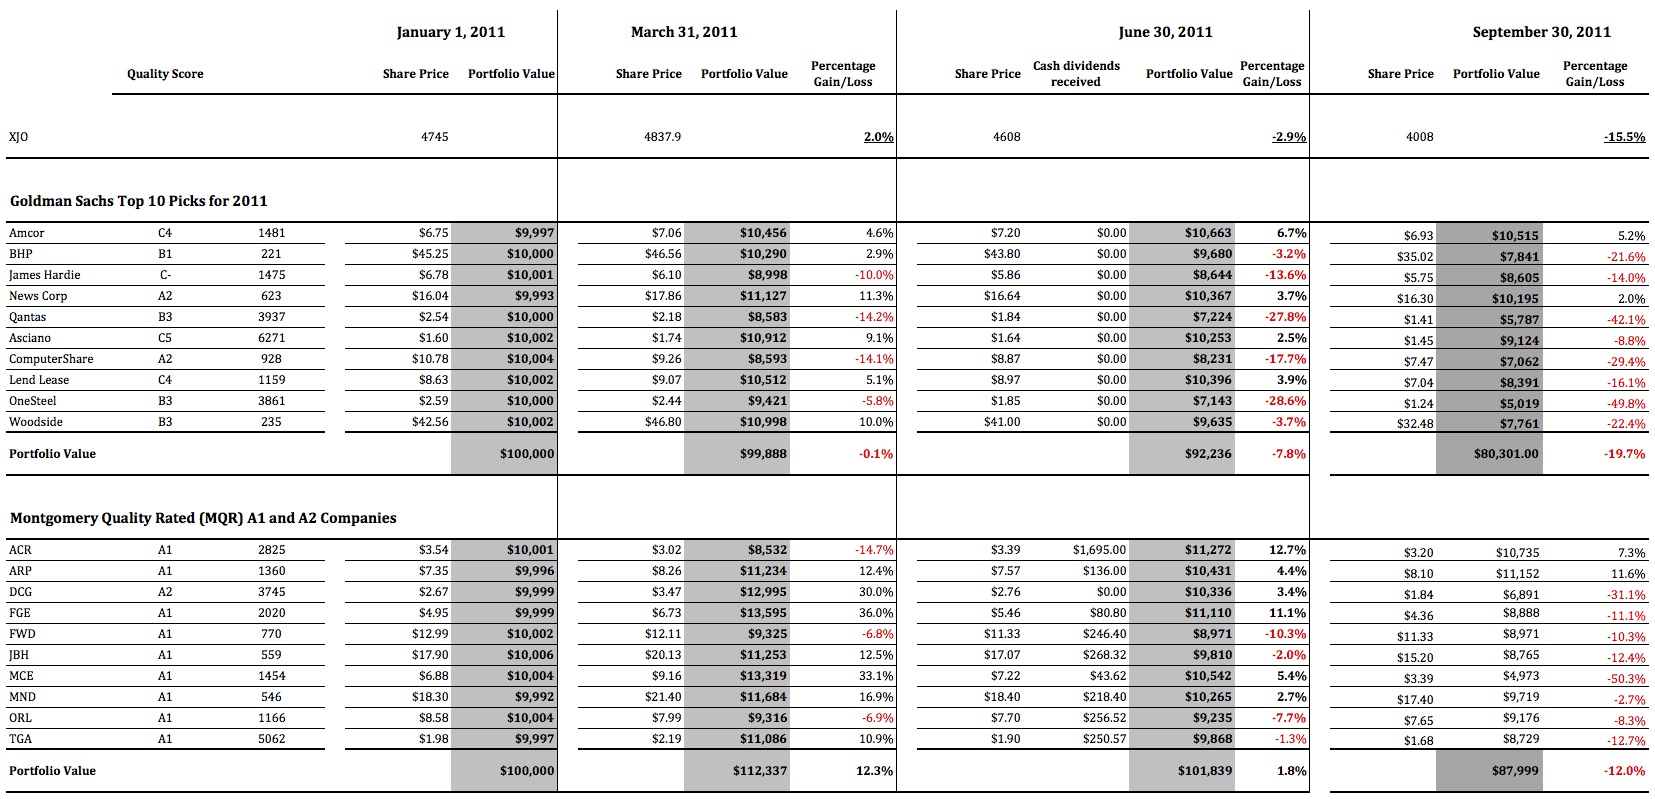
By 30 June 2011 the A1 portfolio was up 1.8 per cent compared to the XJO, which was down 2.9 per cent. As for the conventional ‘institutional’ portfolio, the bankers were down 6.2 per cent.
Over to Scott T for his third quarter update…
“For new readers to Roger Montgomery’s Insights Blog, welcome. Here at Roger’s blog we are conducting a 12-month exercise measuring the performance of a basket of 10 stocks recommended by Goldman Sachs, against a basket of 10 A1 or A2 businesses that were selling for as big a discount to Intrinsic Value as we could find.
“Nine months have now passed since our twin brothers each invested their $100 000 inheritance, and it has been a very turbulent time in the market.
“Our Queensland regional accountant has had his head down at the office for the entire quarter. The end of the financial year had come and gone and hundreds of clients where sending in their tax documentation, calling with questions and chasing their refunds. Time flew by in the office, and he hardly had time to try to attract new clients, let alone watch the daily gyrations of the global equities markets. By the end of September when he was finally able to take a breath and look at the performance of his portfolio.
“He was surprised at how poorly his portfolio of A1 and A2 companies, acquired at prices less than they were worth, had faired. But he quickly realised the overall market had done even worse. Loosing 12 per cent, or $12 000, YTD was bad. But it could have been worse, much worse.
“His twin brother was in a world of pain. The federal department he worked for felt like it was under attack. The mood in the department was that the media seemed hell bent on criticising everything the government did. No initiative was well received and every announcement was instantly compared to last months failure. To top it all off, every night he would check his portfolio, to see how much more of his inheritance had vanished. The red negative number on his spreadsheet just seemed to steadily increase. With little information to go on, and a feeling of helplessness washing over him, he thought seriously about visiting his financial advisors, desperately seeking reassurance, and perhaps changing the mix of the stocks held. He resounded, “Buying what they advised would be good for 2012”.
“As per the first half of the year, dividends will be picked up in the fourth quarter, when shares have finished going ex-dividend and the dividends have actually been received.
“In summary for the nine months to 30 September 2011:
The XJO is DOWN 15.5 per cent
The Goldman Sachs Portfoliois DOWN 19.7 per cent
The A1 and A2 Portfolio is DOWN 12.0 per cent
The A1 and A2 Portfolio has achieved an OUTPERFORMANCE of 3.5 per cent over the XJO and 7.7 per cent over the Goldman Sachs portfolio.“Here are the portfolios in detail, including cash dividends received in the first half (click the image to enlarge)
“We will visit the brothers again at the end of December for a final wrap up of their first year, and discuss their strategies for 2012
“All the Best
Scott T”Thank you Scott.
How is your A1 portfolio performing?
Posted by Roger Montgomery and his A1 team, fund managers and creators of the next-generation A1 stock market service, 6 October 2011.
by Roger Montgomery Posted in Companies, Insightful Insights, Investing Education, Value.able.
-
Are your profits recurring?
Roger Montgomery
September 30, 2011
 With school holidays well and truly underway, plenty of my peers are also taking a few days off here and there to take their kids to the football finals, duck up to the beach or entertain. That offers plenty of time to review your portfolio with recurring profits in mind.
Stability and predictability are two key words that many investors are unlikely to have heard in recent times and two important components of the ‘toolkit’ that may have gone astray. But at all junctures of the business cycle, stability and predictability are helpful investment partners.
Irrespective of whether you are building a portfolio from the ground up or are reviewing your current holdings, it is vital that you ensure your portfolio is always pointed in the right direction. Few, if any are able to reliably and predictability predict short-term share prices so there is relevance, if not necessity, in ensuring the very best opportunity is given to your portfolio. When a recovery transpires and investors are willing to accept risk again, the portfolio constructed from businesses with some stability and predictability to their revenues and earnings streams will have an excellent chance of outperformance.
While there are many definitions of what constitutes ‘stable’ and ‘predictable’, in terms of business analysis, recurring revenue would be the one I would use. And if you built a portfolio of such businesses, would it matter if this week a country defaulted on its debt or another had its credit rating downgraded? These issues are both temporary in nature and only likely to impact share prices, not the economics of the business.
Long-term contracts are the best form of recurring revenues and these contracts take many forms; There are of course the obvious long-term contracts, such as a mobile phone plan, internet or TV subscription, a car lease or a property tenancy, but less obvious are the long-term contracts we have with our own bodies to feed them, clean them and take out the waste. We have a long-term contract with our teeth, our cutlery and our toilets and these contracts ensure Coles and Woolworths, Kelloggs, Procter & Gamble and Kimberley Clark have millions of customers buying their consumables frequently and with monotonous regularity. In other words – recurring revenue.
Knowing that a percentage of revenue can be relied upon to come in the door each year allows a business to budget, rewarded staff consistently and plan expansions with fewer surprises.
And if you are buying a small piece of such a business, you can sleep more comfortably at night ‘knowing’ that your share will always have value even if the share price halves or worse.
The following two businesses are examples of companies we hold in The Montgomery [Private] Fund, and that we believe display the characteristic discussed.
M2 Telecommunications is a reseller of telecommunications equipment and services into the $6 billion SMB Telecommunications market. While dominated by Telstra (ASX:TLS) with 80 per cent market share, M2 is the seventh largest Telco in Australia with a 4.5 per cent share.
Two thirds of the business’s revenue is recurring via traditional fixed voice services, mobile (phone and broadband) and wholesaling services. Typically, contracted revenue is on 2-4 year terms giving management a significant amount of predictability.
It is due to this predictability that management have forecast 15 per cent earnings growth for FY12 and have the ability to self-fund a couple of large acquisitions, which Vaughn Bowen has moved aside from day-to-day duties to focus on.
Credit Corp – With new management installed and a demonstrated focus on transparency and sustainable growth, 70 per cent of collections are now on recurring payment arrangements.
This frees up collection staff to focus on those clients that are finding it harder to repay their liabilities and drives efficiencies across the group. Not only this, but the degree of certainty has allowed management to invest in even more self-funded ledger purchases and forecast earnings of $21m-$23m in FY12.
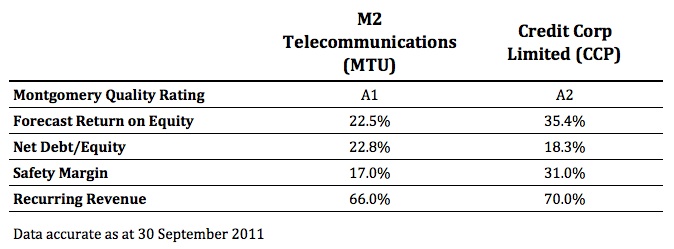
Additionally, the businesses offer the following financial metrics:
High Montgomery Quality Ratings (MQR), high forecast ROE’s, low debt levels, a Safety margin and high, recurring revenues have attracted us. After conducting your own research and seeking and taking personal professional advice, I’d be interested to know whether these companies or any others meet your recurring revenue test.
Go ahead and use this blog post as the beginning of a thread listing companies with solid recurring revenue and earnings.
Given the time to be interested in stocks is when no one else is, now is the time to go through your portfolio and determine those holdings that have a component of revenues that are recurring.
Posted by Roger Montgomery and his A1 team, fund managers and creators of the next-generation A1 stock market service, 30 September 2011.
by Roger Montgomery Posted in Insightful Insights, Investing Education, Value.able.
-
Should you be readying yourself?
Roger Montgomery
September 23, 2011
 If you’re sitting at home or in your office wondering if the party is over and it’s all turned to pumpkins and mice, allow me to offer you a few insights.
I know of seasoned market practitioners that have deferred the upping of stumps to set up new businesses because they believe there is worse to come. I also know of prominent Australians that are cashing up and I have met with many professional investors who liken the current conditions to those preceding a severe recession or even depression. Berkshire Hathaway shares are trading below $100,000 for the first time in a while (not that it matters). And Bill Gross at Pimco reckons the fact that you can get a better yield over two years by ‘barbelling’ – putting 10 per cent into 30 year bonds and 90 per cent into cash – and beat the yield on 2yr T-Notes is destroying credit creation and so low yields are having the opposite effect to the stimulation they are intended to generate.
Ok. So what do I think?
These are the times to prepare yourself for the possibility of another rare opportunity to buy extraordinary businesses at even more extraordinary discounts to intrinsic value. You have to be ready, you have to have your Value.able intrinsic valuations prepared and your preferred safety margins calculated.
In the short term (6-12 months), on balance, I think shares could get even cheaper (As I write those words, I log on to see the European markets down five per cent and the Dow Jones opening down more than 3 per cent and I am conscious of the fact that an outlook can be tainted by the most recent price direction). But our large cash proportion/position in The Montgomery [Private] Fund since the start of the calendar year has reflected for some time the impact of this possibility on future valuations and our requirement for larger discounts to intrinsic value.
Longer term, I like some of the research put out by McKinsey. The new infrastructure, such as roads, ports, railways and terminals that developing countries such as China, India and South America will need, will require tens of trillions of dollars. McKinsey Global Institute analysis reckons that by 2030 the supply of capital could fall short of demand to the tune of $2.4 trillion – a credit crunch that will slow global GDP growth by a percentage point annually. Even if China and India cool off, a similar gap could occur.
Back to the immediate outlook and there is a simple mental framework that I have been using to think independently about all the ructions impacting our portfolios.
I am no economist, but its pretty easy to see that if trend line US economic growth is barely 1 per cent, then any slowdown in the business cycle will push the economy towards the zero growth line. One per cent is quite simply very close to zero and the business cycle can push growth rates around more than the difference between them. Every time there is a whiff of a slowdown, there will, at the very least ,be fears of another recession. Again, I am not forecasting a recession nor am I forecasting slow growth. Indeed, I am not forecasting at all. I am simply pointing out the fact that tiptoeing on the edge of a precipice (the US at 1 per cent growth) is more frightening than doing circle work in a paddock a long way from any edge at all (China at 7, 8 or 9 per cent growth). Bill Gross’s comments about the destruction of credit further feeds the idea of a slowdown.
On balance I believe there will be some very attractive buying opportunities in the next six to twelve months. Before you read too much into this statement, I should alert you to the fact that I say it every year.
Analysts are prone to optimism too.
I think it’s also appropriate to remember that analysts typically are generally optimistic about earnings forecasts at the start of a financial year. This can be seen in another McKinsey research note (as well as thousands of other similar studies), where analysts commented:
“No executive would dispute that analysts’ forecasts serve as an important benchmark of the current and future health of companies. To better understand their accuracy, we undertook research nearly a decade ago that produced sobering results. Analysts, we found, were typically overoptimistic, slow to revise their forecasts to reflect new economic conditions, and prone to making increasingly inaccurate forecasts when economic growth declined.
Alas, a recently completed update of our work only reinforces this view—despite a series of rules and regulations, dating to the last decade, that were intended to improve the quality of the analysts’ long-term earnings forecasts, restore investor confidence in them, and prevent conflicts of interest. For executives, many of whom go to great lengths to satisfy Wall Street’s expectations in their financial reporting and long-term strategic moves, this is a cautionary tale worth remembering.”
And concluded: “McKinsey research shows that equity analysts have been overoptimistic for the past quarter century: on average, their earnings-growth estimates—ranging from 10 to 12 percent annually, compared with actual growth of 6 percent—were almost 100 percent too high. Only in years of strong growth, such as 2003 to 2006, when actual earnings caught up with earlier predictions, do these forecasts hit the mark.”
Demand bigger discounts
Those thoughts provide the ‘Skaffolding‘ in my mind around which I construct an opinion of where the landmines and risks may be for an investor. I tend to 1) look for much bigger discounts to intrinsic values that are based on analyst projections for earnings and 2) lower our own earnings expectations for those companies we like best.
Cochlear is one example of this. Many analysts have forecast a 10-20 per cent NPAT decline from the recent recall of their Cochlear implant. Only one analyst has considered and forecast a 40-50 per cent NPAT decline. The truth will probably be somewhere in between. Such a decline however would come as a shock to many investors if it were to transpire. And so it is important to be aware of that possibility when calibrating the size of any position in your portfolio. In other words, be sure to have some cash available for such an event because intrinsic value based under that scenario is between $23 and $30.
Your “Top 5”
Earlier this month I asked you to list your “Top 5” value stocks – those that you believed represented good value at present. I was delighted to receive so many contributions.
On behalf of the many Value.able Graduates and stock market investors who read our Insights blog thank you for sharing with us the result of all your fossicking, digging and analysis.
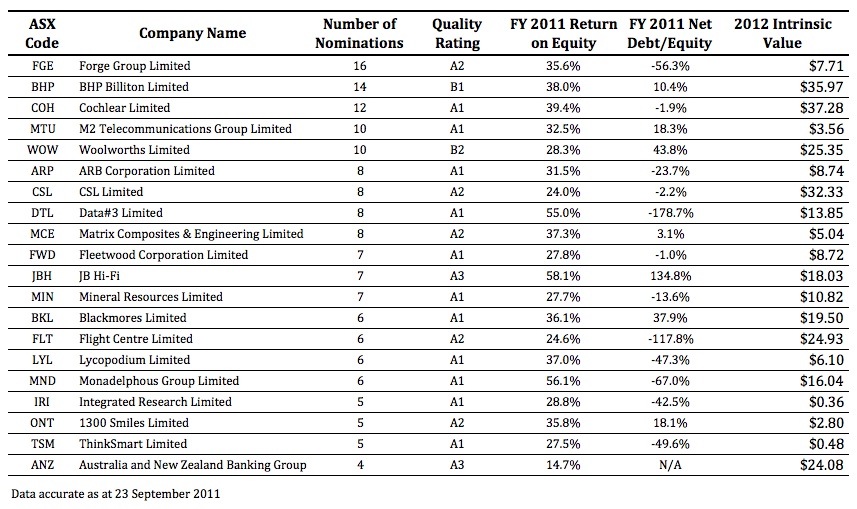
There were more than 115 suggestions. The most popular was Forge Group with 16 mentions.
The following table presents the Quality Score, FY2011 ROE, FY2011 Net Debt/Equity and 2012 Value.able Intrinsic Value for Forge Group (FGE), BHP, Cochlear (COH), M2 Telecommunications (MTU), Woolworths (WOW), ARB Corp (ARP), CSL , Data#3 (DTL), Matrix (MCE), Fleetwood (FWD), JB Hi-Fi (JBH), Mineral Resources (MIN), Blackmores (BKL), Flight Centre (FLT), Lycopodium (LYL), Monadelphous (MDN), Integrated Research (IRI), 1300 Smiles (ONT), ThinkSmart (TSM) and ANZ.
As you know these quality scores and the estimates for intrinsic values can change at a moments notice (just ask those working at Cochlear!) so be sure to conduct your own research into these and any company you are considering investing in and as I always say, be sure to seek and take personal professional advice.
Posted by Roger Montgomery and his A1 team, fund managers and creators of the next-generation A1 stock market service, 23 September 2011.
by Roger Montgomery Posted in Companies, Insightful Insights, Investing Education, Market Valuation.
-
Have you truly made up YOUR mind?
Roger Montgomery
September 23, 2011
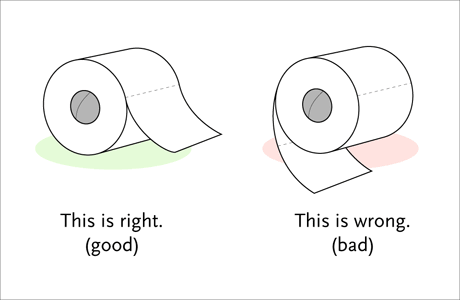 I’m always looking for Value.able contributions that will enahnce the value of our Insights blog.
Scott’s comparison of the performance of a Value.able A1 portfolio and a conventional portfolio promoted by a large bank over the last six months is one such example. Nick’s contribution here about independent thinking is another. Take it away Nick…
“Most people would rather die than think, in fact they do so.” Bertrand Russell
The title of this post which Roger has kindly let me write for his blog may seem like such elementary and common sense advice that it need not be written at all – kind of like telling a friend to make sure he looks both ways before crossing the freeway.
Is thinking independently when it comes to investing really so obvious? And do people practice it consistently? I would say not. Just because something is obvious does not mean it will be practiced and not thinking independently, by which I mean not thinking for yourself and making up your own mind on an issue (not necessarily having a contrary opinion for the sake of having a contrary opinion), is one of the surest ways to destroy wealth and end up dissatisfied as an investor (aside from the strong likelihood of losing money you will also lack autonomy over your future). I have made this mistake in the past and can speak from experience.
Ben Graham once said “You are neither right nor wrong because the crowd disagrees with you. You are right because your data and reasoning are right.”
And in the 1985 Berkshire Hathaway Annual Letter to Shareholders, Warren Buffett shares with his readers this story passed down from Ben Graham which illustrates the lemming-like behaviour of the crowd: “Let me tell you the story of the oil prospector who met St. Peter at the Pearly Gates. When told his occupation, St. Peter said, “Oh, I’m really sorry. You seem to meet all the tests to get into heaven. But we’ve got a terrible problem. See that pen over there? That’s where we keep the oil prospectors waiting to get into heaven. And it’s filled – we haven’t got room for even one more.” The oil prospector thought for a minute and said, “Would you mind if I just said four words to those folks?” “I can’t see any harm in that,” said St. Pete. So the old-timer cupped his hands and yelled out, “Oil discovered in hell!”. Immediately, the oil prospectors wrenched the lock off the door of the pen and out they flew, flapping their wings as hard as they could for the lower regions. “You know, that’s a pretty good trick,” St. Pete said. “Move in. The place is yours. You’ve got plenty of room.” The old fellow scratched his head and said, “No. If you don’t mind, I think I’ll go along with the rest of ’em. There may be some truth to that rumour after all.”
This is not the fate you want for yourself!
And don’t let hubris get in the way. Intelligence alone will not keep you away from the dangers of crowd behavior and emotion. One of history’s most gifted minds and scientists, Sir Isaac Newton, was caught up in the emotion and chaos of crowd behavior which resulted in him losing his fortune in the South Sea Shipping Company Bubble. Sir Isaac Newton had previously made a packet on this very same company although after selling and watching the share price continually keep rising, he reinvested everything he had before the crash. For as long as he lived he forbid the words South Sea Shipping Company to ever be mentioned in his presence. It was not a lack of intelligence which brought Sir Isaac unstuck, it was, I argue, his lack of independent thought on the merits of the South Sea Shipping Company as a suitable investment.
“An investment operation is one which, upon thorough analysis, promises safety of principal and an adequate return. Operations not meeting these requirements are speculative.” Ben Graham.
Once you have determined to think independently and make up your own mind on a company’s current strengths and weaknesses, and its current and future earnings prospects, how do you best do this? Perhaps the most effective way is to follow the advice of the famous algebraist Carl Jacobi who said ‘Invert, always invert.’ So if from your reading you believe company XYZ to be possible investment material (either from Roger’s blog, the newspaper, a friend, your stockbroker) read everything you can and formulate as strong a case as you can on why it would make a lousy investment. If, after having made as strong a case against the company as the information allows, it still looks pretty good and is selling at an attractive price, then it is worthy of further consideration. It has also been useful to me in the past having friends help me out with this. Usually before making an investment I’ll ask my most intelligent and able friends for their opinion on why I shouldn’t invest in company XYZ. This will not mean that you’ll never make a mistake again, although when you do at least you’ll be able to understand why (having studied the reasons against making the decision in the first place).
“I want to be able to explain my mistakes. This means I do only the things I completely understand.” Warren Buffet
Charlie Munger, in a speech given at USC (which you can all view on YouTube) says “I have what I call an iron prescription that helps me keep sane when I naturally drift to preferring one ideology over another and that is I say I am not entitled to have an opinion on this subject unless I can state the arguments against my position better than the people who are supporting it.” This is great advice, and to tailor it to investing all you need to do is replace the word ‘subject’ with ‘company.’
Charlie Munger also likes to talk about the importance of having a latticework of mental models in your head and how the big ideas from across a broad range of disciplines can often be used in sync to best analyse a particular problem. I won’t expand on this now, although can recommend his speeches and essays which are easily available on the internet.
Having a great interest in investing, I find this blog is a wonderful source of ideas and learning and really enjoy reading the comments written every day. That said, one way in which I believe it could be improved is for there to be more argument and questioning, something which is happening more and more as the share price of recent blog favorites has dropped. If someone says they believe XYZ to be a great quality company without providing reasons they should be held to account and asked why? If the only response is that Roger has it as an A1 then a fail grade would be mandatory. If someone says they believe that company XYZ has excellent earnings prospects they should again be asked why? And if their response is that the analysts consensus on Comsec says so then again, another F.
I hope that this post may have been of some interest and if you have some stories of success as a result of independent thinking, I would be very interested in reading them.
Nick Mason
Roger’s Note: And if you have a similarly lucid and instructive idea that you would like share here at our Insights blog, go ahead and submit. Not every contribution can be published as a post, but we will certainly post those we like.
Posted by Roger Montgomery and his A1 team, fund managers and creators of the next-generation A1 stock market service, 23 September 2011.
by Roger Montgomery Posted in Insightful Insights, Investing Education, Value.able.
-
How much capital intensity does it take to sell seats?
Roger Montgomery
August 30, 2011
 Did you know some of Qantas’ planes are more than twenty years old? And our estimate is that they fly, on average, 14 hours per day. The rest of the time they mimic that expensive bit of fashion in your garage, earning no income. That garage/hangar time has expensive ramifications for the economics of airlines, just as your decision to buy an expensive but garaged ‘fashion’ item has expensive ramifications for you.
Capital-intensive businesses, such as airlines, erode shareholder wealth. Inflation ensures their maintenance and replacement is a significant proportion of cash flow, which could otherwise be paid out to shareholders. Parts plus labour, which protect the business assets from wear and tear, actually causes wear and tear on shareholders’ funds.
Raising capital and increasing debt, has hitherto been easy for Qantas, but the market is slowly coming to the realisation that it cannot continue. The market capitalisation of Qantas – the ‘value’ the market ascribes – is less than all the equity that the company has raised – much less.
As a result of the market’s slow migration to understanding the economics of airlines, fresh management have had to respond quickly.
The best measure of economic performance is Return on Equity (ROE). This year QAN achieved a ROE of just over four per cent. Meanwhile, Oroton shareholders have been enjoying eighty per cent returns. Did you know there are 267 companies that earn more than 15 per cent returns on equity?
The business of selling seats is an expensive one for Qantas, and while the business of selling the hope-of-getting-a-seat (the Frequent Flyer program) is extremely profitable, owning planes means the cash is always inhibited – it can’t be distributed to shareholder owners.
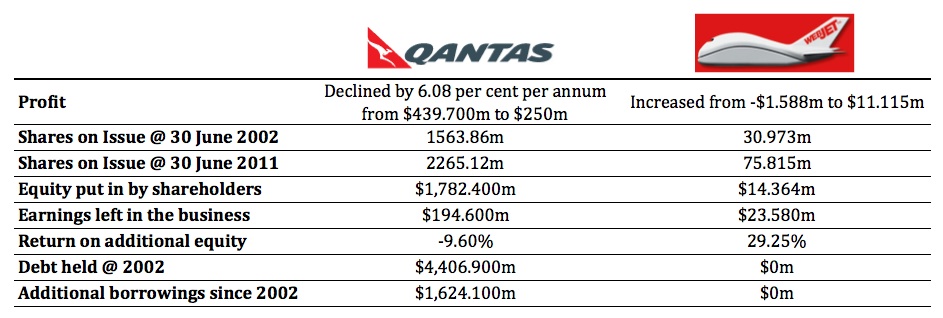
Qantas however isn’t the only seller of seats on planes. Indeed there are businesses that sell seats on planes and they don’t have any planes. Let’s compare two seat-sellers: Qantas and Webjet.
I believe the very best businesses online are lists – lists of jobs, lists of apps, lists of songs, lists of cars, lists of houses, list of flights and lists of seats. What is particularly attractive is that a business with a list of seats doesn’t have any planes. Sure its revenue is going to be lower, but what about its profit?
Let’s compare…
Now, lets take a look the economics of these businesses over the past ten years.
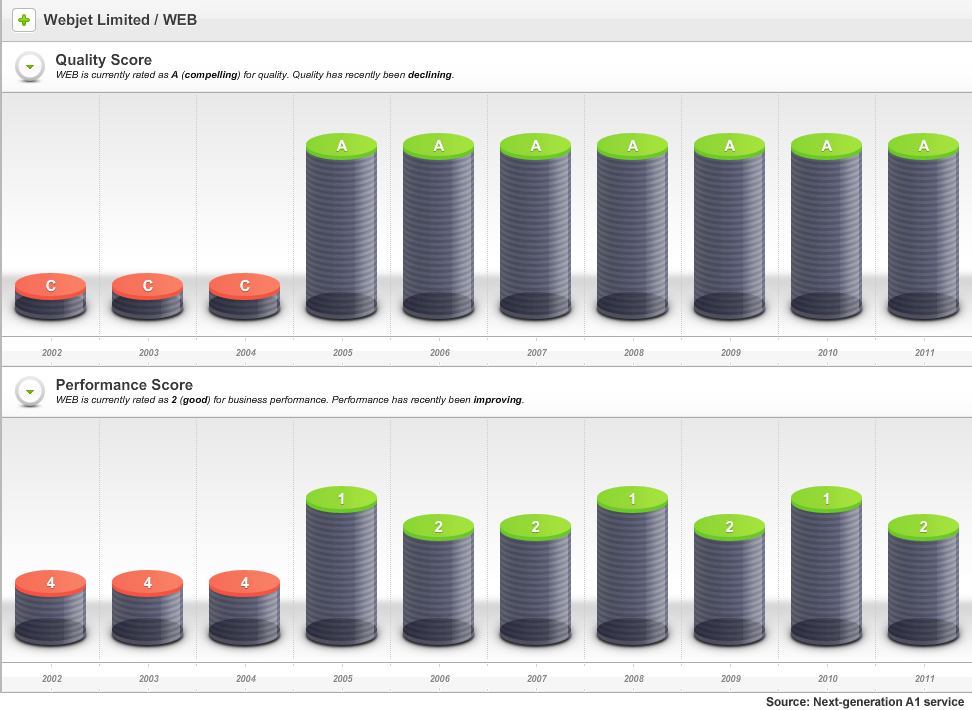
As the following sneek peek charts from our soon-to-be-released next-generation A1 stock market service display, Webjet has scored, on average, an A2 since 2005.
In this example, the Quality Score information tells us that something dramatic happened in the 2004/2005 financial year.
Webjet was once called Roper River Resources Company and in July 1999 the shares, under the ASX code; RRR, were trading at 25 cents. By March 2000 – near the peak of the internet bubble – RRR shares were trading at $1.38.
The reason is now obvious, although at the time it may have been a bit of a mystery.
In January 2000, Roper received a ‘speeding ticket’ from the ASX to which it responded on 14 January with the following statement:
“1. There are no, matters of importance, about to be released to the market.
“2. The Company is not aware of any information to explain the recent trading in the shares.
“3. The Company can offer no other explanation for the price change and increase in volume in the securities of the Company.”
“4. I confirm that the Company is in compliance with the listing rules, in particular, listing rule 3.1.”
On 27 January 2000 however – less than two weeks later – Roper River Resources (ASX:RRR) announced it was issuing 50 million shares to acquire Webjet Pty Ltd.
By June 2004 the shares were still trading at 15 cents, however the company announced the previous October that it was trading in the black for the first time. By November 2004, it was reporting 400 per cent monthly increases in sales. Almost every month to its full year results in June 2005, it continued to report 400 plus percentage increases in monthly sales.
And in that year Webjet’s Quality Score jumped from C4 to A1. As you can see, Webjet has maintained an A1 or A2 quality rating since.
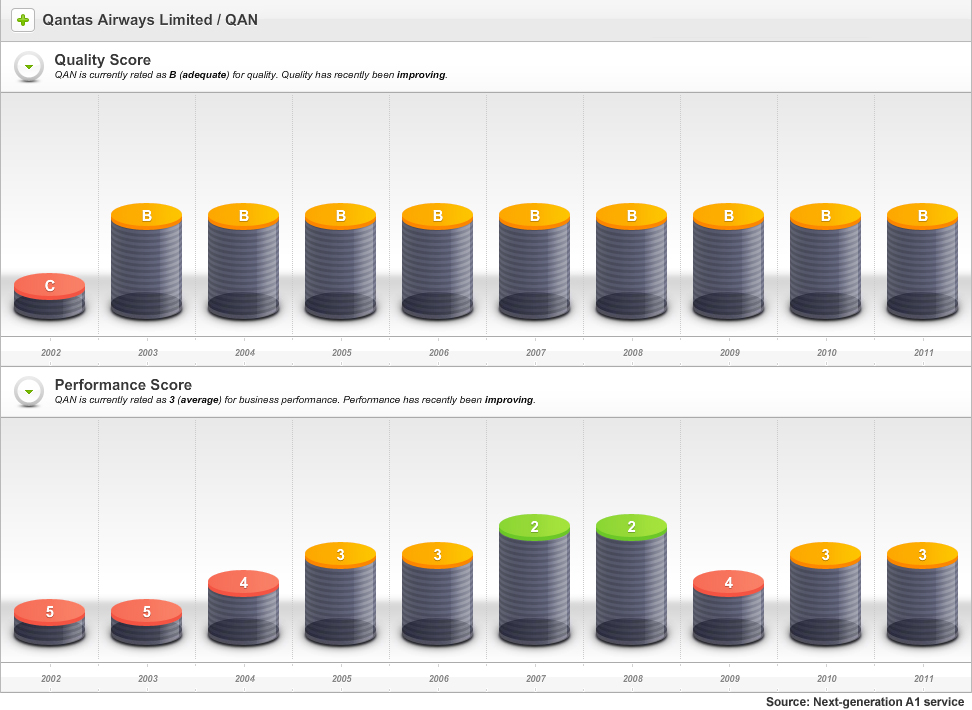
By comparison, Qantas’s Quality Score profile has been more marginal. This should be unsurprising to many, if not most Value.able Graduates, who understand the downside of capital intensity. Lots of property plant and equipment results in more equity for a given profit, and that means lower returns.
So, what do you think?
With reporting season about to end, your mission, if you choose to accept it, is:
Source the latest Annual Report for each business in your portfolio. Go to the Balance Sheet and under ‘Non-Current Assets’ find ‘Property, Plant and Equipment’.
If you have any, how many capital-intensive businesses are hiding in your portfolio?
Making this process simple and easy is something we have been working on for you. We created our next-generation A1 service because we wanted to make finding extraordinary companies offering large safety margins easy. And, of course we love investing. The above graphics are just one
It’s an A1 service that is like nothing you have ever seen before.value
Value.able Graduates – your invitation to pre-register is coming soon.
If you haven’t graduated to guarantee your invitation, click here to order your copy of Value.able immediately. Once you have 1. Read Value.able and 2. changed some part of the way you think about the stock market, my team and I will be delighted to officially welcome you as a Graduate of the Class of 2011 (and invite you to become a founding member of our soon-to-be-released next-generation A1 service).
Posted by Roger Montgomery and his A1 team, fund managers and creators of the ext-generation A1 stock market service, 30 August 2011.
by Roger Montgomery Posted in Airlines, Companies, Insightful Insights, Value.able.
-
What has probing the reporting season avalanche revealed?
Roger Montgomery
August 24, 2011
With reporting season in full swing, I would like to share my insights into whose Quality Score has improved, and whose has deteriorated. Remember, none of this represents recommendations. It is intended to be educational only. You must seek and take personal professional advice before acting or transacting in any security.
To date, 232 companies have reported their annual results. I am sure you can understand why we feel snowed under. With almost 2,000 companies listed on the ASX, the avalanche still has a way to roll.
We have updated all of our models for each of the 164 companies that we are interested in. As you know, we rank all listed companies from A1 down to C5. The inputs for those rankings always come from the company themselves. I would hate to think how bipolar they would be if we allowed our emotions and personal preferences to infect those ratings (or be swayed by analyst forecasts)!
Rather than arbitrary and subjective assessments, we download some 50-70 Profit and Loss, Balance Sheet and Cash Flow data fields from each annual report to populate five templates. All of these templates employ industry specific metrics to calculate the Quality Scores. This allows us to rank every ASX-listed business from A1 – C5. Its our objective way to sort the wheat from the chaff.
For Value.able Graduates not familiar with our scoring system, company’s that achieve an A1 Score are those we believe to be the best businesses, and the safest. C5s are the poorest performers and carry the highest risk of a possible catastrophic event.
A1 does not mean nothing bad will ever befall a company. A1 simply means to us that it has the lowest probability of something permanently catastrophic. Further, ‘lowest probability’ doesn’t mean ‘never’. A hundred-to-one horse can still win races, even though the probability is low. Similarly, an A1 business can experience a permanently fatal event. In aggregate however, we expect a portfolio of A1 businesses to outperform, over a long period of time, a portfolio of companies with lesser scores.
With that in mind, we are of course most interested in the A1s and – on a declining scale – A2, B1 and B2 businesses.
So, who has managed to retain their A1 status this reporting season? And which businesses have achieved the coveted A1 status? If you hold shares in any of the companies whose scores have declined (based of course on their reported results), please read on.
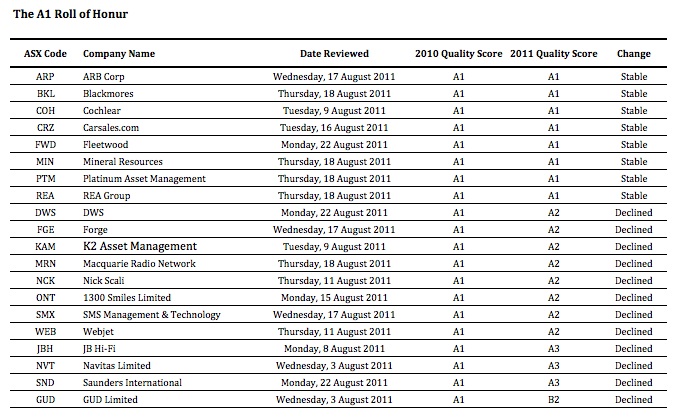
Of the companies that have reported so far, last year 20 of them were A1s, 28 were A2s, one was a B1 and 13 scored B2. That’s an encouraging proportion, although we tend to discover each reporting season that the better quality businesses and the better performing businesses are generally keen to get their results out into the public domain early.
Its towards the end of every reporting season where the quality of the businesses really drops off. This is always something to watch out for – companies trying to hide amongst the many hundreds reporting at the end of the season. It’s always a good idea to turn up to a big fancy dress party late, if you aren’t in fancy dress.
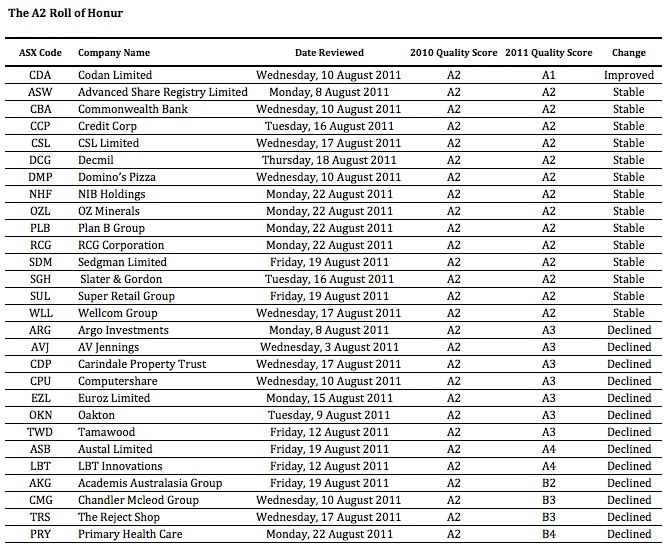
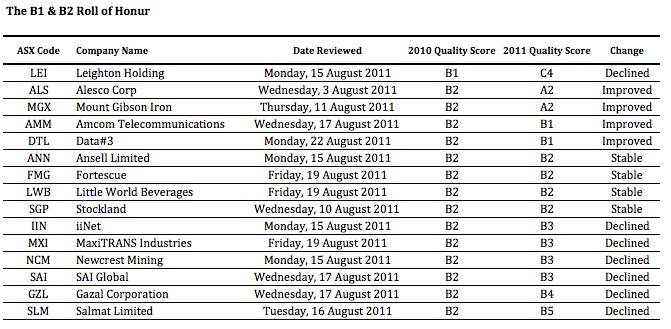
This year we have seen the number of existing A1s fall to nine from 20, A2s from 28 to 24, B1s rise from one to two and B2s fall from 13 to six.
The first table shows all twenty 2009/2010 A1 companies that have reported to date. You’ll see a number of very familiar names in here, including ARB Corp (ARP), Blackmores (BKL), Cochlear (COH), Carsales.com (CRZ), Fleetwood (FWD), Mineral Resources (MIN), Platinum Asset Management (PTM), REA Group (REA), DWS (DWS), Forge (FGE), K2 Asset Management (KAM), Macquarie Radio Network (MRN), Nick Scali (NCK), 1300 Smiles Limited (ONT), SMS Management & Technology (SMX), Webjet (WEB), JB Hi-Fi (JBH), Navitas Limited (NVT), Saunders International (SND) and GUD Limited (GUD). Nine have maintained their A1 rating this year.
Now, before you go jumping up and down, a drop from A1 to A2 is like downgrading from Rolls Royce to Bently. When we talk about A2s, its not a drop from RR Phantom to a Ford Cortina, not that there’s anything wrong with the old Cortina (if you are too young to know what I am talking about Google it!).
The only big rating decline is GUD Holdings, which made a large acquisition (Dexion) during the year. Indeed, a common theme amongst the higher quality and cashed up businesses this reporting season has been the deployment of that cash towards, for example, acquisition or buybacks (think JB Hi-Fi).
Moving onto the 2009/2010 A2 honour roll: Codan Limited (CDN), Advanced Share Registry Limited (ASW), Commonwealth Bank (CBA), Credit Corp (CCP), CSL Limited (CSL), Decmil (DCG), Domino’s Pizza (DMP), NIB Holdings (NHF), OZ Minerals (OZL), Plan B Group (PLB), RCG Corporation (RCG), Sedgman Limited (SDM), Slater & Gordon (SGH), Super Retail Group (SUL), Wellcom Group (WLL), Argo Investments (ARG), AV Jennings (AVJ), Carindale Property Trust (CDP), Computershare (CPU), Euroz Limited (EZL), Oakton (OKN), Tamawood (TWD), Austal Limited (ASB), LBT Innovations (LBT), Academis Australasia Group (AKG), Chandler Mcleod Group (CMG), The Reject Shop (TRS) and Primary Health Care (PRY).
The businesses that make up this list showed slightly more stability. The biggest fall in quality this year was Primary Healthcare (PRY),which is still struggling to digest the large purchases it made a few years ago. The Reject Shop (TRS) also declined, to B3. TRS is still investment grade and we would lean towards believing this is a short-term decline, given the floods in QLD that caused the complete shutdown of their new distribution center and the massive disruptions subsequently caused. As the company said, you can’t sell what you haven’t got!
Finally, B1 and B2 companies: Leighton Holdings (LEI), Alesco Corp (ALS), Mount Gibson Iron (MGX), Amcom Telecommunications (AMM), Data#3 (DTL), Ansell Limited (ANN), Fortescue (FMG), Little World Beverages (LWB), Stockland (SGP), iiNet (IIN), MaxiTRANS Industries (MXI), Newcrest Mining (NCM), SAI Global (SAI), Gazal Corporation (GZL) and Salmat (SLM).
About half the companies in the B1/B2 list retained or improved their ratings from last year. Mind you, half also saw their rating decline!
The clear fall from grace is Leighton Holdings, whose problems have been well documented in the media and via company presentations.But once again, like The Reject Shop, this could be a temporary situation. If the forecast $650m profit comes through, I expect LEI’s quality score will improve. What the dip will do, however, is remain a permanent reminder that Leighton is a cyclical business. Getting the quote right on a job is important, even more a massive enterprise like Leightons.
Are you surprised by any of the changes? We certainly were!
Sticking to quality is vitally important. That’s what my team and I do here at Montgomery Inc, and its what our amazing next-generation A1 service is all about. Value.able Graduates – your invitation is pending.
If you are yet to join the Graduate Class, click here to order your copy of Value.able immediately. Once you have 1. read Value.able and 2. changed some part of the way you think about the stock market, my team and I will be delighted to officially welcome you as a Graduate of the Class of 2011 (and invite you to become a founding member of our soon-to-be-released next-generation A1 service).
Remember, you must do your own research and remember to seek and take personal professional advice.
We look forward to reading your insights and will provide another reporting season update soon.
Posted by Roger Montgomery and his A1 team, fund managers and creators of the next-generation A1 service for stock market investors, 24 August 2011.
by Roger Montgomery Posted in Companies, Insightful Insights, Investing Education, Value.able.
