Consumer discretionary
-
Is it just Harvey Norman or bricks & mortar retailing generally?
Roger Montgomery
November 17, 2011
You don’t normally expect to get investment tips from a mothers’ group get-together, but that’s what happened to me recently when the conversation turned to retail operations.
Relaxing with a glass of pinot gris the women, who have met regularly for a decade, were explaining why they spend less time in Harvey Norman stores than they used to. Why? Tired stores, tired layouts and uncompetitive prices have served the retailer only with the need to revamp its entire offering. And that, it hasn’t done.
Retailing in Australia has been in the eye of a perfect storm for some time. As I’ve written previously, the strong Australian dollar has encouraged overseas travel and online purchases from overseas businesses; and the two-speed economy has ensured that credit growth (the borrowing of more money to buy stuff) is muted.
I’ve always been suspicious of a company that issues a report to the market after the close of trade. On Monday 31 October, a major retail business in Australia did just that. After closing time, Harvey Norman released its sales and earnings for the first quarter of the 2012 financial year. Given its timing, the announcement was almost certain to be negative. Indeed, the stock fell 4% the next day.
Instead of focusing on the retailing offer, refreshing store designs and improving range, company representatives focus on property, horse racing (Gerry Harvey is one of the country’s biggest bloodstock owners), goading the Reserve Bank of Australia to cut rates in “the national interest” and campaigning to have Australians pay GST on items they buy overseas for less than $1000.
Harvey Norman’s first-quarter sales were down 3.8%, as were like-for-like sales. In Australia, like-for-like sales were down 2.8%, in New Zealand down 10.6%, down 8.9% in Slovenia and down 11.1% in Northern Ireland. A stronger currency against the New Zealand dollar, the Euro and the pound has exacerbated the results. Profit before tax – a very important measure to us when estimating intrinsic value – was down by … wait for it, 19.3%!
Harvey Norman claims the strong Australian dollar and the closure of 34 Clive Peeters stores contributed to the poor result. I would argue that a failure to reinvent the offering also contributed. More worryingly, this latter factor is unlikely to go away any time soon.
Compounding this problem is the very likely scenario that the declining iron ore price – recently at about $115 a tonne – will seriously crimp margins for the only sector that has been running at full capacity in this country. Australia’s stock market has become the tail that wags the dog. Its wealth-effect on Australians and the impact on sentiment are important determinants of activity and in particular, retail activity.
With the All Ordinaries index dominated by resource companies and financial services companies it is possible, if not probable, that a declining iron ore price leads to lower stock prices and lower economic activity. I am no economist, but I can understand some experts’ calls for further rate cuts.
Back to Harvey Norman, and like-for-like sales declines of 2.8% compares favourably with JB Hi-Fi’s decline of 3.5%. Indeed, if it became a trend, one would argue Harvey Norman is winning back market share from JB Hi-Fi.
But before you get too excited about this comparison, you have to realise JB Hi-Fi’s profits are higher than they were last year and last year’s profits were higher than the year before that. In Harvey Norman’s case, profits before tax are down 19.3% compared to the same time last year, and last year first-half profits were down 16.5% from the year before that! One retail analyst I know and respect made the point that at this rate Harvey Norman will produce an average profit slightly ahead of the first-half profit made back in 2004, when it generated sales revenue of 62% of today’s sales.
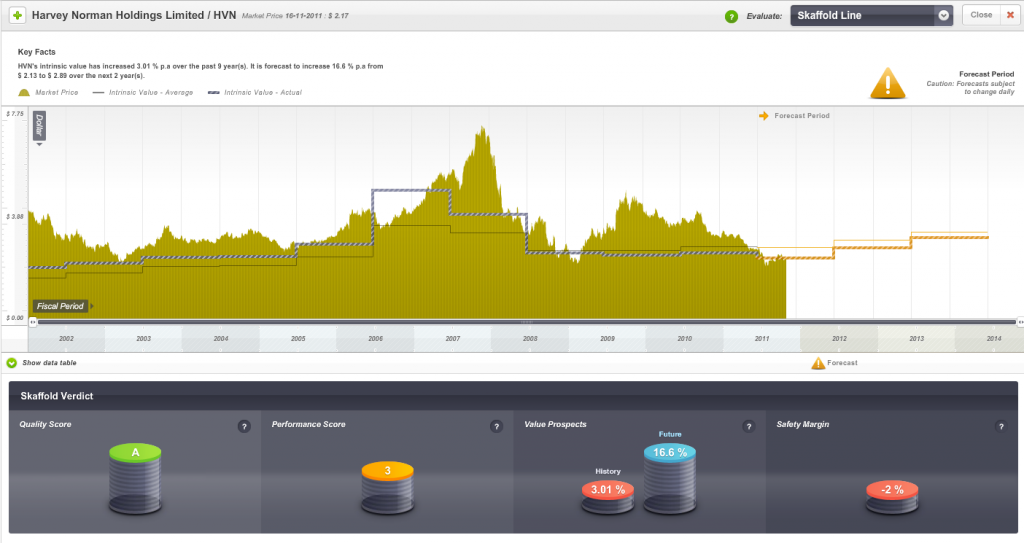
My intrinsic value estimate for Harvey Norman is about $2.00 a share against today’s share price of $2.17. However this is based on earnings per share of 23¢ for 2012 and that is, quite possibly, optimistic. Over the next few weeks, analysts will bring their earnings after tax estimates down for 2012 materially. This will have a negative impact on intrinsic values and I suspect we will discover a price above $2 is a premium to intrinsic value. Most interestingly, for followers of any rational approach to calculating intrinsic value, Harvey Norman’s updated intrinsic value is no higher today than it was nine years ago, in 2003.
This can be seen in the following chart, which plots the share price of Harvey Norman against its estimated intrinsic value. Generally, we look for companies that have a demonstrated track record of rising intrinsic values and are available at a large discount to the current year’s intrinsic value (see 2006 in the graph).
The lack of any real change in intrinsic value and prices (which follow intrinsic value in the long run) reflects the maturation of the business. You can see that in the short run (in 2007 and again in 2009-2011) prices can get ahead of themselves thanks to many factors including irrational exuberance.
In the long run, however, the market’s weighing machine will do its thing and prices generally revert to intrinsic value. That’s why having a rational method for estimating intrinsic value is so important!
The forecast change in intrinsic value may also decline now that Harvey Norman has provided lower guidance. And it’s not unusual for analyst forecasts to be “hockey-stick” optimistic at the commencement of the financial year.
But long-term, Harvey Norman is a mature business in a small country and it continues to swim upstream against the online retailing avalanche. This is a structural shift rather than a short-term trend and Harvey Norman will need to respond by convincing Australian women in mothers’ groups all round the country that it is fresh, new and competitive.
Posted by Roger Montgomery, Value.able author and Fund Manager, 17 November 2011.
by Roger Montgomery Posted in Consumer discretionary, Insightful Insights, Investing Education, Skaffold.
-
Was this float a Turkey?
Roger Montgomery
November 3, 2011
The float of Collins Foods earlier in the year at a price of $2.50 did not interest your author. The lack of interest however was not shared by others and the company listed on the ASX with a ‘Top 20 Shareholders’ list that included many if not most of the major nominee companies (Nominee companies have long been established as the mechanism by which asset managers and custodians can process transactions on behalf of their clients).
I wrote a column for Alan Kohler in which I explained why investors might want to reconsider any enthusiasm and you can find the full column here http://rogermontgomery.com/invest-in-kfc-or-just-eat-it/
Much of the commentary around the time of the float referred to the “defensive” nature of fast food restaurants but as we have always suggested here, the only truly defensive stock market investment is an extraordinary business at a large discount to a conservative estimate of its intrinsic value.
One of the issues I had with the float was articulated thus:
“To begin with it is important to note that Pacific Equity Partners (PEP) – the private equity firm behind REDgroup, the parent company of Angus & Robertson and Borders now under administration – will be exiting its stake completely.
“Perhaps more interestingly, the existing management team is cashing in, too. Managing director Kevin Perkins will reduce his holding from over 20 per cent to about 8% and the rest of management will reduce their holding, too.
“When Pacific Equity Partners paid $US210 million in September 2005 (the $US6.92 a share was a 42% premium to the then traded price of $US4.92) for Worldwide Retail Concepts, the US publicly listed company that is now Collins Foods, management then co-invested with a 48% stake. According to all reports, management will now retain just 10%. In other words, management is selling 80% of its holdings into this float.”
Shares fall 50%
The prospectus (which didn’t include the above photo of a genetically modified chook) noted Collins Foods strengths included: “Attractive market dynamics”, “Leading market position” and “strong financial track record”. But just two months after the float, Collins Foods has warned that it will miss prospectus forecasts. The shares are down 50% at the time of writing after the company stated that it would miss forecasted by almost a third (up to 27% to be precise). Collins Food said that the downgrade is due to “fragile consumer confidence and a highly competitive restaurant industry”.
Indeed. My contacts tell me that, according to analysis of credit card usage, the only place doing really well in Australia’s retail sector is…wait for it…restaurants. Meanwhile at yesterday Dominos Pizza AGM, that company confirmed that on a like-for-like basis, sales had grown by double digits.
You cannot help but wonder, what was motivating management to sell so much of their stake into the float?
If you had your hands on the prospectus for Collins Foods and followed the steps in Chapter 11 of Value.able to value the float of Collins Foods, you might have used a forecast profit of $16 million, equity of $161 million, 93 millions shares on issue (giving an equity per share of $1.73), earnings per share of 17.3 cents and dividends per share of 11.8 cents (giving a payout ratio of 68%).
Return on equity of 10% is low and this is with the benefit of leverage (total borrowings $105 million). Immediately you know that if you are using an Investor Required Return of more than the ROE of 10%, the intrinsic value will necessarily be less than the equity per share of $1.73.
Shares fall to Intrinsic Value Estimate
Using Tables 11.1 and 11.2 and an Investor Required Return of 13% Table 11.1 produces an income valuation of $1.33 and Table 11.2 produces a growth valuation of $1.08. Multiplying $1.33 by the payout ratio of 68% results in 90 cents and Multiplying $1.08 by one minus the payout ratio of 68% results in 34 cents. Adding 34 cents and 90 cents gives a valuation of $1.24. (You can see just how bullish you or I would have to be to produce, at the time of the float, a valuation of $2.50!)
You might like to download the prospectus yourself from the ASX website here and try using Value.able’s Table 11.1 and 11.2 to arrive at the same valuation. If you don’t have a copy of Value.able, you can order your copy here
I’d love to know how you go. If you have valued any ‘Turkey’s’ yourself, go right ahead and upload your thoughts about the company and your valuation, along with a comparison to its current price.
Posted by Roger Montgomery, Value.able author and Fund Manager, 03 November 2011.
by Roger Montgomery Posted in Consumer discretionary.
-
Invest in KFC or just eat it?
Roger Montgomery
October 25, 2011
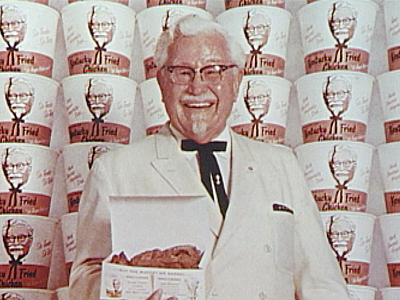 Back in July I wrote the following column about the impending float of Collins Foods/KFC at between $2.50 and $2.92 per share and suggested I would not be participating in the float on behalf of investors in the Montgomery [Private] Fund. For Value.able investors, the column, along with the fact the shares now trade at a substantial reduction, offers some insights into the thinking around a new float…
“As a parent I’ve never been much of a fan of fast food but I do know that many of the strong brands in this sector command enormous market share.
But I’m not here today to give you a lesson in nutrition; what I want to talk about is the opportunity to invest in the future success of KFC in Australia through the $238 million initial public offering of Collins Food Group.
The KFC brand is owned by US-based and listed Yum! Brands. Owning a strong brand is one of the best competitive advantages money cannot buy.
The value of this competitive advantage is reflected in the returns on equity, gross margins and pre-tax profit margins Yum! Brands generates of 66.2%, 33.6% and 14.3% respectively for the most recent 12-month period.
Amongst 47 listed restaurants in the United States, Yum is number two by return on equity and 17th among 790 listed services companies by the same measure. There are indeed very high returns to be made from leveraging a great brand like KFC and selling franchises.
Being the franchisee, on the other hand, is rarely as lucrative and the forthcoming listing of Australia’s largest KFC franchisee – Collins Foods Limited (CKF) – will demonstrate this to investors.
Collins has 119 KFC stores (117 of them in Queensland), along with 26 Sizzler restaurants in Western Australia, NSW and Queensland, and it’s the franchisor of maybe 60 Sizzlers in Asia.
The price point of these restaurants will inevitably have fund managers – who are participating in this week’s bookbuild – referring to Collins as a “defensive” investment. But as I have previously indicated, the only defensive investment is a brilliant one; mediocre companies need not apply.
To begin with it is important to note that Pacific Equity Partners (PEP) – the private equity firm behind REDgroup, the parent company of Angus & Robertson and Borders now under administration – will be exiting its stake completely.
Perhaps more interestingly, the existing management team is cashing in, too. Managing director Kevin Perkins will reduce his holding from over 20 per cent to about 8% and the rest of management will reduce their holding, too.
When Pacific Equity Partners paid $US210 million in September 2005 (the $US6.92 a share was a 42% premium to the then traded price of $US4.92) for Worldwide Retail Concepts, the US publicly listed company that is now Collins Foods, management then co-invested with a 48% stake. According to all reports, management will now retain just 10%. In other words, management is selling 80% of its holdings into this float.
If PEP bought the company in 2005 alongside management who owned 48%, and you buy in 2011 with management owning just 10%, do you think the deal has a whiff of fried chicken to it?
During the privatisation, PEP and the management were arguably similarly incentivised but when you buy Collins Food Group’s from PEP in the IPO, you will not have the same committed management.
And when PEP bought Worldwide Retail Concepts in 2005, the company operated, joint ventured or franchised 302 Sizzler restaurants (with 28 in Australia), 112 KFC sites (111 in Queensland) and it also owned 22 sites of the US “quick casual” or family value restaurant chain Pat & Oscars.
Worldwide Restaurant Concepts reported revenues of $US347.2 million in the year to April 30, 2004 ($A444 million at the then exchange rate of US78¢) and 70% was generated in Australia. All this for $US210 million ($A269 million).
According to reports, you are being asked to pay $A230–278 million ($US244–295 million) for 119 KFC outlets, 26 Sizzlers and around 55 franchised Sizzlers in Asia. I am not sure if the IPO company will offer a stake in the other 220 Sizzlers but I can tell you the Pat & Oscars chain was sold to management in 2009 after another buyer in 2007 failed to secure funding.
Oh, what doesn’t Google know!
Same-store sales growth has been positive while in the care of PEP and Collins Foods, and is forecast to hit $430 million in 2012, according to one report, but it is the growth in earnings since the purchase in 2005 that has been spectacular.
For the year to April 30, 2004, Worldwide Restaurant Concepts earned just $4 million. In 2011 that number might be closer to $25 million for Collins Foods and it is probably for all this hard work that management want to cash in their 38%.
Despite this wonderful growth in profits, the best (read most optimistic) estimate of intrinsic value I can give you is $2.55. This represents the low end of the expected range of possible prices at which you might be entitled to any shares.
But before you jump in like a headless chicken, remember two things: management are taking their cream; and the franchisor always makes more money than the franchisee. Just look at Yum! Brands’ return on equity and compare it to Collins Food Group’s when we see it.
Finally, it’s always interesting to follow the cash account, which can give an alternative picture of the company’s position before and after its float. For those who have access to the prospectus have a look at the pro forma cash balance prior to the float.
Let’s presume it is close to $50 million. That cash balance will first increase by the proceeds of the float – say $250 million – but any debt repayment will see the account decline again.
Then you need to look carefully. If there is a further drawdown (because all the proceeds were used to reduce debt) it will see the account restored but then payments to vendors and reimbursing costs associated with the float will result in a starting cash balance that may be a lot less than it was before any float was contemplated.
If this is indeed the scenario – and it would not be one without precedent – the drawdown would have effectively funded the payment to vendors and costs. If there is no further drawdown or refinancing, there could be no payment to the vendors including management.
The prospectus will be out shortly. The last float we looked at was MACA at $1 and we suggested participation for those lucky enough to have been offered shares.
MACA shares now trade at $2.35, after being as high as $2.96, trouncing the return of the other floats we reviewed, Myer and QR National. Will Collins Food Group be an addition to the portfolio? There’s a greater chance that my kids will be regulars at a KFC restaurant!”
Posted by Roger Montgomery, Value.able author and Fund Manager, 25 October 2011.
by Roger Montgomery Posted in Consumer discretionary.
- save this article
- POSTED IN Consumer discretionary
-
Can relationships be the foundation of business?
Roger Montgomery
May 13, 2011
Back on March 10 here at my Insights blog I pieced together a little jigsaw puzzle that served as a warning to Value.able Graduates researching Carsales.com.au:
“…Relationships it seems, matter. And so they should.
“In the end, it is not cars, boats and planes that bring joy, but the quality of the relationships you develop.
“This week (commencing 7 March 2011) I read that Carsales.com.au had been sold out of Nine Entertainment Co, the rebadged PBL Media (which is owned by CVC Asia Pacific).
“Reading Terry [McCrann’s] article caused a rumour I heard last year to become louder in my mind.
“The rumour was that a group of customers of Carsales.com.au (ASX:CRZ, MQR:A1, Value.able Margin of Safety; -24%) were thinking of leaving to start a rival that would be funded by News. You could understand News’ interest, given it is losing the online automotive classifieds race to Drive (Fairfax) and Carsales.
“If this is true, and if Terry is also on the mark with the intimacy of the relationships amongst Australia’s media barons, both individual and corporate (excluding Fairfax), then it would be reasonable to assume that the status quo should be maintained until after Carsales had been spun out of the former PBL, finding itself completely owned by institutions and private investors.
“Now that hurdle is out of the way, let’s see if Carsales does lose any major customers.”
That was the crux of my 10 March blog post – that Carsales’ biggest customers were about to leave to start a rival with Newscorp.
Just 2 months have passed and if you didn’t already know, guess what? Splitsville.
The Carsguide brand, owned by News Limited and a consortium of foundation dealers that includes Automotive Holdings Group Limited, A.P Eagers Group and Trivett, plus a few other dealerships representing a quarter of Australia’s car dealers, will hop into bed together in a joint venture and share Carsguide’s revenue.
Chairman and chief executive of News Limited John Hartigan told one journo, “We will be investing in the new company, doubling the number of staff and throwing our combined resources and expertise behind the joint venture, with the intent of aggressively growing the business.”
Please refrain from posting any banter as comments, just your highest quality thoughts and experiences investing in online businesses. How have you faired investing in online businesses?
Posted by Roger Montgomery, author and fund manager, 13 May 2011.
by Roger Montgomery Posted in Consumer discretionary, Insightful Insights, Takeovers, Value.able.
-
What did Ben Graham get right?
Roger Montgomery
April 29, 2011
 If you are new to our Value.able community, Ben Graham’s concepts may be foreign to you. Ben is the author of Security Analysis. He is regarded as the father of security analysis and the intellectual Dean of Wall Street.
I support Ben’s revered status and what he has to say on the subject of investing, but perhaps controversially, I also believe that, had he access to a computer that allowed him to properly test his ideas, he may not have reached all of the same conclusions.
It is exactly one year since I first penned some of my thoughts about Ben Graham on this blog here: http://rogermontgomery.com/should-a-value-investor-imitate-ben-graham/
There are many things that Ben said that not only make sense, but has also made significant contributions to investment thinking. Indeed they have become seminal investment principles. These are the things to which Value.able investors should hold firm.
Ben Graham authored the Mr Market allegory and also coined the three most important words in value investing: Margin of Safety. In fact Ben said this: “Confronted with the challenge to distill the secret of sound investment into three words, I venture the motto: Margin of Safety”
These are two concepts that value investors hold dear and which have, in many different ways, become a formal part of our Value.able investing framework.
Mr. Market is of course a fictitious character, created by Ben to demonstrate the bipolar nature of the stock market.
Here is an excerpt from a speech made by Warren Buffett about Ben Graham on the subject:
“You should imagine market quotations as coming from a remarkably accommodating fellow named Mr Market who is your partner in a private business. Without fail, Mr Market appears daily and names a price at which he will either buy your interest or sell you his.
“Even though the business that the two of you own may have economic characteristics that are stable, Mr Market’s quotations will be anything but. For, sad to say, the poor fellow has incurable emotional problems. At times he feels euphoric and can see only the favorable factors affecting the business. When in that mood, he names a very high buy-sell price because he fears that you will snap up his interest and rob him of imminent gains…
“Mr Market has another endearing characteristic: He doesn’t mind being ignored. If his quotation is uninteresting to you today, he will be back with a new one tomorrow.
Transactions are strictly at your option…But, like Cinderella at the ball, you must heed one warning or everything will turn into pumpkins and mice: Mr Market is there to serve you, not to guide you.
“It is his pocketbook, not his wisdom that you will find useful. If he shows up some day in a particularly foolish mood, you are free to either ignore him or to take advantage of him, but it will be disastrous if you fall under his influence.”
If you have read Value.able you will understand Margin of Safety, know exactly what a suitable Margin of Safety is and also how to apply it to Australian stocks.
Despite the high profile of these two enduring lessons, I believe there is a third observation of Graham’s, which is equally important. Fascinatingly, with the benefit of computers, I can also demonstrate that Graham was spot on.
Graham was paraphrased by Buffett in 1993 thus:
“In the short run the market is a voting machine – reflecting a voter-registration test that requires only money, not intelligence or emotional stability – but in the long run, the market is a weighing machine”
What Graham described is something that, as both a private and professional investor, I have observed myself; in the short term the market is a popularity contest – prices often diverge significantly from that which is justified by the economic performance of the business. But in the long-term,prices eventually converge with intrinsic values, which themselves follow business performance.
Have a look at the amazing chart below.
(c) Copyright 2011 Roger Montgomery
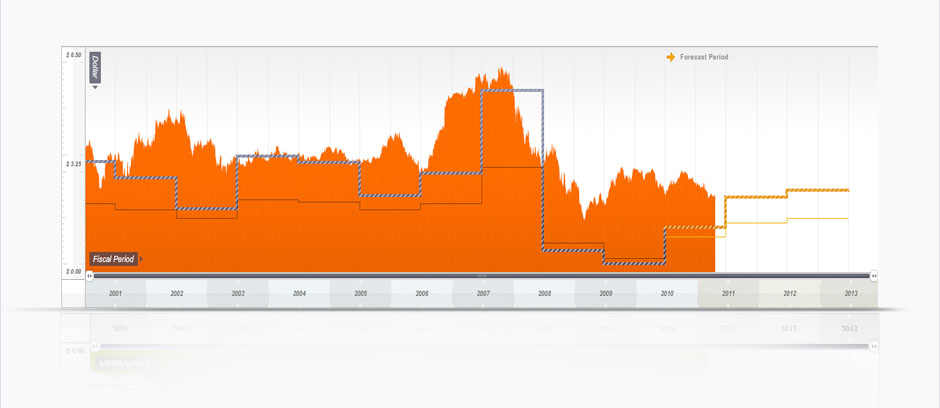
Its Qantas (ASX:QAN, MQR: B3, MOS-44%): – its my ten-year history of price and intrinsic value (and three year forecast of intrinsic value which updates daily). Now right click on the chart and open it in a new tab. Zoom in. Now stand back from your computer screen. What do you see?
First you will notice two intrinsic values – a range is produced. Next you might notice that there have been short term bouts of both optimism and despondency and this is reflected in the short term share price changes. The final observation you might make and which the charts make most powerfully, is that since 2001, the intrinsic value of Qantas, which is based on its economic performance has, at best, not changed. Look closer and you will notice that the intrinsic value of Qantas today (2011) is lower than it was a decade ago. Even by 2013, intrinsic value is not forecast to be materially different from that of 2002.
Just as Ben Graham predicted, the long-term weighing machine has correctly appraised Qantas’ worth. Unsurprisingly, the share price today of Australia’s most recognised airline, is also lower than it was a decade ago. And unbelievably, the total market capitalisation of Qantas today is less than the money that has been ‘left in’ and ‘put in’ by shareholders over the last ten years!
These charts aren’t just easy or nice to look at, they are incredibly powerful. If you can calculate intrinsic values for every listed company, you can turn the stock market off and simply pay attention to those values. Then, during those times that the market is doing something irrational, you can take advantage of it or ignore it, just as Ben Graham advised.
Unless you can see a reason for a permanent change in the prospects of Qantas, the long-term trend in intrinsic value gives you all the information you need to steer well clear of this B3 business.
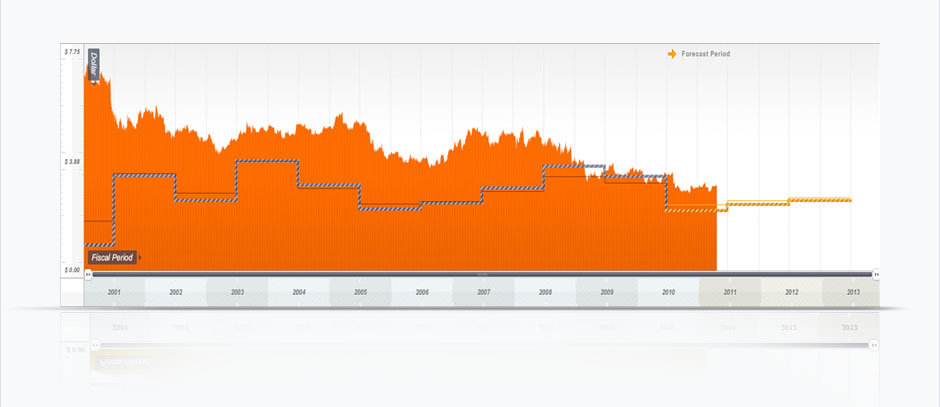
Now have a look at the second chart. What does it tell you?
(c) Copyright 2011 Roger Montgomery
There have been short-term episodes of price buoyancy, but over the long run the weighing machine has done its work. The intrinsic value has not changed in ten years so, over time, the share price has once again reflected the company’s worth and gradually but perpetually fallen until it reaches intrinsic value. This is my ten-year historical price and intrinsic value chart (and three year forecast) for Telstra (ASX:TLS, MQR: B3, MOS:-32%).
What about an extraordinary A1 business?
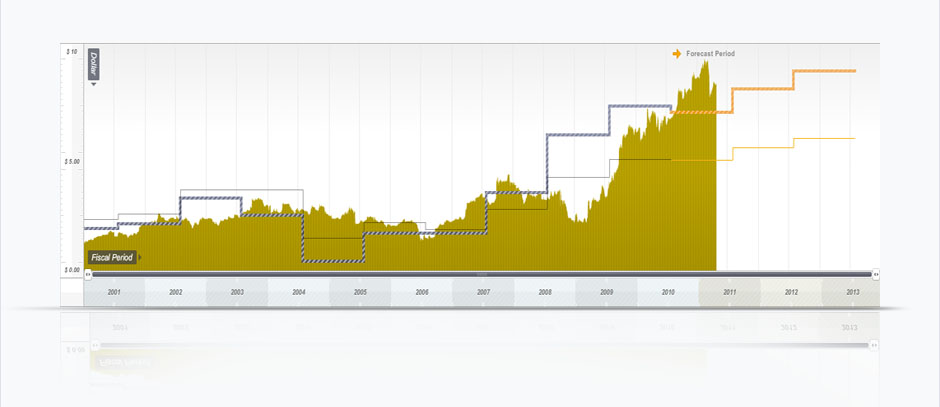
Sally Macdonald joined Oroton (ASX:OTN, MQR: A1, MOS:-17%) as CEO in 2005/06. Observe the strong correlation between price and value since Sally’s appointment.
(c) Copyright 2011 Roger Montgomery
I acknowledge that there are critics of the approach to intrinsic value we Value.able Graduates follow. But like me, you should be delighted there are. Indeed, we should be encouraging departure from this approach!
The critics are necessary. Not only do they help refine your ideas, but without them, how else would we be able to buy Matrix at $3.50, Forge at $2.60, Vocus at $1.60 or Zicom at $0.32! And how else would we be able to navigate around and away from Nufarm or iSoft, and not fall into the trap of buying Telstra at $3.60 because the ‘experts’ said it had an attractive dividend yield? If it was universal agreement I was after, I would just keep writing about airlines.
The Value.able approach works. If you have been visiting the blog for a while, you will know this only too well.
The above charts (automatically updated daily – and I have one for every, single, listed company) confirms what Ben Graham had discovered without the power of modern computing; In the short run the market is indeed a voting machine, and will always reflect what is popular, but in the long run the market is a weighing machine, and price will reflect intrinsic value.
If you concentrate on long-term intrinsic values and avoid the seduction of short-term prices, I cannot see how, over a long period of time, you cannot help but improve your investing.
…And in case you are wondering about the link between Ben Graham and the photograph of Comanche Indian ‘White Wolf’… the photo of White Wolf was taken in 1894 – the year Ben Graham was born.
HOMEWORK RESULTS: I will publish the holiday results homework on Monday. Thank you to all who participated. It is vital what you continue to practice your technique. With repetition you’ll get to the point where you can simply ‘eye-ball’ Value.able intrinsic value.
Posted by Roger Montgomery, author and fund manager, 29 April 2011.
by Roger Montgomery Posted in Companies, Consumer discretionary, Insightful Insights, Investing Education, Technology & Telecommunications, Value.able.
-
Is Oroton Australia’s best retailer?
Roger Montgomery
April 12, 2011
Oroton, JB Hi-Fi, The Reject Shop, Woolworths, Nick Scali, Cash Converters. If you have seen me on Sky Business or visited my YouTube channel recently, these names will be familiar. David Jones, Country Road, Harvey Norman, Myer, Super Retail Group (think Super Cheap Auto), Strathfield Group (Strathfield Car Radios), Noni B and Kathmandu also spring to mind, albeit for different reasons.
As a business, retailers are relatively easy to understand. The best managers are easy to spot (think Oroton’s Sally MacDonald) and it is also easy to separate the businesses with earnings power from those without (compare JB Hi-Fi and Harvey Norman).
But generally speaking even the best retailers may not be companies you want to hold forever. Why? Because they quickly reach saturation and so must constantly reinvent themselves.
Barriers to entry are low. There are always new concepts with young, intelligent and energetic entrepreneurs eager to develop a new brand and offering. Big red SALE signs are replacing mannequins as permanent window fixtures in Australian shop fronts, driving down revenue and margins. And for those who choose to defend brand value, sales revenue is also often sacrificed.
Then there’s the twin-speed economy, a string of natural disasters, soaring oil prices, growing personal savings, higher interest rates, Australia’s small population and one that is increasingly adept at shopping online for a getter price. Hands up who wants to be a retailer?
Retailers are attractive businesses – at the right price and the right stage in their life cycle. So, in retailing, who is Australia’s good, bad and just plain ugly?
Remember, these comments are not recommendations. Conduct your own independent research and seek and take professional personal advice.
Harvey Norman
ASX:HVN, MQR: A3, MOS: -19%A decade ago Gerry’s retail giant earned $105 million profit on $484 of equity that we put in and left in the business. That’s a return of around 19 per cent. Fast-forward to 2010 and we’ve put in another $117 million and retained an additional $1.5 billion. Despite this tripling of our commitment, however, profits have little more than doubled to $236 million. Return on equity has fallen by a third and is now about 12%. One decade of operating and the intrinsic value of Harvey Norman has barely changed. HVN is a mature business, but be warned… Harvey Norman is what JB Hi-Fi and The Reject Shop would see if they used a telescope to look forward through time.
OrotonGroup Limited
ASX:ORL, MQR: A1, MOS: -21%Sally MacDonald is a brilliant retailer. I highly recommend watching this interview – click here. Sally took over Oroton in 2006. In just five years she has cut loss making stores and brands, sliced overheads, improved both the quality and diversity of the range. The result? Surging revenues and return on equity in 2010 of circa 85 per cent. Try getting that in a bank account or even a term deposit! Asia offers even brighter prospects for Oroton while their product offering is sufficiently attractive and appealing that the company has the ability to weather the retail storm and protect its brand.
Woolworths Limited
ASX: WOW, MQR: B1, MOS: -17%You don’t get any bigger than Woolworths (its one of the 20 largest retailers on the planet!). It has a utility-like grip on consumers only, with earnings power that would put any utility to shame. The latter can be seen in the near 30% annualised increase in intrinsic value. Competitive position and size means suppliers and customers fund the company’s inventory. Challenges included professed legislative changes to poker machine usage (WOW is the largest owner of poker machines and any drag in revenue will have an exponential impact on profits), and the rollout of a competitor to Bunnings.
David Jones Limited
ASX: DJS, MQR: A2, MOS: -35%A beautiful shop makes not a beautiful business. I remember when David Jones floated. Shoppers who enjoyed the ‘David Jones’ experience and were loyal to the brand bought shares with the same enthusiasm as scouring the shoe department at the Boxing Day sales. Since 2007 DJS has reduced its Net Debt/Equity ratio from 108 per cent to just under 12 per cent. We are yet to see if Paul Zahra can lead DJs with the same stewardship as former CEO Mark McInnes but as far as department stores can possibly be attractive long-term investments, DJs isn’t it.
Myer
ASX: MYR, MQR: B1, MOS: -27%In 2009, following the release of that gleaming My Prospectus, I wrote:
“With all the relevant data to value the business now available and using the pro-forma accounts supplied in the prospectus, I value the company at between $2.67 and $2.78, substantially below the $3.90 to $4.90 being requested [by the vendors]. It appears to me that the float favours existing shareholders rather than new investors.”
My 2011 forecast value for Myer is just over $2. According to My Value.able Calculations, Myer will be worth less in 2013 than the price at which it listed in September 2010. If competitors like David Jones, Just Jeans, Kmart, Target, Big W, JB Hi-Fi, Fantastic Furniture, Captain Snooze, Sleep City, Harvey Norman, Nick Scali and Coco Republic were removed, Myer may just do alright.
Noni B
ASX: NBL, MQR: A2, MOS: -51%Noni B’s intrinsic value is the same as when Alan Kindl floated the company in 2000 (the family retained a 40% shareholding). Return on Equity hasn’t changed either. Shares on issue however have increased 50 per cent yet profits have remained relatively unchanged.
Kathmandu Holdings Limited
ASX: KMD, MQR: A3, MOS: -56%Sixty per cent of Kathmandu’s revenues are generated in the second half of the year. Will weather patterns continue to feed this trend? I sense premature excitement following the implementation of KMD’s newly installed intranet. The system may streamline store-to-store communications, reducing costs and creating inventory-related efficiencies for the 90-store chain, however what’s stopping a competitor replicating the same out-of-the-box system?
Fantastic Furniture
ASX: FAN, MQR: A3, MOS: -24%Al-ways Fan-tas-tic! Once upon a time it was. Low barriers to entry are seeing online retro furniture suppliers like Milan Direct and Matt Blatt are forcing Fantastic and other traditional players to reinvent the way they display, price and stock inventory.
Billabong
ASX: BBG, MQR: A3, MOS: -49%Billabong’s customers are highly fickle, trend conscious and anti-establishment. Like Mambo, as one of my team told me, Billabong is “so 1999 Rog”. Apparently Noosa Longboards t-shirts fall into the “cool” category, now. Groovy!
Eighty per cent of Billabong’s revenues are derived from offshore. Every one-cent rise in the Australian dollar has a half percent negative impact on net profits. Fans of the trader Jim Rogers believe the AUD could rise to USD$1.40! Then there’s the 44 stores affected by Japan’s earthquake (18 remain closed) and another three in the Christchurch earthquake.
Country Road
ASX: CTY, MQR: A3, MOS: -63%).Like the quality of their clothing, Country Road’s MQR has been erratic. So too has its value. Debt is low however cash flow is not attractive. Very expensive.
Cash Convertors
ASX: CCV, MQR: A2, MOS: +26%.Value.able Graduates Manny and Ray H nominated CCV as their A1 stock to watch in 2011. Whilst its not yet an A1, Cash Convertors is a niche business with bight prospects for intrinsic value growth.
Other retailers to watch
I have spoken about JB Hi-Fi, Nick Scali and The Reject Shop many times on Peter Switzer’s Switzer TV and Your Money Your Call on the Sky Business Channel. Go to youtube.com/rogerjmontgomery and type “retail”, “JBH”, “TRS” or “reject” into the Search box to watch the latest videos.
In October 2009 the RBA released the following statistics:
16 million. The number of credit cards in circulation in Australia;
$3,141. The average monthly Australian credit card account balance;
US$56,000. The average mortgage, credit card and personal loan debt of every man, woman and child in Australia;
$1.2 trillion. The total Australian mortgage, credit card and personal loan debt;
$19.189 billion. The amount spent on credit and charge cards in October 2009.Clearly we are all shoppers… what are your experiences? Who do you see as the next king of Australia’s retail landscape?
Posted by Roger Montgomery, author and fund manager, 12 April 2011.
by Roger Montgomery Posted in Companies, Consumer discretionary, Insightful Insights, Investing Education, Value.able.
-
What is your WOW Value.able valuation now Roger?
Roger Montgomery
February 14, 2011
 With food prices on the way up and Woolies share price on the way down, I have received many requests for my updated valuation (my historical $26 valuation was released last year). Add to that Woolworths market announcement on 24 January 2011, and you will understand why I have taken slightly longer than usual to publish your blog comments.
With Woolworths’ shares trading at the same level as four years ago (and having declined recently), I wonder whether your requests for a Montgomery Value.able valuation is the result of the many other analysts publishing much higher valuations than mine?
Given WOW’s share price has slipped towards my Value.able intrinsic value of circa $26, understandably many investors feel uncomfortable with other higher valuations (in some cases more than $10 higher),
Without knowing which valuation model other analysts use, I cannot offer any reasons for the large disparity. What I can tell you is that no one else uses the intrinsic valuation formula that I use.
So to further your training, and welcome more students to the Value.able Graduate class of 2011, I would like to share with you my most recent Value.able intrinsic valuation for WOW. Use my valuation as a benchmark to check your own work.
Based on management’s 24 January announcement, WOW shareholders can expect:
– Forecast NPAT growth for 2011 to be in the range of 5% to 8%
– EPS growth for 2011 to be in the range of 6% to 9%The downgraded forecasts are based on more thrifty consumers, increasing interest rates, the rising Australian dollar and incurring costs not covered by insurance, associated with the NZ earthquakes and Australian floods, cyclones and bush fires. The reason for the greater increase in EPS for 2011 than reported NPAT is due to the $700m buyback, which I also discussed last year.
Based on these assumptions and noting that WOW reported a Net Profit after Tax of $2,028.89m in 2010, NPAT for 2011 is likely to be in the range of $2,130.33 to $2,191.20. Also, based on the latest Appendix 3b (which takes into account the buyback), shares on issue are 1212.89m, down from 1231.14m from the full year.
If I use my preferred discount rate (Required Return) for Woolies of 10% (it has always deserved a low discount rate), I get a forecast 2011 valuation for Woolworths of $23.69, post the downgrade. This is $2.31 lower than my previous Value.able valuation of $26.
If I am slightly more bullish on my forecasts, I get a MAXIMUM valuation for WOW of $26.73, using the same 10% discount rate.
So there you have it. Using the method I set out in Value.able, my intrinsic valuation for WOW is $23.69 to a MAXIMUM $26.73.
Of course, I only get excited when a significant discount exists to the lower end of these valuations and until such a time, I will be sitting in cash.
Posted by Roger Montgomery, author and fund manager, 14 February 2011.
by Roger Montgomery Posted in Companies, Consumer discretionary, Insightful Insights, Investing Education.
-

MEDIA
Valueline: The retailers
Roger Montgomery
October 27, 2010
Retailers with competitive advantage make big profits. Here are my top picks. Read Roger’s article at www.eurekareport.com.au.
by Roger Montgomery Posted in Consumer discretionary, On the Internet.
-
Has BHP and WOW survived the reporting season snow storm?
Roger Montgomery
August 31, 2010
 The final reporting season avalanche has coincided with a serious amount of snow in the high plains. No matter where one turns, there’s no escaping heavy falls. More than 300 companies have reported in five days and I am completely snowed under. If you haven’t yet received my reply to your email, now you understand why.
To put my week into perspective, up until last Monday morning, around 200 companies had reported (see my Part I and Part II reporting season posts). This week’s 300-company avalanche brought the total to 500. I’m sorry to report that without a snowplough, I have fallen behind somewhat. Around 200 are left in my in-tray to dig through. I will get to them!
Thankfully, there are only a few days left in the window provided by ASX listing Rule 4.3B in which companies with a June 30 balance date must report, and by this afternoon, I will be able to appreciate the backlog I have to work through. So not long to go now…
Nonetheless, today I would like to talk about two companies which I am sure many of you are interested in: BHP and Woolworths. Both received the ‘Montgomery’ B1 quality score this year.
For the full year, BHP reported a net profit of around A$14b and a 27% ROE – a big jump on last years $7b result, which was impacted by material write-offs. Backing out the write-offs, last years A$16b profit and ROE of 36% was a better result than this years. The fall in the business’s profitability has likewise seen my 2010 valuation fall from $34-$38 to around $26-$30 per share, or a total value of $145b to $167b (5.57 billion shares on issue).
With the shares trading in a range of $35.58 to $44.93 ($198b to $250b) for the entire 52 weeks, it appears that the market and analysts expected much better things. While they didn’t come this year, are they just around the corner? I will let you be the judge.
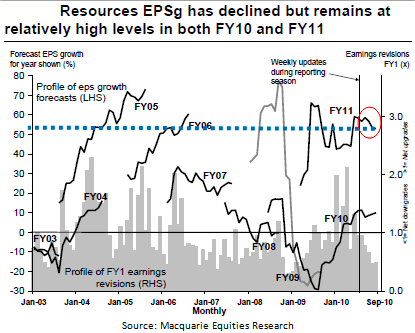
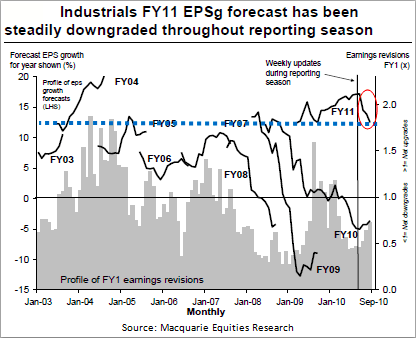
The “market” (don’t ask who THAT is!) estimates resource company per share earnings growth of 50 per cent for 2011. I have drawn a thick blue line to show this on the left hand side of the following graph so you can see where my line intersects.
BHP has a large weighting in the resources sector, so the forecast increase in net earnings by 57 per cent to A$22b is having a material impact on the sector average. Importantly, the forecast growth rate is similar to those seen in 2005 and 2006 when the global economy was partying like there was no GFC. Call me conservative, but I reckon those estimates are a little optimistic in todays environment.
As you know I leave the forecasting of the economy and arguably puerile understandings of cause-and-effect relationships to those whose ability is far exceeded by their hubris. Its worth instead thinking about what BHP has itself stated; “BHP Billiton remains cautious on the short-term outlook for the global economy”.
Given my conservative nature when it comes to resource companies and the numerous unknowns you have to factor in, I would be inclined to be more conservative with my assumptions when undertaking valuations for resource companies. If you take on blind faith a A$22b profit, BHP’s shares are worth AUD $45-$50 each.
But before you take this number as a given, note the red circle in the above chart. Earnings per share growth rates are already in the process of being revised down. I would expect further revisions to come. And if my ‘friends-in-high-places’ are right, it’s not out of the realm of possibilities to see iron ore prices fall 50 per cent in short order. You be the judge as to how conservative you make your assumptions.
A far simpler business to analyse is Woolworths and for a detailed analysis see my ValueLine column in tonight’s Eureka Report. WOW reported another great result with a return on shareholders’ funds of 28% (NPAT of just over $2.0b) only slightly down from 29% ($1.8b) last year. This was achieved on an additional $760m in shareholders’ funds or a return on incremental capital of 26% – and that’s just the first years use of those funds. This is an amazing business given its size.
My intrinsic value rose six per cent from $23.71 in 2009 to $25.07 in 2010. Add the dividend per share of $1.15 and shareholders experienced a respectable total return.
Without the benefit of the $700 million buyback earnings are forecast by the company to rise 8-11 per cent. However, the buyback will increase earnings per share and return on equity, but decrease equity. The net effect is a solid rise in intrinsic value. Instead of circa $26 for 2011, the intrinsic value rises to more than $28.
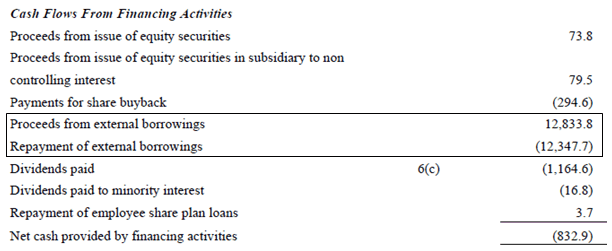
But it’s not the price of the buyback that I will focus on as that will have no effect on the return on equity and a smaller-than-you-think effect on intrinsic value (thanks to the fact that only around 26 million shares will be repurchased and cancelled). What I am interested in is how the buyback will be funded. You see WOW now need to find an additional $700m to undertake this capital management initiative. So where will the proceeds come from? That sort of money isn’t just lying around. The cash flow statement is our friend here.
In 2010 Operating Cash Flow was $2,759.9 of which $1,817.7m was spent on/invested in capital expenditure, resulting in around $900m or 45% of reported profits being free cash flow – a similar level to last year. A pretty impressive number in size, but a number that also highlights how capital intensive owning and running a supermarket chain can be.
From this $900m in surplus cash, management are free to go out and reinvest into other activities including acquisitions, paying dividends, buybacks and the like. So if dividends are maintained at $1.1-$1.2b (net after taking into account the DRP), that means the business does not have enough internally generated funds to undertake the buyback. They are already about $200-$300m short with their current activities. In 2010 WOW had to borrow $500m to make acquisitions, pay dividends and fund the current buyback.
Source: WOW 2010 Annual Report
Clearly the buyback cannot be funded internally, so external sources of capital will be required. In the case of the recently announced buyback it appears the entire $700m buyback will need to be financed via long-term debt issued into both domestic and international debt capital markets, which management have stated will occur in the coming months. They also have a bank balance of $713m, but this has not been earmarked for this purpose.
Currently WOW has a net debt-equity ratio of 37.4 per cent so assuming the buyback is fully funded with external debt, the 2011 full year might see total net gearing rise to $4.250b on equity of $8,170b = 52 per cent.
A debt-funded buyback will be even more positive for intrinsic value than I have already stated, but of course the risk is increased.
While 52 per cent is not an exuberant level of financial leverage given the quality of the business’s cash flows, I do wonder why Mr Luscombe and Co don’t suspend the dividend to fund the buyback rather than leverage up the company with more debt? This is particularly true if they believe the market is underpricing their shares.
Yes, it’s a radical departure from standard form.
I will leave you with that question and I will be back later in the week with a new list of A1 and A2 businesses. Look out for Part Three.
Posted by Roger Montgomery, 31 August 2010.
by Roger Montgomery Posted in Companies, Consumer discretionary, Energy / Resources.
-
Is Oroton an amazing A1 business?
Roger Montgomery
July 12, 2010
Peter Switzer invites me every Thursday fortnight to join him on the Sky Business Channel. 4 June was like any other show. Except once Peter and I had finished discussing investing and stocks and the market, he invited me to stay on for his interview with OrotonGroup CEO Sally Macdonald.
For readers of my blog, you will know that Oroton is one of my A1 businesses. And I have often said that Sally Macdonald is a first-class manager.
Below are the highlights from that interview.
Each time a new video is uploaded to my YouTube channel I post a note at my Facebook page. On Facebook will also find my upcoming talks, editorial features, TV interviews, radio spots and the latest news about Value.able.
If you are yet to pick up the latest issue of Money magazine find it at the newsstand now, there are a bunch of terrific columns. Click here to read my monthly column. This month I write about ‘Great Retail Stocks’.
by Roger Montgomery Posted in Companies, Consumer discretionary, Insightful Insights, Investing Education.
