Monthly Archives: May 2012
Your Exclusive Guide to Understanding Biotechs.
Roger Montgomery
May 31, 2012
Praveen has really put in some effort to bring this to you. Enjoy!
ANATOMY OF A BIOTECH by Praveen Jayarajan 1st May 2012
Investing in biotechnology companies is an inherently risky endeavour for many reasons, with many pundits of the view that the entire sector is highly speculative. But as with any such investment, the potential returns can be huge. However, the average investor, who may not be familiar with the terminology used in company reports, presentations, analyst coverage, and the media, may not have a great deal of understanding about the industry and what these companies actually do. In this article I am going to try and decode and de-jargon the industry and hopefully give you a better understanding of how to assess these companies.
Big Pharma vs Biotech
To begin with, we need to appreciate the traditional differences between a pharmaceutical and a biotechnology company. Traditionally, pharmaceutical companies, also now commonly referred to as “Big Pharma”, have been involved in small molecule therapies. What this means is that the drugs they produce are made from molecules that are relatively simple and small in size. These molecules are all chemically manufactured or synthesized by combining different compounds in a laboratory. They are also available in the form of an oral tablet or capsule, and can be easily absorbed into the bloodstream through the intestine. Once in the bloodstream they are able to penetrate different cells in the body due to their small size. An example is Lipitor, used to treat high cholesterol, made by Pfizer.
In contrast, biotechnology companies, also referred to as “Biotech”, have been involved in large molecule therapies called biologics that are based on molecules that are more complex and large in size. These molecules are manufactured using genetically modified living cells of microorganisms such as viruses and bacteria, as well as from human and animal sources. Biologics are usually administered via an injection or infusion, as they are too big to be absorbed when given orally. Once in the bloodstream they act in different ways to traditional drugs, including binding to receptors on the surface of cells rather than penetrating the cells. An example is Fluvax, which is the influenza vaccine, made by CSL.
The line between these two definitions has become increasingly blurred. In fact, these traditional definitions for Big Pharma and Biotech do not have as much relevance today. Biotech’s are now seen as smaller research and development companies, with Big Pharma taking the role of the larger company with the expertise and funding to progress a drug or biologic (in this article I will may also use the word “product” or “medication” interchangeably when referring to drugs and biologics) through the regulatory process and then take it into production and marketing. Examples of Big Pharma include Pfizer, Roche, GlaxoSmithKline, Novartis, Sanofi, and AstraZeneca. Note that there are also companies that can be loosely considered “Small Pharma” and “Big Biotech”.
The Patent Cliff
What is a patent? A government license that gives the holder exclusive rights to a process, design or new invention for a designated period of time. Applications for patents are usually handled by a government agency (taken from Investopedia).
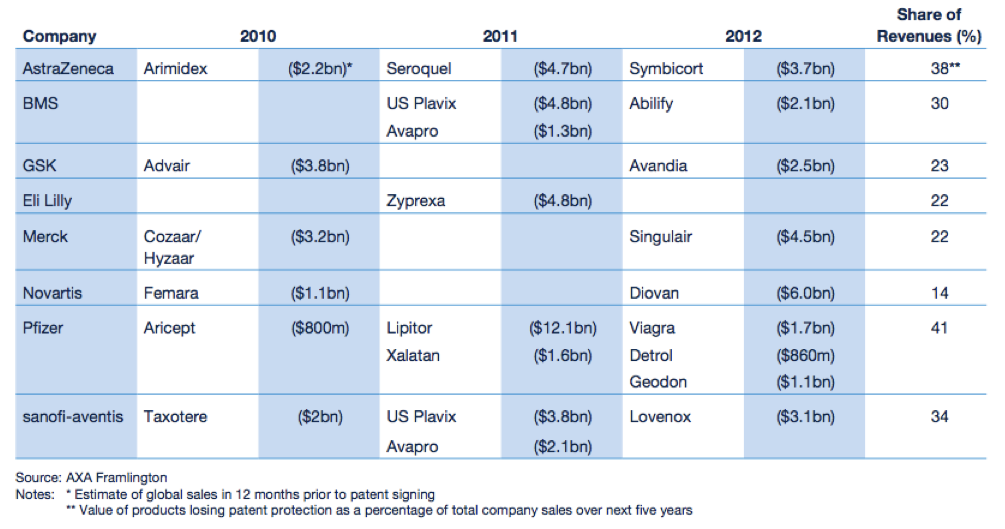
The “patent cliff” refers to what happens to revenues when an original product’s patent expires. As this happens, in the case of Big Pharma, they face competition from similar drugs made by other companies at a fraction of the price. These drugs are called generics. Generic drug manufacturers need to prove that their version of the drug is bioequivalent to the original. That is, it must have the same active ingredient and have the same properties as the original, but it does not have to go through extensive clinical trials like the original. According to the IMAP Pharma and Biotech Industry Global Report (2011), original drugs can face a price erosion of 70% within months of going off patent. Furthermore, revenues of drugs going off patent between 2010 and 2014 will be ~ US$89.5 billion. A number of “blockbuster” drugs (drugs that have revenues greater than US$1 billion) are due to go off patent in the coming years. The world’s biggest selling drug Lipitor, went off patent towards the end of 2011.
With regards to biologics, the patent cliff issue still applies, off patent biologics are called biosimilars or follow-on biologics. The difference is that because biologics are complex molecules, it is much harder and more expensive to make a bioequivalent version, and the regulatory requirements are far more rigorous. The worldwide biosimilars market is still in its infancy, with only a handful on the market. Note that there are also “me-too” products, these have similar active ingredients and mechanism of action to the original product, and almost identical clinical outcome, but unlike generics/biosimilars, may have other benefits. This could be increased efficacy, a different profile of adverse affects, or lower costs.
Figure 1: Expected fall in revenues for Big Pharma
Source: Pharma 2020 Report PWC
The R&D Pipeline
The research and development (R&D) pipeline refers to the group of drugs or biologics that a particular company is aiming to take into production and market. Generally, the more products it is developing and the later they are in the development phase, the more likely it is that one of their products will eventually be produced and marketed. In the 1990s, the discovery of a raft of blockbuster drugs resulted in huge revenues for the companies now recognised as Big Pharma. However, in recent times the efficiency or rate of return on their R&D efforts have been declining, with less products in late-stage development, higher average costs to develop and bring a drug to market, and a dearth of blockbusters to replace the ones going off patent. As a result of this Big Pharma are looking for innovation in the form of new biologics from their brothers in Biotech.
Big Pharma and Biotech collaboration
There is now increasing partnership and merger & acquisition (M&A) activity between Big Pharma and Biotech. Both sides have something to gain in this collaboration. Big Pharma are able to grow their pipeline, and with Biotech able to get the necessary funding to continue their R&D. With partnerships or “in-licensing”, Big Pharma will usually enter into an agreement with a Biotech whereby the Biotech will receive an upfront payment, and then further “milestone” payments as they advance the development of the product. Once the product is on sale, the Biotech will also receive royalty payments. When Big Pharma partner with a Biotech that has a product in the very early stages of development, the Biotech is likely to receive a lower share of royalties, whereas if the partnership occurs at an advanced stage, the Biotech is more likely to receive a larger share of royalties. With M&A activity, Biotech’s are being bought out at significant premiums, with the best companies fielding several bids from cashed up and hungry Big Pharma’s.
Regulatory affairs
Across the world, in order for a Big Pharma or Biotech company to be able to market or sell it’s product, the product needs to have been approved by the relevant government regulatory agency in each region that it plans to sell the product. In the US, this is the Food and Drug Administration (FDA), and in Europe, Japan, and Australia, this is the European Medicines Agency (EMA), the Ministry of Health Labour & Welfare Japan, and the Therapeutic Goods Administration (TGA) respectively. The International Conference on Harmonisation (ICH) was a project that brought together the regulatory agencies in the US, Europe, and Japan with the view to harmonising the regulatory requirements across these regions and the world. The ICH developed guidelines for regulation that have been adopted by certain countries, or are very similar to existing guidelines in others. As such, once a product has been approved in one country, meeting regulatory requirements for approval in others can be relatively straightforward.
The US FDA approval process
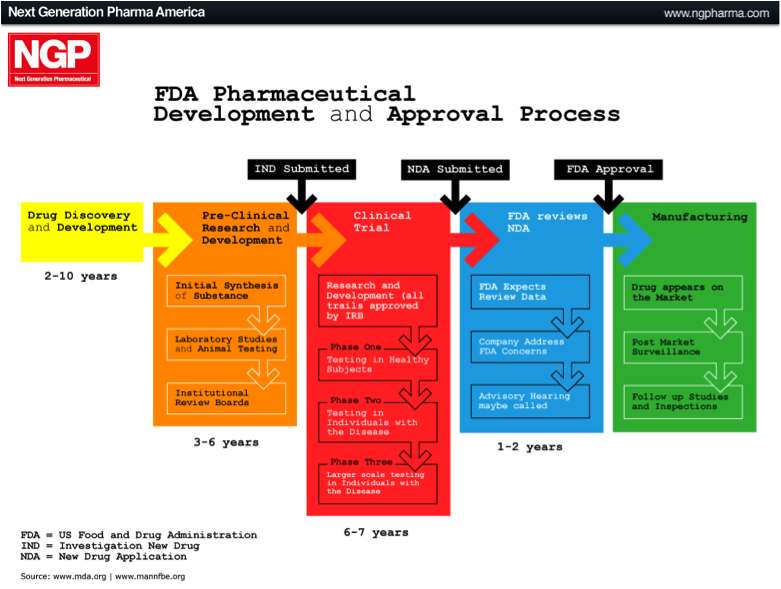
The largest market in the world for drugs and biologics is the US. It is the Holy Grail if you like, which is why many international companies tailor their product development towards meeting the FDA requirements and getting FDA approval. The approval process can be broken down into different phases, as outlined below.
Pre-Clinical Phase: This phase begins after the discovery of new molecules, and is where new molecules are investigated and tested in the laboratory (in-vitro), on animals (in-vivo), or via computer simulation (in-silico). Once this phase is completed the company files an Investigational New Drug Application (IND).
Phase 1: Once the FDA has approved the IND, Phase 1 human testing begins. In this phase the product is tested on a small group of healthy individuals to assess it’s safety. This means testing to make sure it is not toxic or carcinogenic, and to determine appropriate doses. It is also assessed to see how it is broken down or metabolised by the body.
Phase 2: Here the product has been established as safe in humans and is now tested on a small group of individuals that are affected by the disease being targeted. This is done to see if the therapy actually works, as well as any short-term effects.
Phase 3: In this phase, often referred to as the late-stage in development, the product is tested on a much larger population. The trial is generally multicentre, double-blinded, randomised and placebo-controlled (i.e. a randomised controlled trial, RCT). This means that testing is conducted at different centres and neither the subject nor the physician know whether the actual product or a placebo is being given, and the allocation is completely randomised.
At the completion of Phase 3, if the product has been proven to be safe and effective, the company will apply for a New Drug Application (NDA) or Biological License Application (BLA). If this is accepted, the final product can be marketed.
Complete Response Letter (CRL): The FDA issues a CRL in response to an NDA/BLA. In essence it is a “please explain”, that requires the applicant to clarify issues that may relate to the product, including safety, efficacy, or manufacturing related issues. In some cases the issues are minor, in other cases they could results in rejection of the application.
Figure 2: US FDA approval process
Source: Next Generation Pharmaceutical
Special Protocol Assessment (SPA): This is granted to products in uncompleted Phase 3 trials that have design, clinical endpoints/outcomes, and statistical analyses that are acceptable for approval by the FDA. The SPA is an indication that if the trial goes to plan, the final product will be approved.
Prescription Drug User Fee Act Date (PDUFA Date): PDUFA is a law that allows the FDA to collect fees from product manufacturers in order to fund the approval process. The PDUFA Date refers to the deadline by which the FDA must either approve or reject an NDA/BLA. The FDA has 10 months to review new applications.
Fast Track / Accelerated Approval / Priority Review: The FDA grants a quicker approval for important products. Fast Track is for those that treat serious diseases (e.g. AIDS, Cancer) AND fill an unmet medical need (i.e. provide a treatment where nothing else exists, or that is superior to existing treatments). Fast Track designation enables eligibility for Accelerated Approval. Accelerated Approval involves using a surrogate endpoint, e.g. a laboratory measurement or physical sign used in a clinical trial as an indirect measure of clinical outcome (survival or symptom improvement). Priority Review is used when products offer again treatment where nothing else exists, or more superior treatment, but it can be for serious or non-serious diseases, and approval can be obtained within 6 months.
Orphan Product Status: Orphan product status or designation is granted to products that treat rare diseases or conditions. The orphan designation offers a number of advantages, including product tax credits, marketing incentives, and a period of exclusivity.
Phase 4: In this phase the product is already on the market and ongoing monitoring is undertaken to observe for any new short-term or long-term effects. In some cases new data has resulted in products being taken off the market, most notably in the case of the drug Vioxx marketed by Merck & Co. Vioxx was a widely used anti-inflammatory drug used to treat acute and chronic pain related to arthritis. It was found to increase the risk of heart disease and stroke. Prior to withdrawal it had revenues of ~US$2.5 billion and was used in over 80 million people.
Summary: Drug and biologic development is a lengthy process, certainly an 8 to 10 year period from beginning the search for a potential product to final FDA approval is quite common. This requires significant funding. In assessing a Biotech one needs to be acutely aware of the amount of cash they have in reserve as well as the cash burn rate (how much cash they are spending each year). According to the latest AUSBiotech Biotechnology Industry position survey (April 2012), 34% of those surveyed have less than 12 months cash on hand at current burn rates, and 46% intend to raise capital in the coming year. However, raising funds from equity/debt capital markets or even venture capital funds may be difficult for Biotech companies in the current economic climate. Companies that may fare better are those that are already partnered with Big Pharma, or at the least are able to attract a premium valuation for acquisition.
THE PROVIDER-PAYER RELATIONSHIP, PRICING, & REIMBURSEMENT
Once a company (the provider) gets it product approved by the relevant government regulatory agency, it needs to also get it listed on a formulary. A formulary is a list of medications. Private health insurers (the payer) have a formulary. This is a list of the medications that they will pay for, usually with a part contribution or “co-payment” from the person who has been prescribed the medication. More importantly, the provider needs to get its product on a government formulary (another payer). In the US this is the Medicare Part D and Medicaid formulary. Here in Australia it is the Pharmaceutical Benefits Scheme (PBS). Private health insurers generally only cover medications already listed on a government formulary. Payers (private and public) can take up to 9 to 12 months to add new products to their formulary. In Australia, once a product has TGA approval the Pharmaceutical Benefits Advisory Committee (PBAC), an independent expert government body, makes a recommendation (to the Health Minister) as to whether it should be listed on the PBS. Once that recommendation has been accepted the Pharmaceutical Benefits Pricing Authority (PBPA) determines what price the government should pay for the medication. This is then negotiated with the provider. As an example of how the reimbursement process then works, we can look at how medications are dispensed from a pharmacy. A wholesaler first purchases the product or medication from the provider and then sells it to the pharmacy. The pharmacy receives the patient’s co-payment once the medication is dispensed, and then they receive reimbursement for the remainder of their costs from the government. This reimbursement includes the provider’s price for the medication + wholesaler’s mark-up + pharmacy mark-up + dispensing/other pharmacy fees.
THE IMPACT OF HEALTH POLICY
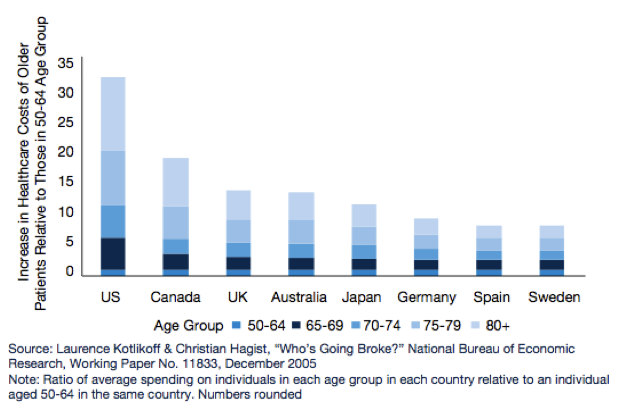
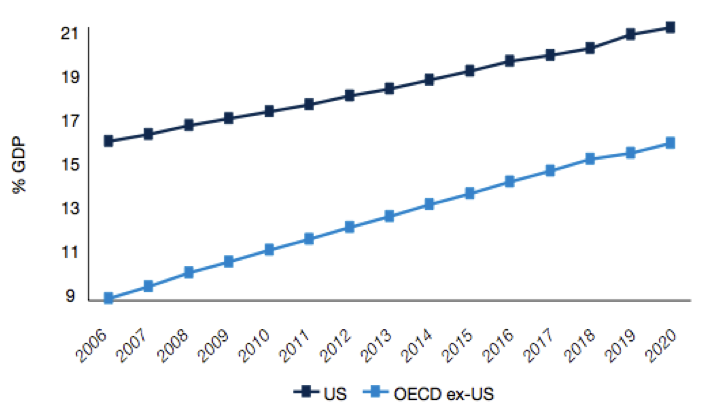
Based on a number of surveys done across the world, what we know about the developed world’s population is that it is ageing. What this means for government’s around the world is that healthcare and pharmaceutical related expenditures are going to rise significantly over the coming years. This will impact government health policy and in turn it will impact pharmaceutical and biotechnology companies.
Figure 3: Increased healthcare costs for older people
Source: Pharma 2020 Report PWC
Figure 4: Rising health expenditure as a % of GDP
Source: Pharma 2020 Report PWC
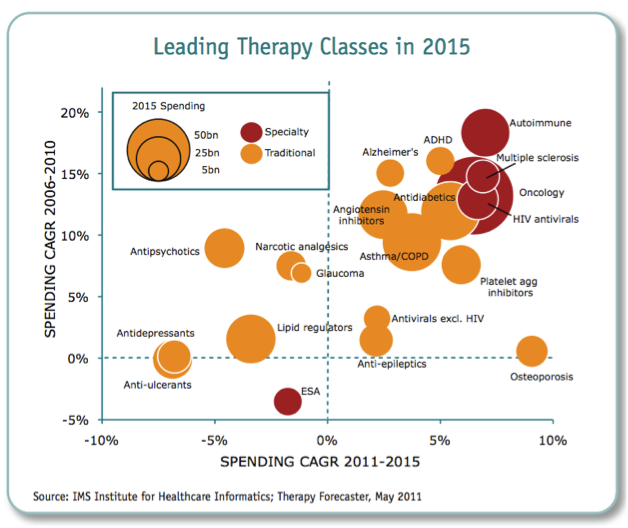
What we could therefore see is tighter regulation of products, shorter periods of exclusivity for original product manufacturers, lower drug prices or reimbursement, and more emphasis on lower cost generics or biosimilars. According to the IMS Institute for Health Informatics (2011), the key drivers for growth in the future will be increased spending from emerging markets (led by China), with a focus on generics or biosimilars, and specialty medicines (biologics).
Figure 5: Leading therapeutic classes in 2015
Source: IMS Institute of Health Informatics 2011
GRADE Classification of BioTechs
In reviewing Biotech companies I like to classify them according to 4 Grade’s, albeit arbitrarily. This is a way of trying to differentiate companies according to the strength of their product pipeline. There’s no science behind it, and it is just a guide or a starting point for further investigation, which you may or may not find useful.
Grade 1: At least 3 products on the market.
Grade 2: 1 or 2 products on the market, with at least 1 other in Phase 2 or 3 trials.
Grade 3: 1 product on the market, or no products on the market but at least 1 in Phase 3.
Grade 4: No products on the market, multiple in Pre-Clinical Phase, Phase 1, or Phase 2.
Across the Grade’s, Grade 1 companies could be considered relatively low risk as they already generating revenues and cash flow. On the other hand, these companies may have already experienced high levels of capital growth off the back of their existing products and may not have as much room to climb further, depending a lot of course on their expected future cash flows and pipeline. They may also be faced with the issue of expiring patents and increased competition from new products. I’d expect the most gains to be achieved from investing in a successful Grade 4 company that is held for the long-term. However, with the exceptionally long time it takes for product development, at the Grade 4 stage it is very hard to assess the likelihood for long-term success. Furthermore, success in Phase 1 or 2 trials is not necessarily a reliable indicator of Phase 3 success or likelihood for regulatory approval. The sweet spot for me is going to be Grade 2 and 3. In order to maximise the potential returns on a Biotech investment, I want to capture those that are closer to their “inflection point”, which may be in these mid or lower ranked Grade’s.
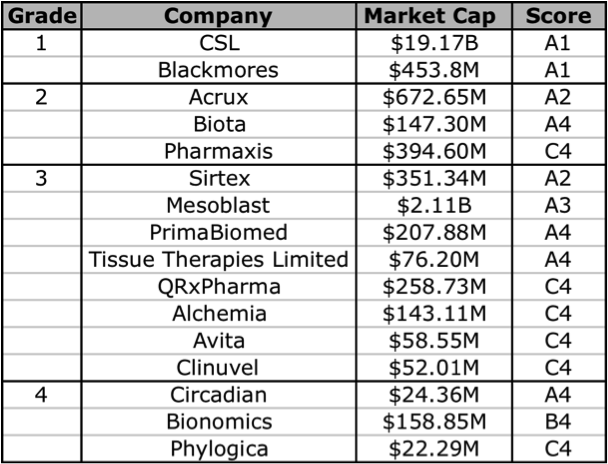
The problem here is that many of these companies are yet to generate any revenues, so a reliable valuation is difficult to make. However, using Skaffold (http:///www.skaffold.com), we can at the very least start by filtering out the ASX-listed Biotech companies, and then find those that are forecast to have a rise in their future intrinsic value. In the table below I have extracted and listed all Healthcare sector companies that that are also part of the Biotechnology/Major Drugs industry groups. The companies listed below all have analyst coverage. I have excluded 2 companies that did not really fit into the defined Grade classification, Mayne Pharma (diversified pharmaceutical services), and Sigma Pharma (wholesale and retail pharmaceutical distribution/sales).
Figure 6: Skaffold biotechnology company current Quality Scores
Source: Skaffold 26 April 2012
Based on the Skaffold Scores, there are 5 companies that could be considered investment grade. They are the A1, A2, and A3 companies: CSL, Blackmores, Acrux, Sirtex, and Mesoblast. Although Mesoblast does not have any intrinsic value, as it does not have any current product revenues. Mesoblast is an interesting one, although it has a lot of cash, this is largely the result of a partnership with Cephalon (now Teva). There are a handful of other companies that have analyst forecasts for near-term product revenue and thus have a future intrinsic value: Biota, Tissue Therapies Limited, Bionomics, Alchemia, Pharmaxis, and QRxPharma. In the following sections I will give a brief overview of 2 companies that currently have products on the market, Acrux and Sirtex, note that the former makes products that enable drug-delivery, and the other is technically a medical device company.
ACRUX (ASX:ACR)
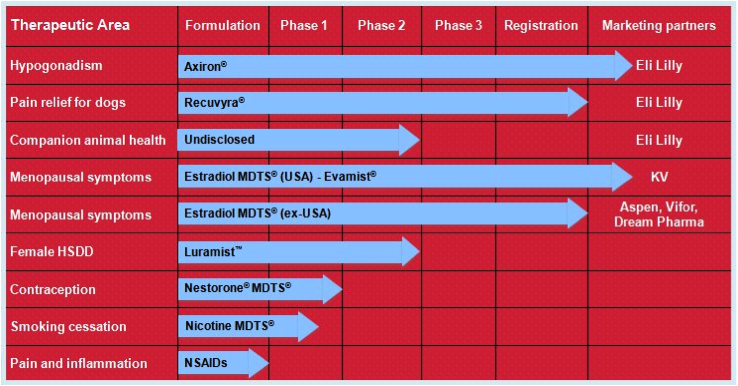
Acrux has a number of products in its pipeline, all of which are based on transdermal delivery. That is, the medications are absorbed into the bloodstream through the skin via sprays, gels, or solutions. The medications themselves have all already been used safely when administered in other ways, for example, via tablets or injections.
Figure 7: Acrux R&D pipeline
Source: Acrux website
Their lead product is Axiron. Axiron is a testosterone hormone solution used to treat low testosterone hormone levels in men (hypogonadism). It is applied in the armpits using an applicator, much like a roll-on deodorant. It was given FDA approval in 2010 and is on the market in the USA. Acrux signed a global licensing deal with Big Pharma Eli Lily in 2010 for the marketing of Axiron. As part of this deal, Acrux is entitled to up to $US335 million in milestone payments as well as worldwide royalties. The partnership with Eli Lily appears like an ideal fit, with Eli Lily already involved in the men’s health market with their erectile dysfunction product Cialis (a competitor to Pfizer’s Viagra). Axiron is actually the second product that Acrux has progressed to FDA approval, the previous being Evamist in 2007, an oestrogen hormone spray used in menopausal women that is also on the market in the USA. Acrux has also ventured into animal health products with Recuvrya, a pain relief solution for dogs that was only recently approved by the EMA (in 2011).
But let’s get back to Axiron. Low testosterone can result in symptoms such as erectile dysfunction, as well as decreased libido, energy, and mood. It is found in people who have a genetic or acquired disorder of the testes (where testosterone is produced) or of the pituitary gland in the brain (where testosterone levels in the bloodstream are regulated or controlled). Low testosterone levels can also be associated with many chronic illnesses, such as obesity, heart disease, and even depression. These illnesses may cause symptoms similar to that of testosterone deficiency, but this does not necessarily mean that testosterone replacement is required. Often focussing on treatment of the underlying illness is what is required instead. Testosterone levels also naturally decline with age, however this is gradual and usually does not get to the point where treatment is required either.
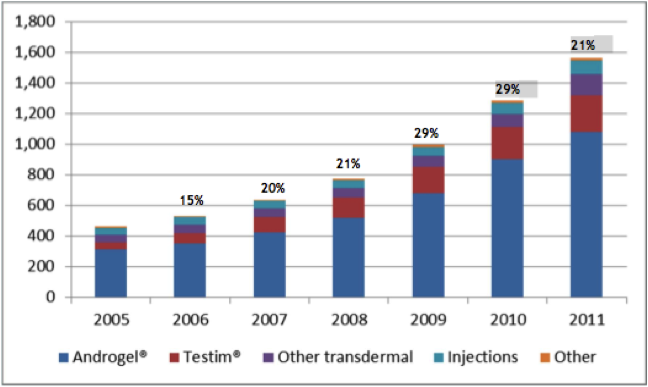
Now there are various testosterone products on the market, with many using different delivery methods, however the recent trend is favouring the newer transdermal routes. When testosterone is given in oral form, it is very difficult to achieve effective and stable concentrations in the bloodstream, this is because after it is absorbed through the intestine it is broken down or metabolised by the liver rapidly. In injectable form (a deep intramuscular injection, e.g. in the buttock) it has to be given every 1 to 3 weeks, this can be associated with severe fluctuations in testosterone concentrations in the bloodstream. This can lead to fluctuations in symptoms such as libido, energy, and mood. In the transdermal market, testosterone patches (think along the lines of nicotine patches) have had anectodally large incidences of severe skin rashes that often result in treatment cessation. This is where the gel/solution based products such as Axiron, Androgel, Testim, and Fortesta are increasingly popular. The overall male testosterone market, in particular for transdermal therapy, has been steadily increasing over the last 6 years as illustrated in the graph below.
Figure 8: Male testosterone market, US 2005-2011 (millions)
Source: Acrux February 2012 Presentation / IMS Data
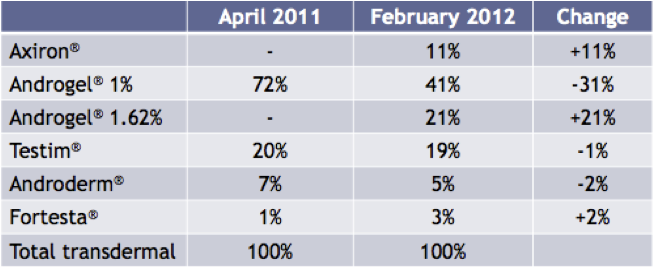
More importantly though is how Axiron has fared since coming onto the market in April 2011. As of February 2012, Axiron has achieved an 11% share of the transdermal market. Axiron’s main rival product in this market is another Big Pharma product Androgel, from Abbott Laboratories. In this same period, Androgel’s total share of the transdermal market has fallen by 10%, as illustrated in the chart below.
Figure 9: Share of Total Prescriptions of transdermal products in the USA
Source: Acrux February 2012 Presentation / IMS Data
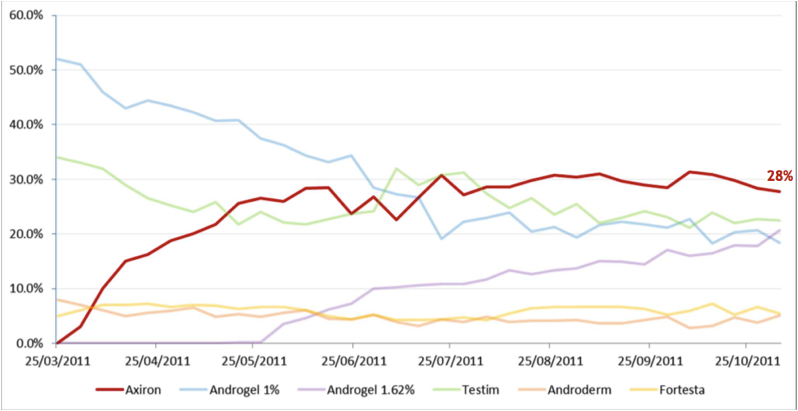
The following graph shows the different transdermal products in terms of their share of total new prescriptions for patients being initiated on treatment for the first time by specialists, or being switched from other products. The most obvious thing to note is how in a short space of time Axiron has become the most widely prescribed product, and that the percentage share of total new prescriptions for Androgel has been declining significantly.
Figure 10: Share of transdermal New to Brand Prescriptions by Specialists
Source: Acrux Novembery 2011 Presentation / IMS Data
It appears that the uptake of Axiron has been excellent, and has the potential to eat away an even larger chunk of the total transdermal market. A key advantage of Axiron over Androgel is that is applied to an area that is less likely to come into contact with other people. Androgel on the other hand is applied over the upper arms and shoulders, so has a much greater chance of being indirectly transferred to other people. Another advantage of Axiron is that you do not need to physically touch the solution with your hands, whereas with Androgel you do have to rub the gel directly onto the skin with your hands.
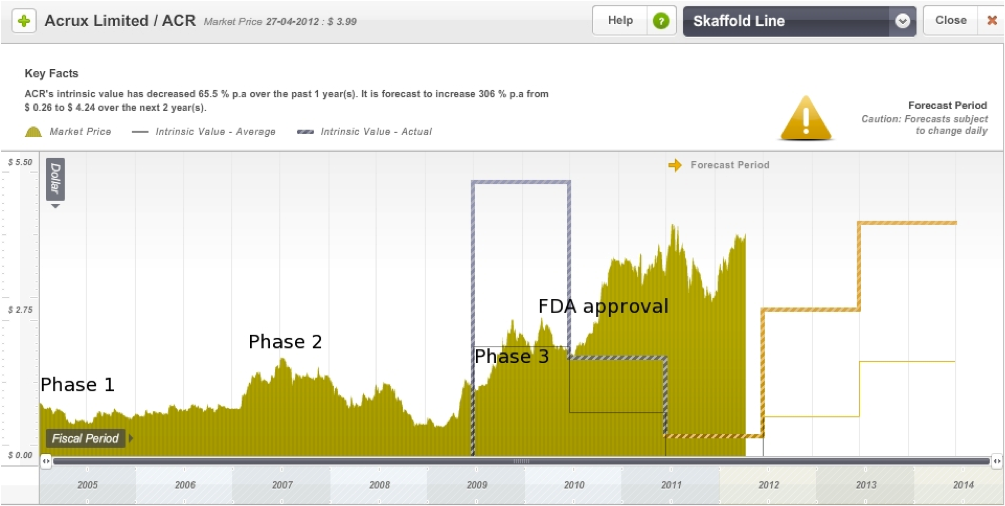
On the Skaffold line graph below I have roughly marked out the Phase 1, 2, and 3 announcement dates as well as the date of FDA approval for Axiron. Acrux is currently trading at a significant premium to intrinsic value, however the intrinsic value is expected to rise significantly in the next few years.
Figure 11: Acrux Skaffold Estimated Intrinsic Valuation line
Source: Skaffold 27 April 2012
SIRTEX (ASX:SRX)
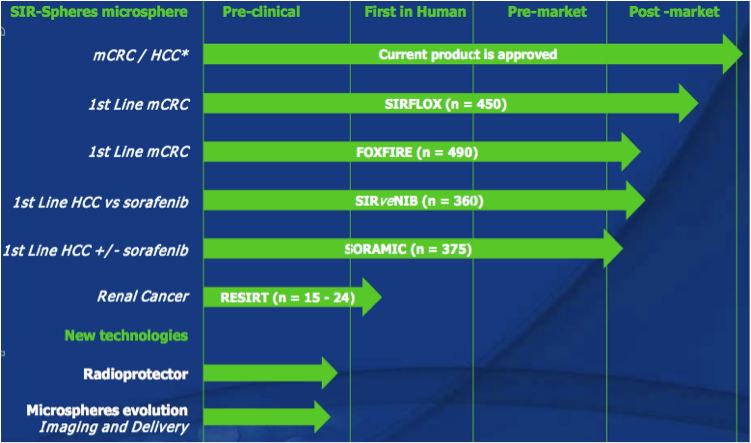
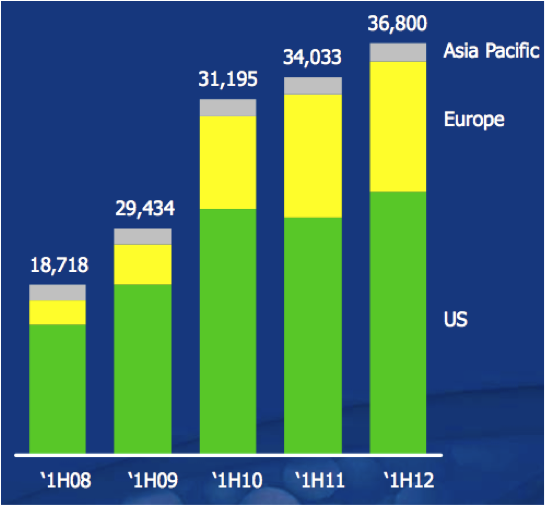
Sirtex has one product on the market, SIR-Spheres microspheres (let’s called it SIR-Spheres from now), which is a treatment option available for advanced hepatocellular carcinoma (“HCC”, liver cancer/tumour(s) that cannot be surgically removed), as well as for metastatic colorectal carcinoma (“mCRC”, bowel cancer that has spread to the liver, where the liver cancer/tumour(s) cannot be surgically removed). Sirtex also has a number of products or technologies in pre-clinical phase, although not a lot of information is available about them as they are at such an early phase.
Figure 12: Sirtex R&D pipeline
Source: Sirtex Company Presentation October 2011
SIR-Spheres is a radioactive treatment. Sirtex have developed micro-particles or beads (made from a substance called Resin) that act as transport vehicles for an isotope called Yttrium-90. An isotope is a radioactive chemical element. SIR-Spheres can be injected into the hepatic artery (the blood vessel that supplies the liver), once here the micro-particles get lodged into the walls of the small blood vessels that surround the tumour. This is a treatment that enables radiation to be given to a very localised area, without affecting normal liver tissue or other bodily organs. It is often referred to as selective internal radiation therapy (SIRT), or radioembolisation. It is a highly innovative product, although there is another company called Nordion that has something similar called TheraSphere. TheraSphere has micro-particles made from glass, but it also uses the Yttrium-90 isotope.
Radioembolisation is currently not used as first-line therapy. Let’s looks at HCC and mCRC separately to see exactly where it fits. For HCC, the first-line treatment for advanced inoperable cases, apart from liver transplantation, is a procedure called Radiofrequency Ablation (RFA). This is basically when a needle-like probe is passed into the tumour and an electrical current heats the probe resulting in the tumour tissue being heated up and destroyed. Where this is not possible, Transarterial Chemoembolisation (TACE) can be used. TACE is where chemotherapy is administered directly into the hepatic artery. SIR-Spheres radioembolisation could be used as an alternative to TACE. Having said that, with regards to SIR-Spheres, there is not yet enough clinical evidence or consensus with regards to when and whether to use SIR-Spheres over TACE. Systemic or traditional chemotherapy is used in more severe cases of HCC where there are multiple tumours or the other options are contraindicated in the patient. Systemic chemotherapy can also be associated with a lot of side effects. With mCRC involving the liver, where surgery is not an option, RFA is also used. Hepatic Intra-arterial (HIA) chemotherapy (similar to TACE) can be used as an alternate to systemic chemotherapy, although the benefits of this over newer systemic chemotherapy regimes have not yet been clearly demonstrated. Similarly, the benefits of SIR-Spheres over newer systemic chemotherapy regimes have not yet been clearly established either.
When SIR-Spheres was approved by the FDA, the control group in the Phase 3 trials was being given a systemic chemotherapy regime that has now been superseded by a more effective regime. The key downside to this product is therefore the lack of consensus as to when to use it and the lack of enough clinical evidence over existing treatments. SIR-Spheres has been approved for sale in Australia, Europe, and the USA. FDA approval was obtained in 2002, and this was the time of first commercial sale. So what has happened in the last 10 years? Well, they still have the same product, and the fact that it is still their only product is another downside risk, although they are working on number of clinical trials, with 4 major ones in clinical recruitment. These clinical trials are aimed at increasing the indications for use of the product, to see if they can find evidence to support it’s use in the earlier stages of cancer treatment, as first-line therapy or as an add-on to the newer systemic chemotherapy treatments. All that being said, Sirtex has steadily increased its revenues over the last 5 years.
Figure 13: Sales revenues (thousands)
Source: Sirtex February 2012 presentation
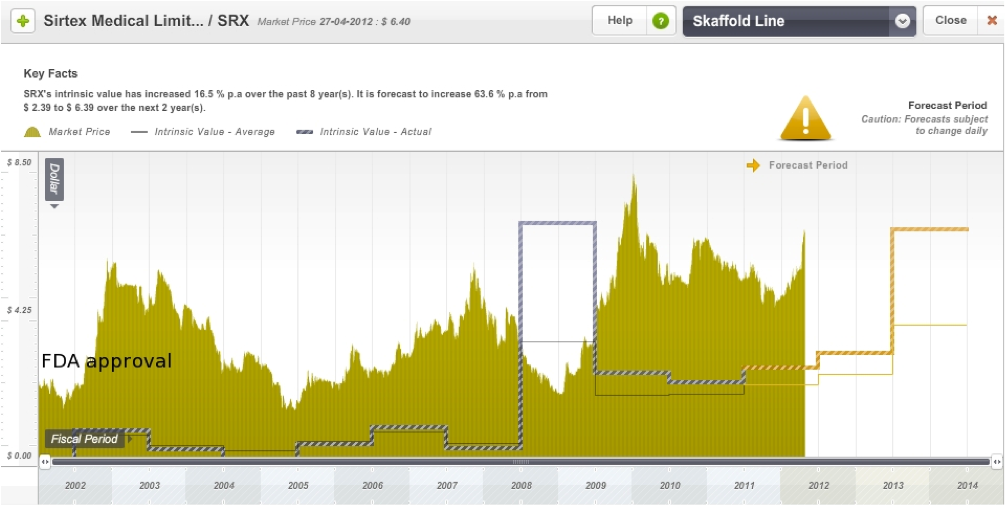
On the Skaffold line below I have roughly marked the date of FDA approval for SIR-Spheres. The share price of the company has been quite volatile over the years, but this is not uncommon in this industry. Like Acrux, it is also trading at a significant premium to its current intrinsic value, however its intrinsic value is also expected to rise in the next few years.
Figure 14: Sirtex Skaffold Estimated Intrinsic Valuation line
Source: Skaffold 26 April 2012
CONCLUSION
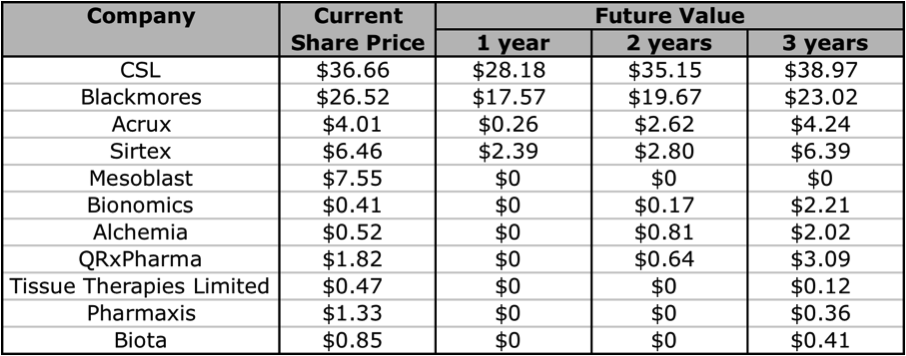
A decision as to whether to invest in either of these companies will require a deeper analysis of their management team, cash flows, debt levels, levels of return on equity, the strength and diversity of their pipeline’s, and industry competition. Unfortunately that is beyond the scope of this article. But if you are looking for an A1 company in this industry, you can’t go past CSL or Blackmores. Both are excellent companies that have had steadily rising intrinsic values for over 10 years. If you want to invest in a company at a much earlier stage, there are a few companies that are worth keeping an eye on. Aside from the 2 I have reviewed in this article, I think Bionomics, Alchemia, and QRxPharma are ones to add to your share portfolio watchlist. Below I have extracted some of the Skaffold data and listed the forecasted future intrinsic values of the companies whose intrinsic values are expected to rise in the next 1 to 3 years. Note: Biota has recently announced that it will be delisting from the ASX, and I have slotted in Mesoblast as an extra.
Figure 15: Currently Estimated Future Values
Source: Skaffold 1 May 2012
Posted for Praveen by Roger Montgomery, Value.able author, Skaffold Chairman and Fund Manager, 31 May 2012.
Do you ‘LIKE’ us?
by Roger Montgomery Posted in Health Care, Intrinsic Value, Skaffold.
- 17 Comments
- save this article
- 17
- POSTED IN Health Care, Intrinsic Value, Skaffold.
What does Roger Montgomery think of Gina Rinehart’s Fairfax shareholding?
Roger Montgomery
May 30, 2012
Learn Roger’s insights into the near-term future for Fairfax Media (FXJ) as Gina Rinehart increases her shareholding in this discussion with 2GB’s Ross Greenwood broadcast 30 May 2012. Listen here.
by Roger Montgomery Posted in Companies, Investing Education, Market Valuation, Radio.
- save this article
- POSTED IN Companies, Investing Education, Market Valuation, Radio.
Germany v France and the future of your SMSF.
Roger Montgomery
May 29, 2012
 “The more European leaders talked at a dinner last Wednesday, the grimmer Angela Merkel looked. One after another, they spoke out in favor of the joint assumption of debt and against the strict austerity course Berlin is calling for. The chancellor stared silently at the man who was responsible for this change of mood — France’s new president, François Hollande, who noted with satisfaction that there was “an outlook for euro bonds in Europe.”
Merkel disagreed, saying that euro bonds are not the right tool, but to no avail. Only a minority stood behind the German leader. Even European Council President Herman Van Rompuy said, at the end of the dinner, that there should be “no taboos,” and that he would examine the idea of euro bonds. “Herman,” Merkel blurted out, “you should at least say that some at this table are of a different opinion.”
…..
The fight has only just begun, and so it comes as no surprise that the roar of battle is drowning out everything else at the moment. But there are also signs of rapprochement. During his first official visit to Berlin, Pierre Moscovici, the new French minister of economics and finance, revealed some sympathy for the German line. He confirmed the new French government’s intention to reduce the national deficit in the coming year to below the upper limit of 3 percent of GDP, and to eliminate all new borrowing starting in 2017. He also underscored how important healthy budgets are for growth and employment. Those who have too much debt become impoverished, he said. And those who are poor, he added, cannot invest.”
From: http://www.spiegel.de/international/europe/merkel-preparing-to-strike-back-against-hollande-with-six-point-plan-a-835295.html
I like Greg’s post on this subject here on the Insights Blog earlier today:
“With respect to Eurobonds, investors should understand that what is really being proposed is a system where all European countries share the collective credit risk of European member countries, allowing each country to issue debt on that collective credit standing, but leaving the more fiscally responsible ones – Germany and a handful of other European states – actually obligated to make good on the debt.
This is like 9 broke guys walking up to Warren Buffett and proposing that they all get together so each of them can issue “Warrenbonds.” About 90% of the group would agree on the wisdom of that idea, and Warren would be criticized as a “holdout” to the success of the plan. You’d have 9 guys issuing press releases on their “general agreement” about the concept, and in his weaker moments, Buffett might even offer to “study” the proposal. But Buffett would never agree unless he could impose spending austerity and nearly complete authority over the budgets of those 9 guys. None of them would be willing to give up that much sovereignty, so the idea would never get off the ground. Without major steps toward fiscal union involving a substantial loss of national sovereignty, the same is true for Eurobonds.”
At worst your SMSF hangs in the balance. At best expect a wild ride.
Posted by Roger Montgomery, Value.able author, Skaffold Chairman and Fund Manager, 29 May 2012.
by Roger Montgomery Posted in Global markets, Market Valuation.
- 11 Comments
- save this article
- 11
- POSTED IN Global markets, Market Valuation.
Will the Aussie Dollar slide bring pain relief for Aussie exporters?
Roger Montgomery
May 29, 2012
Roger Montgomery provides his Value.able insights into the depreciation of the Australian dollar and its implications for business in this Herald-Sun article published 29th May 2012. Read here.
by Roger Montgomery Posted in In the Press, Value.able.
- READ
- save this article
- POSTED IN In the Press, Value.able.
Were investors hasty?
Roger Montgomery
May 28, 2012
 It’s true that many Australian businesses are on their own path and even amid the financial tempest raging in Europe there will be companies that succeed.
Conversely there will many that fail.
I have maintained that beating the market can be made simpler by sticking to high quality issues.
Skaffold’s A1’s, I believe, have the lowest probability of ‘catastrophe’ within a year or two of receiving their score. Of course, you have to realise that business is dynamic and Skaffold’s quality scores will change with new information.
Furthermore, having the lowest probability of catastrophe is not to say there is zero chance of catastrophe. A 100-to-1 nag at Moonee Valley might still win the race.
Nevertheless, I would however rather have a diversified portfolio of A1s and A2s than a portfolio of C5s.
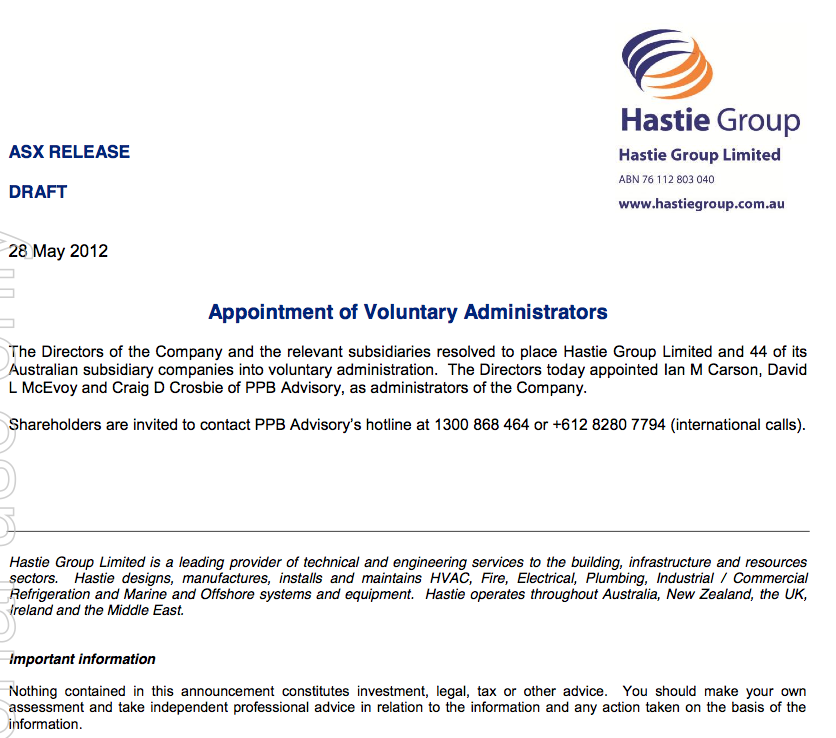
And this brings me to today’s announcement that Hastie Group has voluntarily appointed Administrators, just three days after the company announced accounting irregularities would result in a charge to profits of $20 million.
Hastie Group Limited (HST) has today announced that it has been placed into voluntary administration. Many investors will lose any and all the money they had invested in the company. If you are retired or about to retire, you can least afford such a permanent impairment to your capital.
I get so frustrated when I hear young advisers telling people on air to ‘only use money they can afford to lose’. I don’t know about you, but I cannot afford to lose any!
And that’s were quality comes into its own. Skaffold was designed to mitigate the risk of investing in those companies where the risk of events like the appointment of administrators is highest.
Skaffold’s quality scoring is based on decades of international academic research into forecasting collapses. And for us it just works.
At Montgomery Investment Management the Quality of a company is our first filter. A high Quality Score is the cornerstone to our investment strategy as well as the core of our investment decision-making. The second step is value. We reduce risk even further when we buy high quality companies only when they are at sharp discounts to intrinsic value.
Hastie listed on the ASX in 2005 and enthusiasm for its shares once pushed the market value of the company to $500 million and to a share price – just before the GFC – of more than $40.
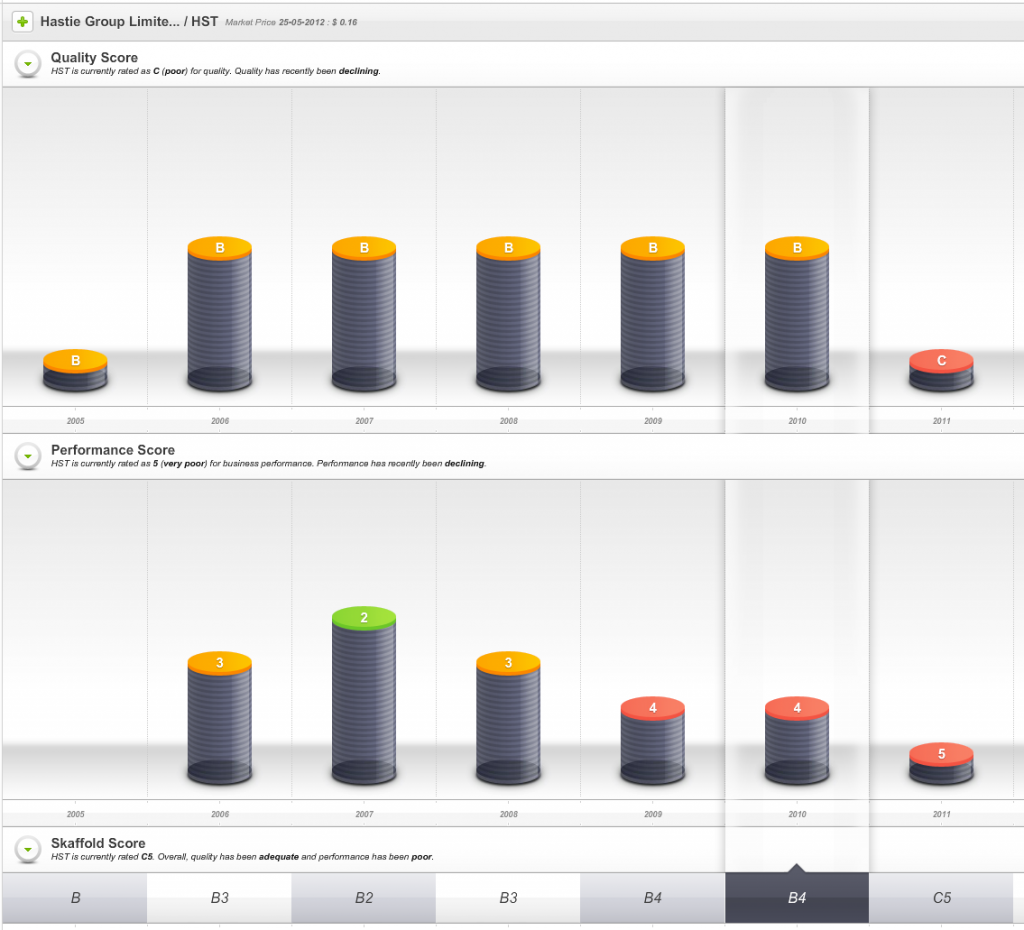
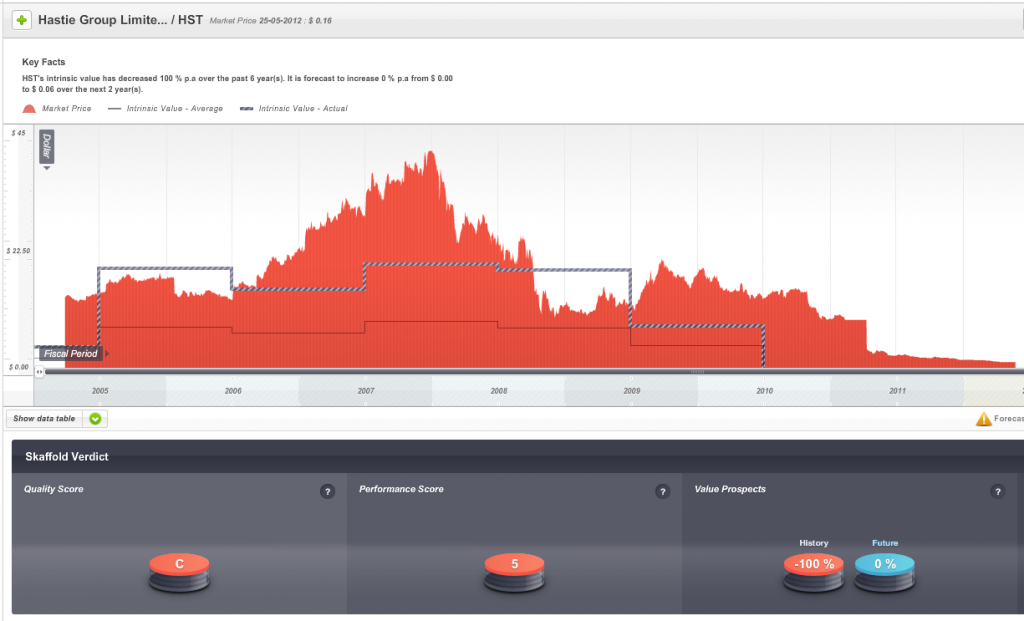
So, one sign of impending danger was that from 2009 onwards the company’s Quality Score dropped well below investment grade.
Fig 1. Skaffold Quality Score History since listing. (International Patents Pending). Hastie Group
The second warning was that the company’s shares, when they were at the height of their popularity were trading well above intrinsic value and intrinsic value was not rising at a satisfactory rate.
Fig 2. Skaffold Line. Hastie Group. (International Patents Pending). Expensive in 2006-2008 and flat and declining intrinsic value from 2007.
For many investors Figs 1 and 2 might be enough to turn the page and look to invest elsewhere. For those with more than a cursory interest however, Skaffold opens a window to the performance of the company.
As Fig 3 reveals, the company was reporting profits but even rising levels of debt failed to stem declining returns on equity.
Fig 3. Skaffold Capital History (International Patents Pending). Hastie Group. Note declining blue line (ROE) despite rising red columns (debt) and rising green line (profits)).
And weak cash flows (Fig 4.) as measured by Skaffold’s Funding Gap (the green line was below zero every year since listing) ensured the company would never meet all of our investment criteria.
Fig 4. Skaffold Cash Flow (International Patents Pending). Hastie Group. (note the green line (Funding Gap/Surplus) is almost always negative – biting off more than it can chew?
Finally, I note that Skaffold does something I reckon is positively spectacular. Using the Cash Flow Evaluate Screen in Fig 4. above as an example, Skaffold’s computing engine converts the chart to plain and natural English! Its a simple paragraph that explains in easy-to-understand terms precisely what you are looking at. Imagine that being updated live for every screen and for every listed stock! Have a read…
Fig 5. Skaffold’s Auto-generated plain language Cash Flow Screen description. (International Patents Pending)
Avoid potential disasters with Skaffold’s Quality Scores.
Skaffold consistently identified HST as expensive or poor quality or both.
For investors who seek to give themselves every opportunity to avoid the landmines, Skaffold’s timely assessment of HST’s poor investment quality represents the kind of early warning signal you need.
Decades of academic research into the study of corporate failure are the backbone of Skaffold. Isn’t it time you made Skaffold your portfolio’s most important investment?
To find out more about how Skaffold can help you avoid potential disasters such as Hastie Group Limited and best protect your portfolio in preparation for the future contact Donna at Skaffold on (02) 9692 5750 or register to attend the next Skaffold online webinars from the complete comfort of your own home, office or combine harvester.
Posted by Roger Montgomery, Value.able author, Skaffold Chairman and Fund Manager, 28 May 2012.
by Roger Montgomery Posted in Investing Education, Skaffold.
- 11 Comments
- save this article
- 11
- POSTED IN Investing Education, Skaffold.
Has Wesfarmers got it right?
Roger Montgomery
May 28, 2012
 In writing Value.able I wanted to explain return on equity almost as much as I wanted to introduce the idea of future intrinsic value estimates and Walter’s intrinsic value formula.
From Value.able, PART TWO, The ABC of Return on Equity:
Return on equity is essential for value investors for so many reasons and Wesfarmers purchase of Coles was a great case study:
“In 2007, Wesfarmers had Coles in its sights. In that same year, Coles reported a profit of about $700 million. In its balance sheet from the same year, Coles reported about $3.6 billion of equity in 2006 and $3.9 billion of equity at the end of 2007. For the purposes of this assessment we will accept that the assets are fairly represented in the balance sheet. Using only these numbers we can estimate that the return on average equity of Coles was around 19.9 per cent.
Importantly, Coles has been around a long time, is stable, very mature and established and supplies daily essentials. While its prospects may not be exciting, there is the possibility that Wesfarmers may improve the performance of the Coles business.
So the target, Coles, is a business with modest debt and $3.9 billion of good-quality equity on the balance sheet that generated a 19.9% return. The simple question is: What should Wesfarmers pay for Coles? If it gets a bargain, it will add value for the shareholders of their business. If it pays too much, it will do the opposite – destroy value and perhaps its reputation.
Now, if you were to ask me what to pay for $3.9 billion of equity earning 19.9 per cent (assume I can extract some improvements), I would start by asking myself what return I wanted. If I were to demand a 19.9 per cent return on my money, I would have to limit myself to paying no more than $3.9 billion. If I was happy with half the return, I could pay twice as much. In other words, if I was happy with a 10 per cent return, which I think is reasonable, I could pay $7.8 billion, or two dollars for every dollar of equity. And finally, if I think that I could do a much better job than present management, I could pay a little more, $9.75 billion perhaps.
Now suppose you consider yourself much better at running Coles than the present Coles management. Remember, this is one of the motivators for acquisitions. Suppose you believe that you can achieve a sustainable 30 per cent return on equity. Assume you were seeking a 10 per cent return on your investment – a modest return by the way, but justified by the risks involved.
The basic formula to calculate what you should pay for a mature business, like Coles, is:
Return on Equity/Required Return x Equity
Using this formula the estimated value of Coles is:
0.3/0.1 x 3.9 = $11.7 billion
Even if I thought I was a brilliant retailer, I would not want to pay more than $11.7 billion for Coles. Given the risks, I may want a higher required return than 10 per cent. If I demanded a 12 per cent required return, I would not pay more than $9.75 billion (0.3/0.12 x 3.9 = $9.75).
I will explain this formula, which represents the work of Buffett, Richard Simmons and Walter in more detail in Chapter 11 on intrinsic value.
Of course, if we think that the balance sheet is overstating the value of the assets, the result would be a lower equity component and a higher return on equity. As Buffett stated:
Two people looking at the same set of facts, moreover – and this would apply even to Charlie and me – will almost inevitably come up with at least slightly different intrinsic value figures.
The result will be modestly different but the conclusion will be the same.
With around 1.193 billion shares on issue, the above estimates suggest Coles might have been worth between $8.17 and $9.80 per share.
Now, what did Wesfarmers announce they would pay for Coles? The equivalent of about $17 per share!
What do you think would happen to your return on equity if you paid the announced $22 billion for a bank account with $3.9 billion deposited earning 19.9 per cent? Your return on equity would decline precipitously to around 3.5%.”
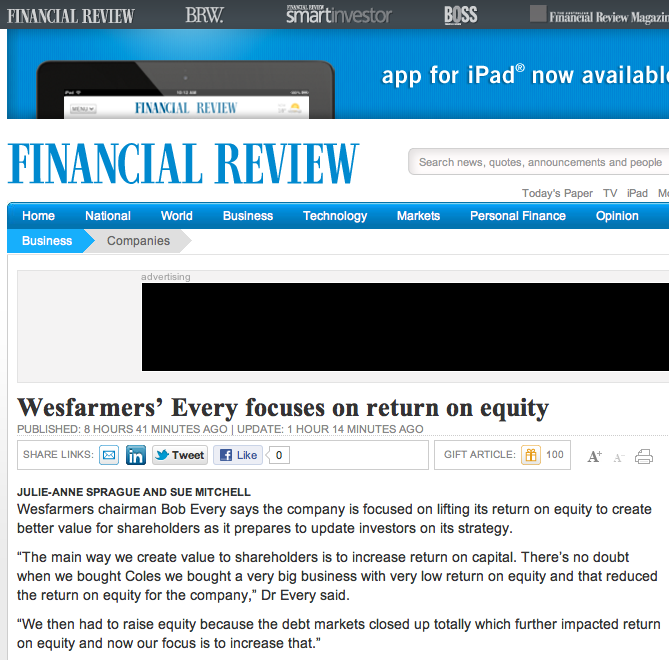
With that in mind I wonder whether the comments Wesfarmers were reported today to have made to The Financial Review (see image, I subscribe and think its great) were complete. Of particular interest is the paragraph; “The way we create value to shareholders is to increase return on capital. There’s no doubt when we bought Coles we bought a very big business with very low return on equity and that reduced the return on equity for the company.”
Assuming the comments and statistics are correct, I would argue that the reason for the decline in Wesfarmer’s Return on Equity is not because Coles had a low ROE – as Wesfarmers are reported to have suggested – but because Wesfarmers simply paid too much for Coles. Do you agree or disagree?
What are your thoughts?
Posted by Roger Montgomery, Value.able author, Skaffold Chairman and Fund Manager, 28 May 2012.
by Roger Montgomery Posted in Companies, Consumer discretionary, Skaffold, Value.able.
- 20 Comments
- save this article
- 20
- POSTED IN Companies, Consumer discretionary, Skaffold, Value.able.
How close for Europe?
Roger Montgomery
May 27, 2012
Important viewing for the start of the week. Here’s the link if you’d like to view it at its source: http://www.cbc.ca/video/swf/UberPlayer.swf?state=sharevideo&clipId=2239470660&width=480&height=322
Posted by Roger Montgomery, Value.able author, Skaffold Chairman and Fund Manager, 27 May 2012.
by Roger Montgomery Posted in Value.able.
- 10 Comments
- save this article
- 10
- POSTED IN Value.able.
My…Err?
Roger Montgomery
May 27, 2012
Investors don’t have to have astronomic IQ’s and be able to dissect the entrails of a million microcap startups to do well. You only need to be able to avoid the disasters.
In an oft-quoted statistic, after you lose 50% of your funds, you have to make 100% return on the remaining capital just to get back to break even. This is the simple reasoning behind Buffett’s two rules of investing. Rule number 1 don’t lose money (a reference to permanent capital impairment) and Rule Number 2) Don’t forget rule number 1! Its also the premise behind the reason why built Skaffold.
Avoiding those companies that will permanently impair your wealth either by a) sticking to high quality, b) avoiding low quality or c) getting out when the facts change, can help ensure your portfolio is protected. Forget the mantra of “high yielding businesses that pay fully franked yields” – there’s no such thing. That’s a marketing gimmic used by some managers and advisers to attract that bulging cohort of the population – the baby boomers – who are retiring en masse and seeking income.
Think about it; How many businesses owners would speak about their business in those terms? “Hi my name is Dave. I own an online condiments aggregator – ‘its a high yielding business that pays a fully franked yield’. You will NEVER hear that from a business owner. That only comes from the stock market and from those who have never owned or run a business.
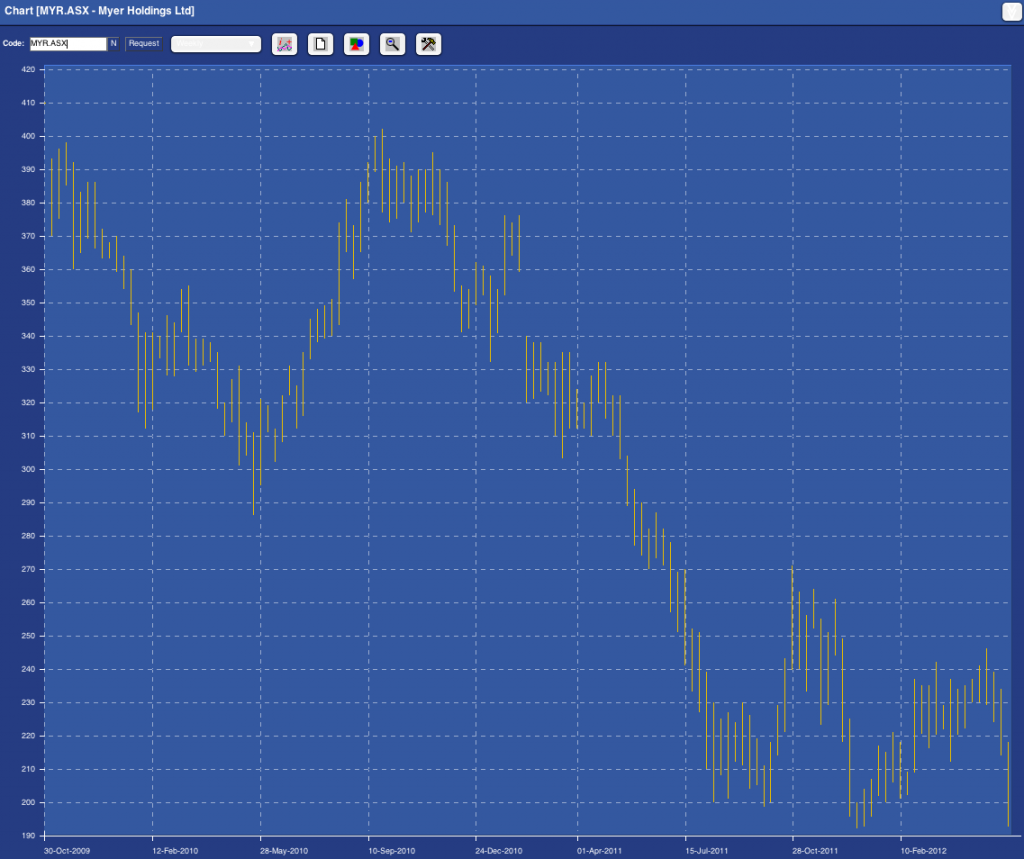
They key is not to think about stocks or talk stock jargon. Just focus on the business. Thats what we did when Myer floated in 2009. And with the market value of Myer now 50% lower than the heady days of its float, it might be instructive to revisit the column I wrote back on 30 September 2009, when I reviewed the Myer Float.
And sure, you can say that the slump in retail is the reason for the slump in the share price of Myer (I am certainy one who believes that the dearth of really high quality companies means multi billion dollar fund managers are bereft of choice meaning that a recovery in the market will make all stocks rise – not because they are worth more but because fund managers have nothing else to buy). But the whole point of value investing is to make the purchase price so cheap that even if the worst case scenario transpires, you are left with an attractive return.
It would be equally instructive to review the reason why we didn’t buy the things that subsequently went well (QRN comes to mind) so we’ll leave that for a later date.
Here’s the column from September 2009:
“PORTFOLIO POINT: The enthusiasm surrounding the Myer float is good reason for a value investor to stay clear. So is the expected price.
With more than 140,000 investors registering for the IPO prospectus, everyone wants to know whether the float of the Myer department store group will be attractive. This week I want to focus exclusively on this historic offer.
At present it is suggested the stock will begin trading somewhere between $3.90 and $4.90.
The prospect of a stag profit draws a self-fulfilling crowd. But if chasing stag profits is your game, I would rather be your broker than your business partner, for history is littered with the remains of the enthusiasm surrounding popular large floats.
Popularity, you see, is not the investment bedfellow of a bargain and being interested in stocks when everyone else is does not lead to great returns. You cannot expect to buy what is popular, travel in the same direction as lemmings and generate extraordinary results. Conversely thumb-sucking produces equally unattractive returns.
Faced with these truisms, I lever my Myer One card, obtain a prospectus and open it for you.
The Myer float is one of the hottest of the year and I am not referring to the cover adorned by Jennifer Hawkins! If those 146,000 people who have apparently registered for a Myer prospectus were to invest just $20,000 at the requested price, the vendors will have their $2.8 billion plus the $100 million in float fees in the bag.
A word about the analysis: It is the same analysis I have used to buy The Reject Shop at $2.40 (today’s close $13.35), JB Hi-Fi at $8 ($19.86), Fleetwood at $3.50 ($8.75), to sell my Platinum Asset Management shares at more than $8 on the morning they listed (at $5), and to warn investors to get out of ABC Learning at $8 (they were 54¢ when ABC delisted in August 2008) and Eureka Report subscribers to get out of Wesfarmers as it acquired Coles.
I don’t list these to boast but merely to demonstrate the efficacy of the analysis; analysis that is equally applicable to existing issues and new ones.
By way of background, TPG/Newbridge and the Myer Family acquired Myer for $1.4 billion three years ago. They copped flack for paying too much, but “only” used $400 million of their own capital; the remainder was debt. Before the first anniversary, the Bourke Street, Melbourne, store was sold for $600 million and a clearance sale reduced inventory and netted $160 million. The excess cash allowed the new owners to reduce debt, pay a dividend of almost $200 million and a capital return of $360 million. Within a year the owners had recouped their capital and obtained a free ride on a business with $3 billion of revenue. Good work and smart.
But I am not being invited to pay $1.4 billion, which was 8.5 times EBIT. I am being asked to pay up to $2.9 billion, or more than 11 times forecast EBIT. And given the free “carry”, the bulk of the money raised will go to the vendors while I replace them as owners. Ownership is a very good incentive to drive the performance of individuals.
And driven they have been. In three years, $400 million has been spent on supply chain and IT improvements, eight distribution centres have been reduced to four and supply-chain costs have fallen 45%. Amid relatively stable gross profit margins, EBIT margins improvement to 7.2% and a forecast 7.8% reflect disciplined cost identification and management. Fifteen more stores are planned for the next five years and the prospectus notes that trading performance improved significantly in the second half of 2009 and into the first half of 2010. The key individuals have indeed performed impressively, but with less skin in the game they may not be incentivised as owners in future years as they have been in the past.
And what value have all these improvements created? The vendors would like to believe about $1.4 billion, and if the market is willing to pay them that price, they will have been vindicated, but price is not value and I am interested simply in buying things for less than what they are worth.
In estimating an intrinsic value for Myer, I will leave aside the fact that the balance sheet contains $350 million of purchased goodwill and $128 million of capitalised software costs. This latter item is allowed by accounting standards but results in accounts that don’t reflect economic reality. Historical pre-tax profits have thus been inflated.
I will also leave aside the fact that the 2009 numbers and 2010 forecasts have also been impacted by a number of adjustments, including the addition of sales made by concession operators “to provide a more appropriate reference when assessing profitability measures relative to sales”; the removal of the incentive payments to retain key staff – not regarded as ongoing costs to the business; costs associated with the gifting of shares to employees; and, most interestingly, the reversal of a write-off of $21 million in capitalised interest costs – all regarded as non-recurring.
Taking a net profit after tax figure for 2010 of $160 million and assuming a 75% fully franked payout, we arrive at an owners’ return on equity of about 28% on the stated equity of $738 million, equity that could have been higher after the float if $94 million in cash wasn’t also being taken out of retained profits. Using a 13% required return, I get a valuation of $2.90.
Looking at it another, albeit simplistic way, I am buying $738 million of equity that is generating 28%. If I pay the requested $2.9 billion for that equity or 3.9 times, I have to divide the return on equity by 3.9 times, which produces a simple return on “my” equity of 7.2%. For my money, it’s just not high enough for the risk of being in business.
Importantly, the return on equity – based on the simple assumptions that three stores, each generating $40 million in sales will be opened annually over the next five years and that borrowings will decline by $60 million in each of those years – should be maintained. But the end result is that the valuation only rises by 6% per year over the next five years and delivers a value in 2015 of $3.90: the price being asked today.
My piece of Myer seems a bit hot for My money.”
That was 2009. Has anything really changed? Has the following chart reveals. Myer is now trading at close to Skaffold’s current estimate of its intrinsic value. Before you get too excited (although the shortage of large listed high quality retailers means even this company’s shares may go up in a market or economy recovery) take a look at the pattern of intrinsic values in the past and the currently anticipated path of forecast intrinsic values; Past intrinsic values have been declining (generally undesirable unless forecasts for a recovery are correct) and forecast intrinsic values are flat.
Fig.1. Skaffold Myer Intrinsic Value Line
And as the Capital History chart reveals, 2014 profits are not expected to be better than 2010. That 4 years without profit growth. Question: Would you buy an unlisted business (as a going concern) that was not forecasting profit growth for four years?
Fig. 2. Skaffold Myer Capital History Chart
Finally the cash flow chart reveals the company has produced what Skaffold refers to as a Funding Gap. Its cash from operations have not been enough to cover the investments it has made in others or itself plus the dividends it has paid. In other words for 2010 and 2011, the two financial years it has registered as a listed company, it appears from Skaffold’s data that the company has had to dip into either 1) its own bank account, or 2) borrow more money or 3) raise capital (the three sources of funds available if a funding gap is produced) to cover this “gap”.
Fig. 3. Skaffold Myer Cash Flow Chart
I’d be interested to know if you are a loyal Myer shopper or not and why? If you don’t shop at Myer, why not? If you do shop at Myer, what do you like about the company, its stores and the experience? And I am particularly interested to hear from anyone who DOES NOT shop there but DOES own the stock!
Posted by Roger Montgomery, Value.able author, Skaffold Chairman and Fund Manager, 27 May 2012.
by Roger Montgomery Posted in Companies, Consumer discretionary, Value.able.
- 14 Comments
- save this article
- 14
- POSTED IN Companies, Consumer discretionary, Value.able.
Why is BHP less than a sure-fire thing?
Roger Montgomery
May 26, 2012
In The Australian Roger Montgomery discusses why the laws of supply and demand suggest demanding times ahead for mining companies. Read here.
by Roger Montgomery Posted in Energy / Resources, In the Press, Investing Education.
Why does Roger Montgomery think Qantas’ accountants are so creative?
Roger Montgomery
May 23, 2012
Learn Roger’s Value.able insights into the recent Qantas corporate restructure in this discussion with Radio 2GB’s Ross Greenwoood broadcast on 23rd May 2012. Listen here.
by Roger Montgomery Posted in Investing Education, Radio, Value.able.
- save this article
- POSTED IN Investing Education, Radio, Value.able.
