Financial Services
-
The cold war in accounting oversight heats up
David Buckland
December 12, 2012

Over the past decade many Chinese-based companies have listed in the US. For the larger stocks, such as PetroChina, China Mobile and CNOOC, the American Deposit Receipt (ADR) represents a secondary listing, and often Hong Kong is the primary place of listing.
However for about 200 smaller stocks (with an aggregate market capitalisation of US$84 billion), the US is their primary market.
by David Buckland Posted in Financial Services, Global markets.
- save this article
- POSTED IN Financial Services, Global markets
-

WBC: 1, NAB: 0. 100% out-performance in 10 years
Roger Montgomery
November 7, 2012

Westpac’s results for the year to September 2012 reinforced the ongoing challenges National Australia Bank is suffering from its Clydesdale and Yorkshire banking subsidiaries. In terms of cash earnings, Westpac’s $6.6b is 21% higher than NAB’s $5.443b. Both companies had average shareholders’ funds of $43b in the year to September 2012 however Westpac’s cash earnings to average shareholders’ funds ratio was 2.7% higher than NAB’s at 15.35%.
continue…by Roger Montgomery Posted in Financial Services.
- 1 Comments
- save this article
- POSTED IN Financial Services
-
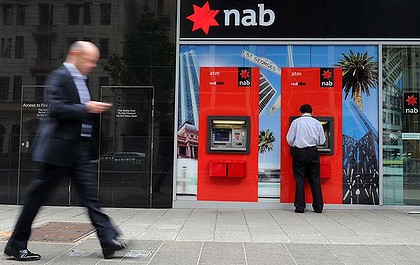
National Australia Bank – ongoing challenges
David Buckland
November 1, 2012
National Australia Bank continued to suffer ongoing challenges from their Clydesdale and Yorkshire Banking subsidiaries, with reported net cash earnings for the year to 30 September 2012 declining by 0.5% to $5.443b. After contributing GBP183m in the previous year, NAB’s UK operations lost GBP139m. Charges for bad and doubtful debts soared by $793m to $2.6b. While average shareholders’ funds increased 7% to $43b, cash earnings on average shareholders’ funds declined by nearly 1.0% to 12.6%.
While the 7.0% dividend yield is attractive for retail investors, the National Australia Bank share price has been an enormous disappointment over the past decade and shareholders with long memories must be questioning the diversifications strategy which saw the purchase of Clydesdale Bank, Northern Bank (in Northern Ireland), National Irish Bank (in the Republic of Ireland), Yorkshire Bank and the US-based Home Side.
From Montgomery’s viewpoint, National Australia Bank received a B4 quality rating in 2004, and this was reaffirmed in 2007 and 2008. Its current quality rating is A4.

by David Buckland Posted in Financial Services.
- 2 Comments
- save this article
- POSTED IN Financial Services
-

MEDIA
What is Russell Muldoon’s outlook on Commodities?
Roger Montgomery
October 17, 2012
Do CSL (CSL, Silverlake (SLR), FKP (FKPDA), Breville Group (BRG), Codan (CDA), QBE Insurance (QBE), NAB (NAB), Wesptac (WBC), AMP (AMP), ALS (ALQ), Prima (PRR), Rio Tinto (RIO), Lynas (LYC), or Mesoblast (MSB) achieve the coveted A1 grade? Watch this edition of Sky Business’ Your Money Your Call 17 October 2012 program now to find out, and also learn Russell’s insights into the commodities sector. Watch here.
by Roger Montgomery Posted in Companies, Financial Services, Insightful Insights, Intrinsic Value, TV Appearances.
-
MEDIA
What are Tim Kelley’s insights into the Australian Banks?
Tim Kelley
October 10, 2012

Do Ten Network (TEN), Seven West Media (SWM), Aurora Oil (AUT), Origin Energy (ORG), Santos (STO), Cedar Woods (CWP), Slater and Gordon (SGH), IMF (IMF), Roce Oil (ROC), The Reject Shop (TRS), Challenger (CGF), Bluescope (BSL) or Adelaide Brighton (ABC) achieve the coveted A1 grade? Watch this edition of Sky Business’ Your Money Your Call 10 October 2012 program now to find out, and also hear Tim’s thoughts on the big Aussie banks. Watch here.
by Tim Kelley Posted in Companies, Financial Services, Insightful Insights, TV Appearances.
-

WHITEPAPER
THE PROPERTY RUG PULL
Discover how proposed changes to negative gearing, Capital Gains Tax and holiday home tax rules could reshape property investing, and why investors may consider private credit as property returns become less certain and tax advantages diminish.
READ HERE -
MEDIA
What are Roger’s latest insights into Leighton’s and NAB?
Roger Montgomery
August 15, 2012
Roger provides his Value.able insights into Leighton Holdings (LEI) and National Australia Bank (NAB) to Ticky Fullerton in this edition of ABC1’s “The Business” braodcast 14 August 2012. Watch here.
by Roger Montgomery Posted in Companies, Financial Services, TV Appearances.
- save this article
- POSTED IN Companies, Financial Services, TV Appearances
-
The Weekly Kick Off: Is Australia THAT expensive?
Roger Montgomery
July 23, 2012

My Thoughts from the weekend:
A year ago we felt like Churchill – a voice in the wilderness – when we said Iron Ore prices could get ugly. On Friday they did….again. But more on that another time.
The number of overseas visitors we are meeting that tell us Sydney and Australia are “expensive” has got me thinking that Australians and Australia really needs to take advantage of the high Aussie dollar while it lasts.
Feeding ten people in Thailand at a local restaurant and ordering entree, mains and dessert for everyone as well as cocktails, beers, wine and mocktails for the kids amounts to 2000 baht or A$65.00. Thats a main course, a glass of water and a side of fries in Sydney. Its not surprising then to see so many Chinese, Russian and British tourists taking advantage of Thai hospitality.
Thinking about British investors; some have, over their lifetime, amassed, a million pounds. You would think that anyone in this position would be thinking “I’ve made it!” But they can now look forward to retirement with their next egg earning…wait for it… £7,500 per year! No wonder the UK student one of my colleagues is billeting here in Sydney has complained about how expensive Sydney is. The same might be said by Japanese tourists who are likewise earning less than 1% interest on their lifetime savings.
And last week I entertained two Singaporean investment professionals that couldn’t believe how expensive our harbour city had become for them. Coming from Singaporeans and Londoners, that’s really saying something.
These examples may only be anecdotes but my experience as an unconventional investor has taught me that aggregated anecdotes equals the whole.
Australia is uncompetitive.
I just bought a pair of italian shoes online and initially baulked before handing over my credit card details because the price was presented in Euros. But after doing the conversion I realised the depression in Spain (and it IS a depression) had opened another door for Australian shoppers looking for bargains (they have long enjoyed the bargains offered by the US). Additionally another nail has been driven into the coffins of Australia’s department stores.
It’s not often I can clearly see the headline many years in advance but unless our Australian dollar falls back to US70 cents the headlines will read: DJ’s and MYER are now in Run Off!!!!! Even a merger of the two wouldn’t help.
But hope for Australian retailers may be on the horizon. In the last week a consulting exploration geologist and an asset management consultant – both consulting to BHP, RIO, and others – have told me that projects are being shelved and deferred at a rapid pace. In some cases only from Q3 and Q4 to 2013 initially. In other cases, where the miners were shouting only six months ago (when we were writing our bearish opinions on Iron Ore and China); “get as many drills and people as you can, just get it done”, they are now saying “we may look at it again in a couple of years.”
Meantime American banks have been aggressive in cleaning up their banking system. The Economist notes that “the five biggest banks wrote off more almost $500 billion in the aftermath of the financial crisis and raised $318 billion in fresh capital.” No eurozone bank has yet set aside more than $30 billion.
In short I don’t believe a high Aussie dollar can be sustained – at least against the US (unless Agriculture can meet the slack from lower materials prices). And lest you want to be a tourist that complains of high prices when travelling abroad in the future, you need to think about how the above influences will impact your buying power.
The other thing that has caught my attention is the massive growth that will occur in superannuation. Currently there is $1.3 trillion and assuming certain growth rates, expect it to hit $4 trillion in fifteen years. The demographics will ensure that from 2028 (perhaps a couple of years later because of the change from 9% to 12% contributions) we will start seeing outflows putting pressure on inflows. But in the meantime the impact of this? Not enough high quality listed companies, prices of high quality listed companies being the only ones to sustain high price earnings multiples and lots of business for underwriters and Equity Capital Markets execs as a flood of baby boomers float their businesses to meet the tidal wave of superannuation money. Oh and expect a lot more investment into offshore stock markets and international fund managers like Magellan.
That latter point could be another reason to take advantage of a strong Aussie dollar now.
by Roger Montgomery Posted in Energy / Resources, Financial Services.
-
Co-ordinated easing – Chinese exports to slow?
Roger Montgomery
July 10, 2012

Early Friday morning Australian time saw coordinated easing from three of the World’s largest central banks. Firstly, the Bank of England raised their asset purchase target from GBP325 billion to GBP375 billion. Then the People’s Bank of China cut the one-year lending rate by 0.31 per cent to 6.0 per cent and the one-year deposit rate by 0.25 per cent to 3.0 per cent. China’s June Quarter GDP data is due out this Friday 13 July. Finally, the European Central Bank cut its main rate by 0.25 per cent to a record low 0.75 per cent.
ECB President Mario Draghi told reporters risk to the outlook remain “on the downside”. The European Union is China’s largest export market. At some stage this slowdown will weigh on China’s exports, which account for 40% of its GDP.
by Roger Montgomery Posted in Financial Services, Market Valuation.
-
What do the most widely held stocks in Australia all have in common?
Roger Montgomery
June 29, 2012
EXCLUSIVE CONTENT
subscribe for free
or sign in to access the articleby Roger Montgomery Posted in Financial Services, Skaffold, Value.able.
- 9 Comments
- save this article
- POSTED IN Financial Services, Skaffold, Value.able
-
MEDIA
Will Perpetual recapture the glory days?
Roger Montgomery
June 25, 2012
With 580 jobs to go, Perpetual is attempting to cut its way back to exceptional performance – however Roger Montgomery discusses why its glory days will be hard to recapture in this interview broadcast on ABC’s The Business on 25 June 2012. Watch here.
by Roger Montgomery Posted in Financial Services, TV Appearances.
- save this article
- POSTED IN Financial Services, TV Appearances
