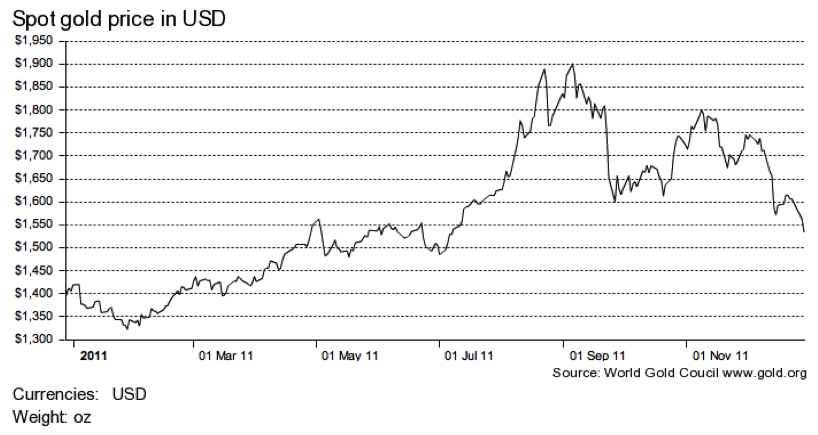
Their is something prescient in the name John Deason and Richard Oates gave to their 1869 gold nugget the ‘Welcome Stranger’ and the one Kevin Hillier gave to his 875 troy ounce find ‘The Hand of Faith’. Today’s gold price is indeed very welcome to gold bugs and there is plenty of faith needed that prices will rise even further. But gold bugs have received a terse warning from none other than Warren Buffett who has just released Berkshire’s 2011 letter. For those of you who believe gold (A.K.A. the barbarous relic) is the best investment you won’t find any more support from Warren this year than any other (with the exception of his 1999 dalliance into silver) . You can find his complete letter here: Berkshire 2011 Annual Report.
Here’s the section on gold:
“The second major category of investments involves assets that will never produce anything, but that are purchased in the buyer’s hope that someone else – who also knows that the assets will be forever unproductive – will pay more for them in the future. Tulips, of all things, briefly became a favorite of such buyers in the 17th century.
This type of investment requires an expanding pool of buyers, who, in turn, are enticed because they believe the buying pool will expand still further. Owners are not inspired by what the asset itself can produce – it will remain lifeless forever – but rather by the belief that others will desire it even more avidly in the future.
The major asset in this category is gold, currently a huge favorite of investors who fear almost all other assets, especially paper money (of whose value, as noted, they are right to be fearful). Gold, however, has two significant shortcomings, being neither of much use nor procreative. True, gold has some industrial and decorative utility, but the demand for these purposes is both limited and incapable of soaking up new production. Meanwhile, if you own one ounce of gold for an eternity, you will still own one ounce at its end.
What motivates most gold purchasers is their belief that the ranks of the fearful will grow. During the past decade that belief has proved correct. Beyond that, the rising price has on its own generated additional buying enthusiasm, attracting purchasers who see the rise as validating an investment thesis.
As “bandwagon” investors join any party, they create their own truth – for a while. Over the past 15 years, both Internet stocks and houses have demonstrated the extraordinary excesses that can be created by combining an initially sensible thesis with well-publicized rising prices. In these bubbles, an army of originally skeptical investors succumbed to the “proof” delivered by the market, and the pool of buyers – for a time – expanded sufficiently to keep the bandwagon rolling. But bubbles blown large enough inevitably pop. And then the old proverb is confirmed once again: “What the wise man does in the beginning, the fool does in the end.”
Today the world’s gold stock is about 170,000 metric tons. If all of this gold were melded together, it would form a cube of about 68 feet per side. (Picture it fitting comfortably within a baseball infield.) At $1,750 per ounce – gold’s price as I write this – its value would be $9.6 trillion. Call this cube pile A. Let’s now create a pile B costing an equal amount. For that, we could buy all U.S. cropland (400 million acres with output of about $200 billion annually), plus 16 Exxon Mobils (the world’s most profitable company, one earning more than $40 billion annually). After these purchases, we would have about $1 trillion left over for walking-around money (no sense feeling strapped after this buying binge).
Can you imagine an investor with $9.6 trillion selecting pile A over pile B? Beyond the staggering valuation given the existing stock of gold, current prices make today’s annual production of gold command about $160 billion. Buyers – whether jewelry and industrial users, frightened individuals, or speculators – must continually absorb this additional supply to merely maintain an equilibrium at present prices.
A century from now the 400 million acres of farmland will have produced staggering amounts of corn, wheat, cotton, and other crops – and will continue to produce that valuable bounty, whatever the currency may be. Exxon Mobil will probably have delivered trillions of dollars in dividends to its owners and will also hold assets worth many more trillions (and, remember, you get 16 Exxons). The 170,000 tons of gold will be unchanged in size and still incapable of producing anything. You can fondle the cube, but it will not respond.
Admittedly, when people a century from now are fearful, it’s likely many will still rush to gold. I’m confident, however, that the $9.6 trillion current valuation of pile A will compound over the century at a rate far inferior to that achieved by pile B.”
Before simply believing Warren WILL be right…There’s this in the annual report as well: “Last year, I told you that “a housing recovery will probably begin within a year or so.” I was dead wrong”
A much older quote that summarizes Buffett’s long-held view is this one “It gets dug out in Africa or some place. Then we melt it down, dig another hole, bury it again and pay people to stand around guarding it. It has no utility. Anyone watching from Mars would be scratching their head.”
In my earlier post on this subject HERE, I note; “But I trust you can see the irony in claiming gold is ‘useless’ and yet it can buy [all the agricultural land in the United States, sixteen companies as valuable as Exxon and a trillion dollars in walking-around money].
For those of you who are interested in two alternative perspectives, (assuming the debasing of fiat money across the globe is not enough to encourage you), I thought you might find some of what you need in the following points, and also Warren Buffett’s father’s views. (Note: we only own three or four gold stocks all of which have rising production profiles and do not require ever increasing gold prices to support the returns on equity that justify much higher valuations. So we aren’t quite in the ‘carried-away’ camp even though some have doubled in price. This latter development delights us in this market).
And now a short commercial break…
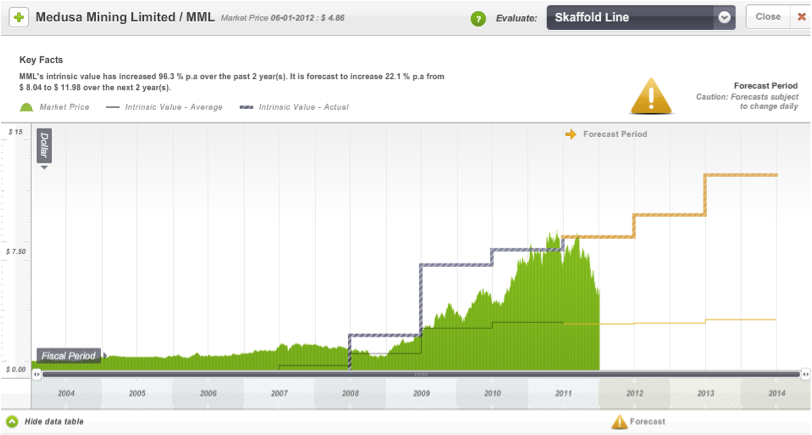
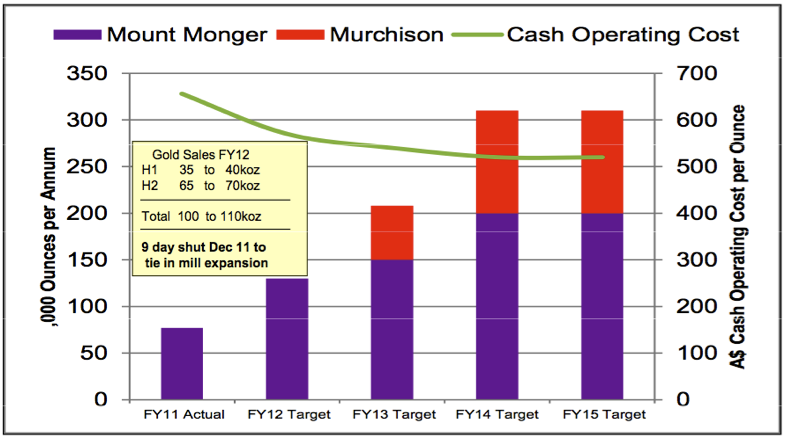
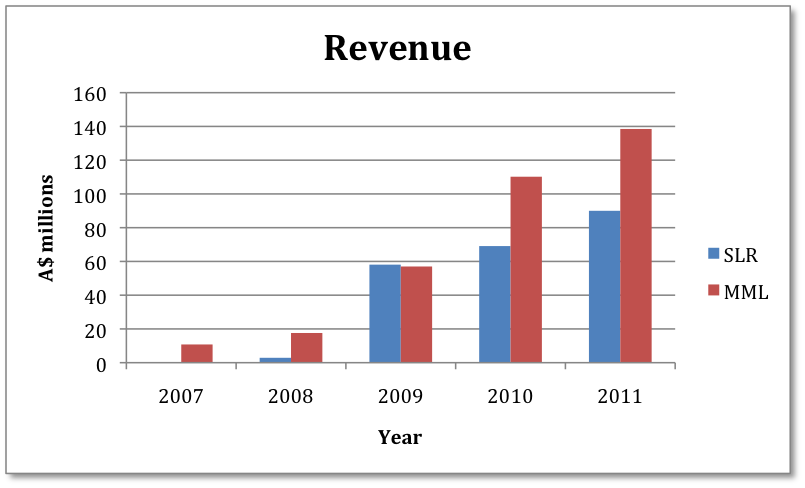
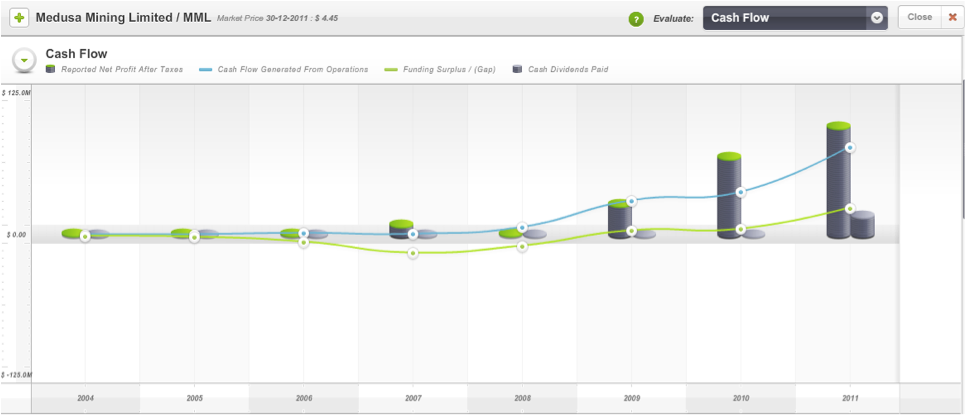
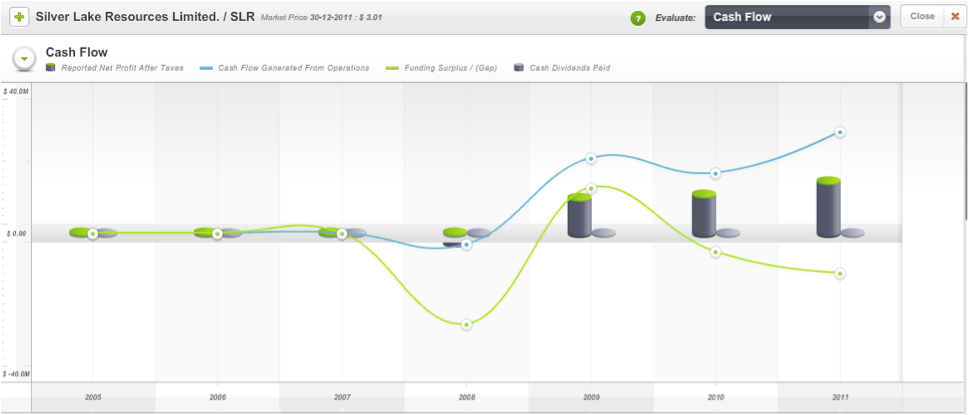
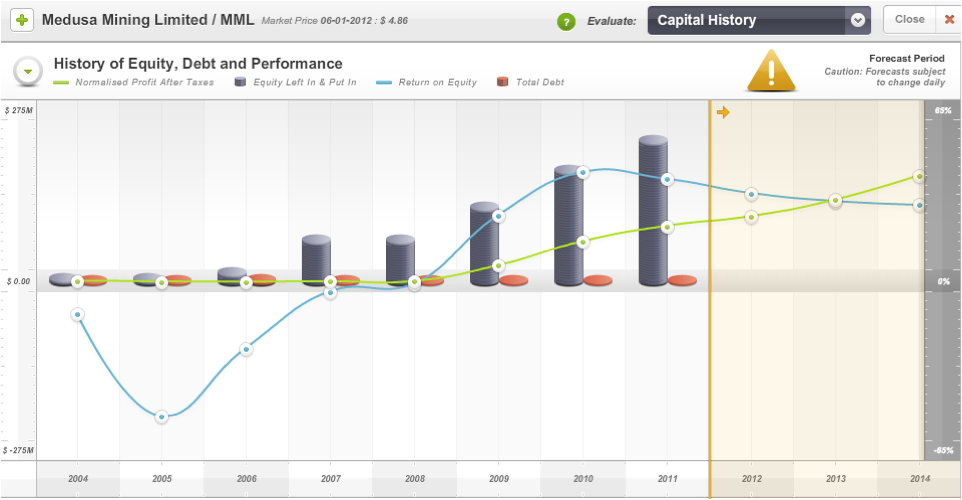
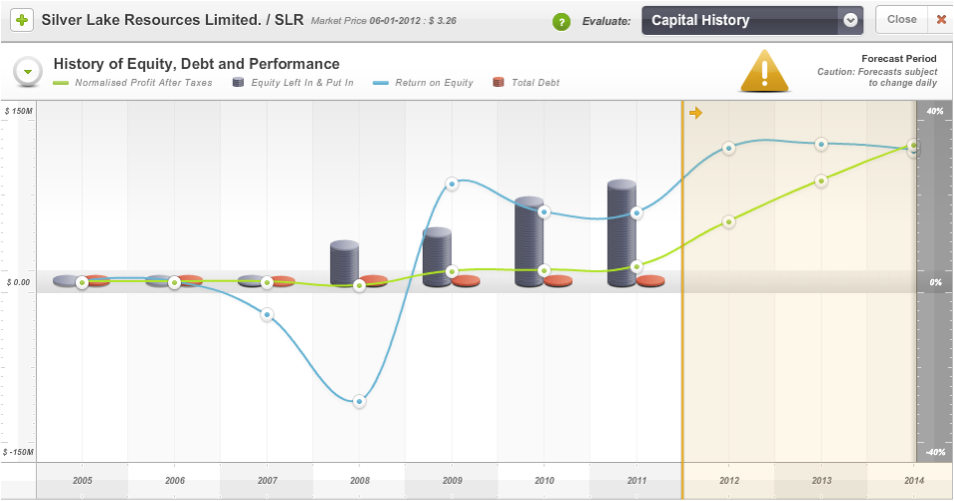
Here are two Skaffold screenshots, each gold stocks we currently own. If you are a member of Skaffold, you should be able to pick them right away. If you aren’t a member, what are you waiting for? Head over to www.skaffold.com and become a member today.

And now back to our regular programming…
From gold’s mouth itself;
Let’s start with the basics of my enduring characteristics. I have some characteristics that no other matter on Earth has…
I cannot be:
Printed (ask a miner how long it takes to find me and dig me up)
Counterfeited (you can try, but a scale will catch it every time)
Inflated (I can’t be reproduced)
I cannot be destroyed by;
Fire (it takes heat at least 1945.4° F. to melt me)
Water (I don’t rust or tarnish)
Time (my coins remain recognizable after a thousand years)
I don’t need:
Feeding (like cattle)
Fertilizer (like corn)
Maintenance (like printing presses)
I have no:
Time limit (most metal is still in existence)
Counterparty risk (remember MF Global?)
Shelf life (I never expire)
As a metal, I am uniquely:
Malleable (I spread without cracking)
Ductile (I stretch without breaking)
Beautiful (just ask an Indian bride)
As money, I am:
Liquid (easily convertible to cash)
Portable (you can conveniently hold $50,000 in one hand)
Divisible (you can use me in tiny fractions)
Consistent (I am the same in any quantity, at any place)
Private (no one has to know you own me)
From an entirely different perspective on gold it may be worth reading the Hon. Howard Buffett. Congressman Buffett argues that without a redeemable currency, an individual’s freedoms both financial and more broadly is dependent on politicians. He goes on to observe that fiat (paper) money systems tend to collapse eventually, producing economic chaos. His argument that the US should return to the gold standard was not adopted.
Human Freedom Rests of Gold Redeemable Money
Posted Thursday, May 6, 1948
By HON. HOWARD BUFFETT
U. S. Congressman from Nebraska
Reprinted from The Commercial and Financial Chronicle 5/6/48
Is there a connection between Human Freedom and A Gold Redeemable Money? At first glance it would seem that money belongs to the world of economics and human freedom to the political sphere.
But when you recall that one of the first moves by Lenin, Mussolini and Hitler was to outlaw individual ownership of gold, you begin to sense that there may be some connection between money, redeemable in gold, and the rare prize known as human liberty.
Also, when you find that Lenin declared and demonstrated that a sure way to overturn the existing social order and bring about communism was by printing press paper money, then again you are impressed with the possibility of a relationship between a gold-backed money and human freedom.
In that case then certainly you and I as Americans should know the connection. We must find it even if money is a difficult and tricky subject. I suppose that if most people were asked for their views on money the almost universal answer would be that they didn’t have enough of it.
In a free country the monetary unit rests upon a fixed foundation of gold or gold and silver independent of the ruling politicians. Our dollar was that kind of money before 1933. Under that system paper currency is redeemable for a certain weight of gold, at the free option and choice of the holder of paper money.
Redemption Right Insures Stability
That redemption right gives money a large degree of stability. The owner of such gold redeemable currency has economic independence. He can move around either within or without his country because his money holdings have accepted value anywhere.
For example, I hold here what is called a $20 gold piece. Before 1933, if you possessed paper money you could exchange it at your option for gold coin. This gold coin had a recognizable and definite value all over the world. It does so today. In most countries of the world this gold piece, if you have enough of them, will give you much independence. But today the ownership of such gold pieces as money in this country, Russia, and all divers other places is outlawed.
The subject of a Hitler or a Stalin is a serf by the mere fact that his money can be called in and depreciated at the whim of his rulers. That actually happened in Russia a few months ago, when the Russian people, holding cash, had to turn it in — 10 old rubles and receive back one new ruble.
I hold here a small packet of this second kind of money – printing press paper money — technically known as fiat money because its value is arbitrarily fixed by rulers or statute. The amount of this money in numerals is very large. This little packet amounts to CNC $680,000. It cost me $5 at regular exchange rates. I understand I got clipped on the deal. I could have gotten $2½ million if I had purchased in the black market. But you can readily see that this Chinese money, which is a fine grade of paper money, gives the individual who owns it no independence, because it has no redemptive value.
Under such conditions the individual citizen is deprived of freedom of movement. He is prevented from laying away purchasing power for the future. He becomes dependent upon the goodwill of the politicians for his daily bread. Unless he lives on land that will sustain him, freedom for him does not exist.
You have heard a lot of oratory on inflation from politicians in both parties. Actually that oratory and the inflation maneuvering around here are mostly sly efforts designed to lay the blame on the other party’s doorstep. All our politicians regularly announce their intention to stop inflation. I believe I can show that until they move to restore your right to own gold that talk is hogwash.
Paper Systems End in Collapse
But first let me clear away a bit of underbrush. I will not take time to review the history of paper money experiments. So far as I can discover, paper money systems have always wound up with collapse and economic chaos.
Here somebody might like to interrupt and ask if we are not now on the gold standard. That is true, internationally, but not domestically. Even though there is a lot of gold buried down at Fort Knox, that gold is not subject to demand by American citizens. It could all be shipped out of this country without the people having any chance to prevent it. That is not probable in the near future, for a small trickle of gold is still coming in. But it can happen in the future. This gold is temporarily and theoretically partial security for our paper currency. But in reality it is not.
Also, currently, we are enjoying a large surplus in tax revenues, but this happy condition is only a phenomenon of postwar inflation and our global WPA. It cannot be relied upon as an accurate gauge of our financial condition. So we should disregard the current flush treasury in considering this problem.
From 1930-1946 your government went into the red every year and the debt steadily mounted. Various plans have been proposed to reverse this spiral of debt. One is that a fixed amount of tax revenue each year would go for debt reduction. Another is that Congress be prohibited by statute from appropriating more than anticipated revenues in peacetime. Still another is that 10% of the taxes be set aside each year for debt reduction.
All of these proposals look good. But they are unrealistic under our paper money system. They will not stand against postwar spending pressures. The accuracy of this conclusion has already been demonstrated.
The Budget and Paper Money
Under the streamlining Act passed by Congress in 1946, the Senate and the House were required to fix a maximum budget each year. In 1947 the Senate and the House could not reach an agreement on this maximum budget so that the law was ignored.
On March 4 this year the House and Senate agreed on a budget of $37½ billion. Appropriations already passed or on the docket will most certainly take expenditures past the $40 billion mark. The statute providing for a maximum budget has fallen by the wayside even in the first two years it has been operating and in a period of prosperity.
There is only one way that these spending pressures can be halted, and that is to restore the final decision on public spending to the producers of the nation. The producers of wealth — taxpayers — must regain their right to obtain gold in exchange for the fruits of their labor. This restoration would give the people the final say-so on governmental spending, and would enable wealth producers to control the issuance of paper money and bonds.
I do not ask you to accept this contention outright. But if you look at the political facts of life, I think you will agree that this action is the only genuine cure. There is a parallel between business and politics which quickly illustrates the weakness in political control of money.
Each of you is in business to make profits. If your firm does not make profits, it goes out of business. If I were to bring a product to you and say, this item is splendid for your customers, but you would have to sell it without profit, or even at a loss that would put you out of business. — well, I would get thrown out of your office, perhaps politely, but certainly quickly. Your business must have profits.
In politics votes have a similar vital importance to an elected official. That situation is not ideal, but it exists, probably because generally no one gives up power willingly.
Perhaps you are right now saying to yourself: “That’s just what I have always thought. The politicians are thinking of votes when they ought to think about the future of the country. What we need is a Congress with some ‘guts.’ If we elected a Congress with intestinal fortitude, it would stop the spending all right!”
I went to Washington with exactly that hope and belief. But I have had to discard it as unrealistic. Why? Because an economy Congressman under our printingpress money system is in the position of a fireman running into a burning building with a hose that is not connected with the water plug. His courage may be commendable, but he is not hooked up right at the other end of the line. So it is now with a Congressman working for economy. There is no sustained hookup with the taxpayers to give him strength.
When the people’s right to restrain public spending by demanding gold coin was taken from them, the automatic flow of strength from the grass-roots to enforce economy in Washington was disconnected. I’ll come back to this later.
In January you heard the President’s message to Congress or at least you heard about it. It made Harry Hopkins, in memory, look like Old Scrooge himself.
Truman’s State of the Union message was “pie-in-the-sky” for everybody except business. These promises were to be expected under our paper currency system. Why? Because his continuance in office depends upon pleasing a majority of the pressure groups.
Before you judge him too harshly for that performance, let us speculate on his thinking. Certainly he can persuade himself that the Republicans would do the same thing if they were In power. Already he has characterized our talk of economy as “just conversation.” To date we have been proving him right. Neither the President nor the Republican Congress is under real compulsion to cut Federal spending. And so neither one does so, and the people are largely helpless.
But it was not always this way.
Before 1933 the people themselves had an effective way to demand economy. Before 1933, whenever the people became disturbed over Federal spending, they could go to the banks, redeem their paper currency in gold, and wait for common sense to return to Washington.
Raids on Treasury
That happened on various occasions and conditions sometimes became strained, but nothing occurred like the ultimate consequences of paper money inflation.
Today Congress is constantly besieged by minority groups seeking benefits from the public treasury. Often these groups. control enough votes in many Congressional districts to change the outcome of elections. And so Congressmen find it difficult to persuade themselves not to give in to pressure groups. With no bad immediate consequence it becomes expedient to accede to a spending demand. The Treasury is seemingly inexhaustible. Besides the unorganized taxpayers back home may not notice this particular expenditure — and so it goes.
Let’s take a quick look at just the payroll pressure elements. On June 30, 1932, there were 2,196,151 people receiving regular monthly checks from the Federal Treasury. On June 30, 1947, this number had risen to the fantastic total of 14,416,393 persons.
This 14½ million figure does not include about 2 million receiving either unemployment benefits of soil conservation checks. However, it includes about 2 million GI’s getting schooling or on-the-job-training. Excluding them, the total is about 12½ million or 500% more than in 1932. If each beneficiary accounted for four votes (and only half exhibited this payroll allegiance response) this group would account for 25 million votes, almost by itself enough votes to win any national election.
Besides these direct payroll voters, there are a large number of State, county and local employees whose compensation in part comes from Federal subsidies and grants-in-aid.
Then there are many other kinds of pressure groups. There are businesses that are being enriched by national defense spending and foreign handouts. These firms, because of the money they can spend on propaganda, may be the most dangerous of all.
If the Marshall Plan meant $100 million worth of profitable business for your firm, wouldn’t you Invest a few thousands or so to successfully propagandize for the Marshall Plan? And if you were a foreign government, getting billions, perhaps you could persuade your prospective suppliers here to lend a hand in putting that deal through Congress.
Taxpayer the Forgotten Man
Far away from Congress is the real forgotten man, the taxpayer who foots the bill. He is in a different spot from the tax-eater or the business that makes millions from spending schemes. He cannot afford to spend his time trying to oppose Federal expenditures. He has to earn his own living and carry the burden of taxes as well.
But for most beneficiaries a Federal paycheck soon becomes vital in his life. He usually will spend his full energies if necessary to hang onto this income.
The taxpayer is completely outmatched in such an unequal contest. Always heretofore he possessed an equalizer. If government finances weren’t run according to his idea of soundness he had an individual right to protect himself by obtaining gold.
With a restoration of the gold standard, Congress would have to again resist handouts. That would work this way. If Congress seemed receptive to reckless spending schemes, depositors’ demands over the country for gold would soon become serious. That alarm in turn would quickly be reflected in the halls of Congress. The legislators would learn from the banks back home and from the Treasury officials that confidence in the Treasury was endangered.
Congress would be forced to confront spending demands with firmness. The gold standard acted as a silent watchdog to prevent unlimited public spending.
I have only briefly outlined the inability of Congress to resist spending pressures during periods of prosperity. What Congress would do when a depression comes is a question I leave to your imagination. I have not time to portray the end of the road of all paper money experiments.
It is worse than just the high prices that you have heard about. Monetary chaos was followed in Germany by a Hitler; in Russia by all-out Bolshevism; and in other nations by more or less tyranny. It can take a nation to communism without external influences. Suppose the frugal savings of the humble people of America continue to deteriorate in the next 10 years as they have in the past 10 years? Some day the people will almost certainly flock to “a man on horseback” who says he will stop inflation by price-fixing, wage-fixing, and rationing. When currency loses its exchange value the processes of production and distribution are demoralized.
For example, we still have rent-fixing and rental housing remains a desperate situation.
For a long time shrewd people have been quietly hoarding tangibles in one way or another. Eventually, this individual movement into tangibles will become a general stampede unless corrective action comes soon.
Is Time Propitious
Most opponents of free coinage of gold admit that that restoration is essential, but claim the time is not propitious. Some argue that there would be a scramble for gold and our enormous gold reserves would soon be exhausted.
Actually this argument simply points up the case. If there is so little confidence in our currency that restoration of gold coin would cause our gold stocks to disappear, then we must act promptly.
The danger was recently highlighted by Mr. Allan Sproul, President of the Federal Reserve Bank of New York, who said:
“Without our support (the Federal Reserve System), under present conditions, almost any sale of government bonds, undertaken for whatever purpose, laudable or otherwise, would be likely to find an almost bottomless market on the first day support was withdrawn.”
Our finances will never be brought into order until Congress is compelled to do so. Making our money redeemable in gold will create this compulsion.
The paper money disease has been a pleasant habit thus far and will not he dropped voluntarily any more than a dope user will without a struggle give up narcotics. But in each case the end of the road is not a desirable prospect.
I can find no evidence to support a hope that our fiat paper money venture will fare better ultimately than such experiments in other lands. Because of our economic strength the paper money disease here may take many years to run its course.
But we can be approaching the critical stage. When that day arrives, our political rulers will probably find that foreign war and ruthless regimentation is the cunning alternative to domestic strife. That was the way out for the paper-money economy of Hitler and others.
In these remarks I have only touched the high points of this problem. I hope that I have given you enough information to challenge you to make a serious study of it.
I warn you that politicians of both parties will oppose the restoration of gold, although they may outwardly seemingly favor it. Also those elements here and abroad who are getting rich from the continued American inflation will oppose a return to sound money. You must be prepared to meet their opposition intelligently and vigorously. They have had 15 years of unbroken victory.
But, unless you are willing to surrender your children and your country to galloping inflation, war and slavery, then this cause demands your support. For if human liberty is to survive in America, we must win the battle to restore honest money.
There is no more important challenge facing us than this issue — the restoration of your freedom to secure gold in exchange for the fruits of your labors.
I am internationally accepted, last for thousands of years, and probably most important, you can’t make any more of me.”
Posted by Roger Montgomery, Value.able author, Skaffold Chairman and Fund Manager, 26 February 2012.


