COVID-19 Testing data – Part 3 NSW data update
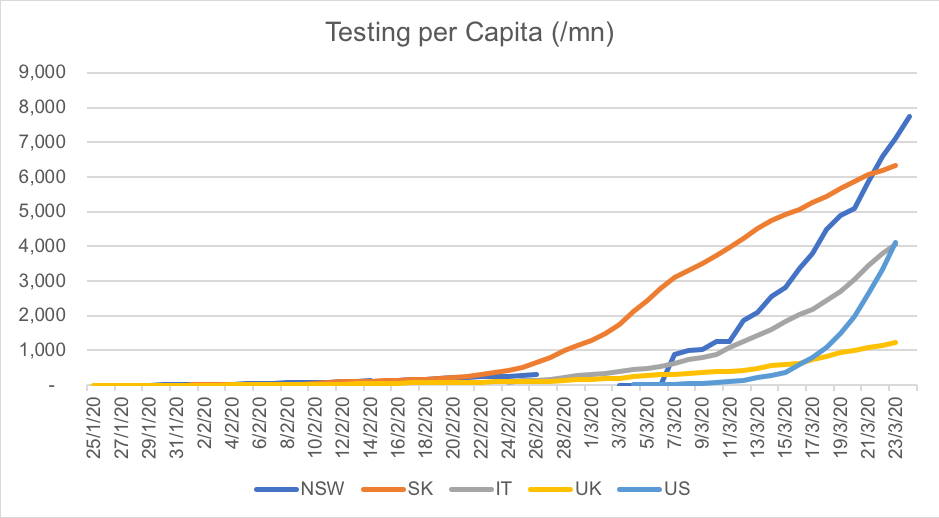
In our third update tracking COVID-19 testing data, NSW Health started reporting data on 25 January. The data released regularly reported case epidemiology, with a high trace rate, as well as good data on disease incidence by age cohort. NSW Health also appeared to have started early with a testing plan, and we note that when that testing regime scored a hit, testing volumes jumped, and kept ramping.
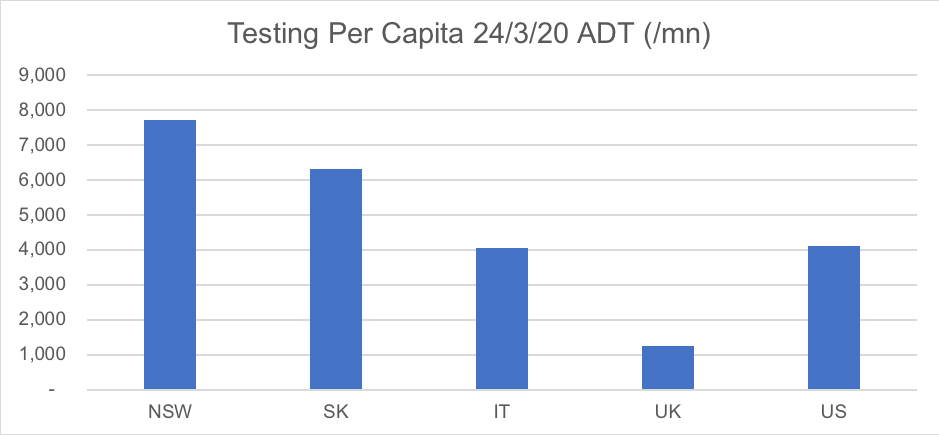
As of yesterday, (24/03) NSW had performed 61,848 tests, found 818 cases, with sadly 7 deaths. To date, NSW Health has performed 7,731 tests per million of population. This is the highest of the datasets we have examined.

Source: Montgomery
You can review our data on South Korea in this article: Part 1 South Korea. We have also published data from Italy, the UK and the US in Part 2.
NSW analysis gives us some insights
- The significance of these test levels per capita is further drawn out when considered against the levels of disease incidence observed. NSW has detected 818 cases, South Korea 8,897 cases, Italy 59,138 cases, UK 5,683 cases and the US 31,888 cases. It appears that NSW has its early warning test system up and running and is now looking to scale this further (11/3/20 – NSW health moved from 3 hospital venues for testing to eventually 18).
- Media reports and anecdotes from people who have gone through the NSW testing process suggests that there simply are not enough tests to perform mass testing yet. Demand is much greater than supply, and so the health service is currently employing policies of targeting testing in areas where evidence of COVID-19 contact exists or international travel occurred and symptoms exist. This is not the test hard doctrine of South Korea. More supply of tests and a subsequent policy change on their use at NSW Health has still to happen if we are to see NSW’s good start in its testing regime follow the path of South Korea. Test kit availability will clearly be key over the coming days.
- What we must do now is capitalise on this position. And that’s where you, our investors and blog readers can do their part. Social distancing, none of us knew what that was 2 weeks ago. But we do now. The analysis and evidence presented above shows that the most effective tool was simply to know where the virus was and isolate, pushing down on that transmission rate by denying the virus contact to the next host with which to propagate on. You know what to do.
Whats next?
We don’t know. There are plenty of stocks for us to look at that are cheap that’s for sure. Dominic and I spend our day discussing which stocks will “make it to the other side.” We are grappling with how long a shutdown/lockdown scenario could apply in Australia and the impact of the stimulus provided by our Government, regulators and Central Bank. As well as that offered up in other countries. We saw a $4 trillion number mooted for the US this morning, that was $1 trillion a week ago. Its fast moving.
We will keep you updated on our thoughts as we eventually deploy our cash to take advantage of these opportunities. Any questions, please do reach out and we’ll do our best to get back to you promptly.
One last chart
We are calling this one the re-election chart or Government Competency Index… Decide for yourself.
Source: Montgomery
The chart should be viewed in the context of the following data table, which identifies when a Government recorded its 100th case of COVID-19. This shows the test per capita on that date. We then look 7 & 14 days later T7 and T14 and show the tests per capita on those days to get a sense of the Government’s response to the problem. Have they been prepared and have they done enough. We expect future elections may be decided on facts just like these. President Biden?
| NSW | SK | IT | UK | US | |
| Date t0 | 14/03/2020 | 20/02/2020 | 24/02/2020 | 5/03/2020 | 4/03/2020 |
| Tests t0 | 2,562 | 221 | 64 | 266 | 13 |
| Date t7 | 21/03/2020 | 27/02/2020 | 2/03/2020 | 12/03/2020 | 11/03/2020 |
| Tests t7 | 5,862 | 801 | 344 | 430 | 104 |
| Date t14 | 28/03/2020 | 5/03/2020 | 9/03/2020 | 19/03/2020 | 18/03/2020 |
| Tests t14 | Future | 2,433 | 793 | 952 | 1,089 |
Please click here to visit the previous articles:
We have updated the data, see my latest post Friday 27 March 2020.

Really enjoyed this 3 part series! Nice work. Stay safe Team.
Steve. Thanks. There will be a further update out soon. G
Thanks Brad. Stay Healthy. Gary
Tanks for all the great in depth work .
Generally they are doing what they can – the government, not helped by some of the community – congregating at Bondi beach for example.
For a broader view;
NSW Health deeming cruise liner passengers with flu like symptoms as “low risk” and letting them into the community with no testing and using the Defence Force to try and find them;
https://www.theguardian.com/world/2020/mar/24/anatomy-of-a-coronavirus-disaster-how-2700-people-were-let-off-the-ruby-princess-cruise-ship-by-mistake
Minister lying about not having enough staff to deal with 50,000 requests for Government assistance;
https://www.theguardian.com/australia-news/2020/mar/23/incompetence-attack-mygov-website-did-not-crash-because-of-ddos-cyber-assault-as-stuart-robert-claimed
thanks for those links Paul. Stay safe.
nevermind.. i see the per million now.
cheers
Hi Gary,
Thankyou for posting the above info.
could you please explain what you mean in the last paragraph by “tests per capita on those days”?
I’d like to make sure i’m interpreting the data right.
thanks,