COVID-19 Testing data – Part 2 The story for Italy, the UK and US
We have been tracking COVID-19 testing data, rather than just cases alone and understanding how testing might give us some early insight on the preparedness of governments, and also to the dynamism of their response upon realising that a COVID-19 problem exists. Governments, if prepared, would want to utilise the ability to test as an early warning system first. We looked for consistent testing data and can update you on in Italy (IT), UK, and the US.
In our first article, we talked about South Korea. South Korea has tested hard, and it looks so far to have been effective. Volumes of cases have fallen.
Italy – The dangers of not knowing disease incidence
- Italian testing data become available post it becoming clear that there was a potential problem in Italy.
- To date Italy has performed 258,000 tests, or 3,806 tests per million of population. Our view is that Italy didn’t appear to have testing as part of an early warning system, and so was unaware of the level of COVID-19 infection incidence amongst its population.
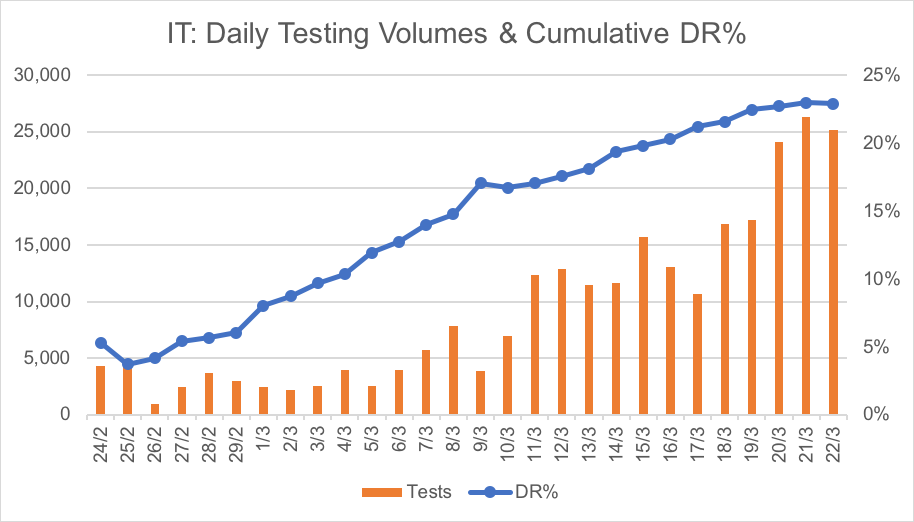
Source: Dipartimento della Protezione Civile, Montgomery
- Italy did ramp up testing, as the above chart of daily testing shows. The ramp up to around 12,000 tests a day from 11 March, and 24,000 tests a day from 20 March, seemed too late, by then Italy already had detected 12,462 & 47,021 cases respectively, suggesting with the benefit of hindsight containment as a strategy to avoid mass casualties was too late. As evidenced by a chronically rising detection rate despite a five fold increase in testing cadence since early March.
- Denied the opportunity to use the Test & Trace hard doctrine of South Korea, Italy has moved through various stages of lockdown as a way to slow transmission, whilst coping with an unbearable load on their health system.
- Detection rates, the percentage of tests that come back positive, remain high in Italy at 23 per cent of tests performed so far, but the evidence of the last 3 days suggest that this is peaking. We really hope so.
The UK – Credible test volumes early, but hasn’t scaled
- This is where it started for me, my family are in the UK and I wanted to understand the UK’s testing regime. I would go to the NHS website every day and look at test volumes and cases. What I found initially gave me some comfort that the UK had test volumes at decent level, like that of an early warning system. I checked out the testing volume levels to see how it compared with South Korea.
- Initially the UK early warning testing levels were consistent with the South Korea experience, the UK started to regularly detect cases at the end of February. At that point test volumes started scaling, from the low hundreds a day to 1-2000. I was seeing what I thought I would, the UK government reacting to its effective early warning system and was ramping testing.
- However scaling was slow, way too slow. South Korea scaled its testing volumes from sub 1000 a day to over 5000 in 8 days. The UK took 14 days to do that. In that extra week the incidence of this virus will likely have doubled and doubled again.
- Post attaining the 5000 test a day mark, South Korea ramped volumes up to 10,000 cases a day a further 8 days later. Today UK is doing 5-6000 tests a day. The UK looks like it hasn’t taken advantage of its early detection, it appears to have missed the opportunity to scale testing, for whatever reason, despite detecting a steadily increasing incidence amongst its testing population as evidence in the chart below. Its likely that – like everywhere – there is a shortage of test kits & capability. Detection rates are rising, dramatically.
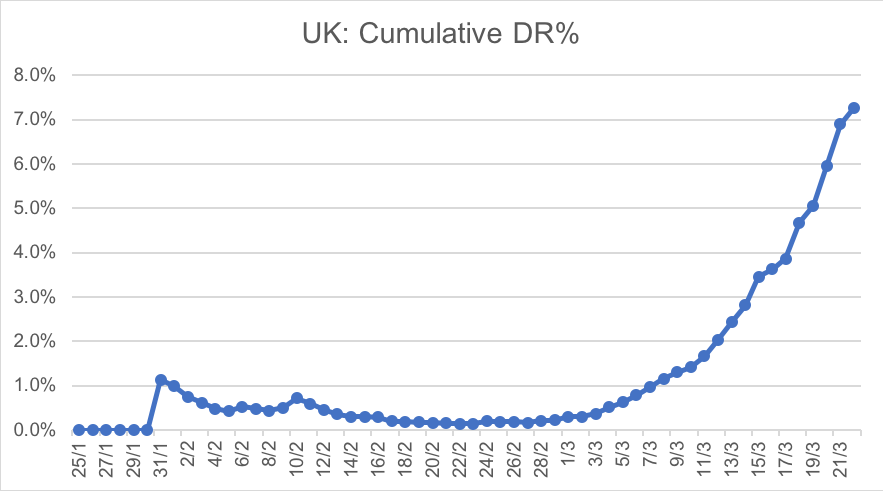
Source: UK NHS, Github, Montgomery
The US – why we are holding so much cash
- We started tracking the US testing data via the disclosure from the US CDC. However we found it was 3-5 days behind the curve. The disclosure was sporadic, the data difficult to manage and not consistent with an organisation that had a clear picture of control to present.
- We have all now seen the news reports regarding the problems the US CDC had on developing a COVID-19 reliable test. That’s consistent with what we observed in the data, something was wrong, US test volumes didn’t start scaling until 13 March.
- As an observation the CDC data for February suggests US testing volumes were at around 100 tests a day which is extremely low levels relative to the size of the US population and the available evidence of COVID-19 disease transmission inside the US. For instance NSW health disclosure reports a material number of cases introduced to Australia came from US air passengers.
- The US Federal government’s stance that COVID-19 wasn’t an issue all the way through February and for half of March also raises valid questions regarding the preparedness of the US for COVID-19.
- We also saw in the CDC disclosure that the known epidemiology rate (epi rate), the percentage of cases where the source had been identified was low, really low, the data consistently showing it around the 8-15% per cent level. This compares to South Korea which despite a materially higher case volume at the time was regularly over 80 per cent, and here in NSW today at 72 per cent. If testing is to be used as a tool to fight the transmission rate of this virus, a credible contract tracing capability needs to be working alongside a scale testing regime. This level of epi rate in the US is not consistent with that.
So where are we today in the US?
Testing is ramping hard, the industrial might of the US has now been tasked to solve the scaling of testing problem. Its ripping now – see chart below – data suggest the US performed 2,234 tests on 12/3/20, yesterday (US time) saw 46,154 tests performed. Its clear from the political narrative that test volumes will rise – with President Trump calling out 2 million tests a week would be available by the end of next week, and 5 million the week after that, suggesting that that volume level would not be needed. We hope so.
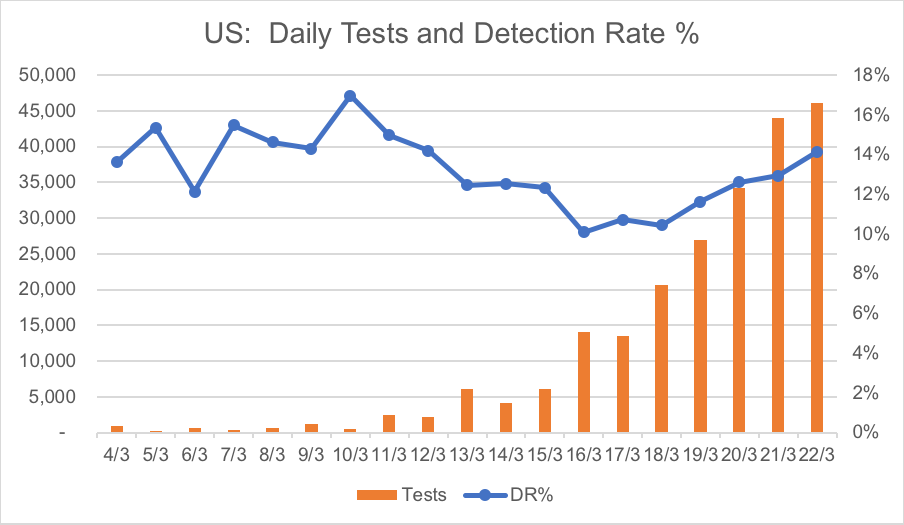
Source: The COVID Tracking Project, Montgomery
- The issue with ramping testing late, is that significant transmission appears likely to have already occurred.
- Subsequently this increase in testing will likely unveil a significant number of cases. The more you test the more you find – as evidenced by a rising detection rate in the chart above, despite the volume of testing tripling since 16 March.
- Its not clear if the US, even if it ramps testing into the 100’s of thousands a day, will be able to then take that test data, perform aggressive contact tracing on this testing scale and use this as a tool to get ahead of the transmission rate of the virus and “flatten the US curve.”
- We think the largest driver of financial markets has been a rising awareness, through rising case volumes, of the potential unpreparedness of the US for COVID-19 with the consequences for the US health system and citizens there that this could mean. This has contributed significantly to our portfolio positioning as defensive, and holding maximum levels of cash.
We now have Part 3: Data for NSW, Australia available.
We have updated the data, see my latest post Friday 27 March 2020.
Gary Rollo is the Portfolio Manager of the Montgomery Small Companies Fund. Gary joined Montgomery in August 2019 after spending three years at MHOR Asset Management in Sydney as a Founder and Portfolio Manager. Prior to this, Gary was a Portfolio Manager at Renaissance Asset Manager in Sydney for six years. Before moving to Australia, Gary spent five years in London running Morgan Stanley’s Technology Sector Equity Research Team, as well as two years covering technology companies for JP Morgan.
This post was contributed by a representative of Montgomery Investment Management Pty Limited (AFSL No. 354564). The principal purpose of this post is to provide factual information and not provide financial product advice. Additionally, the information provided is not intended to provide any recommendation or opinion about any financial product. Any commentary and statements of opinion however may contain general advice only that is prepared without taking into account your personal objectives, financial circumstances or needs. Because of this, before acting on any of the information provided, you should always consider its appropriateness in light of your personal objectives, financial circumstances and needs and should consider seeking independent advice from a financial advisor if necessary before making any decisions. This post specifically excludes personal advice.
For me testing and the public health response is only looking at one side of the problem. The other issue relates to how the medical system – and in particular its workers – can stand up to sustained punishment.
Its a bit like thinking about fighting a war and making the mistake of gauging the likely success or failure on how many troops one has. In reality it the motivation and morale and the context and environment that is important. My prediction is that the attention will soon turn to the crisis in health care.
thanks for the heads-up John. Sincerely appreciated insight.
Really insightful and informative article Gary – much appreciated.
Look forward to reading your article tomorrow on Australia’s and NSW’s experience.