COVID-19 Testing data – Latest Update
Italy’s major national shutdown and lockdown isolation measures taken on 9 March and March 11, some 14-16 days ago, may now be showing up as lower case numbers. The timeline appears to fit the proposed initial two week quarantine period suggested for potential COVID-19 cases.
On 25 March Italy performed 27,481 tests, a new peak, and found 5,210 positives, the 6th highest recorded. This is a good sign, testing at peak levels, but discovering a lower than peak, would be consistent with “curve flattening.” Some potential good news.
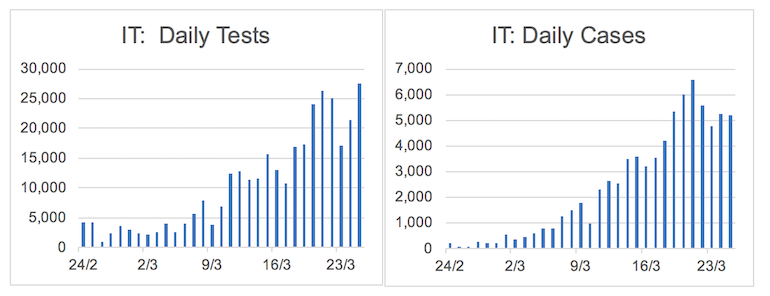 Source: Dipartimento della Protezione Civile, Montgomery
And we think this is significant for markets. Evidence that lockdown’s work to curb the transmission rate of the virus would be a significant positive for markets.
US – Vulnerable populations, testing levels accelerating but remain at low per capita levels
The US is in the early stages of scaling testing, of what we think will be a grim realisation of case discovery. The US population also has significant elevated levels of co-morbidities such as obesity, hyper-tension, and other lifestyle related chronic illnesses that could render its populations more vulnerable to COVID-19. Testing volumes are growing fast, daily detection rate has been in the 14%-19% level despite testing volumes quadrupling in the last week, indicative we feel of significant levels of transmission having already occurred. The US remains at what looks like unacceptably low levels of testing per capita. Today roughly half the US population is in shutdown mode.
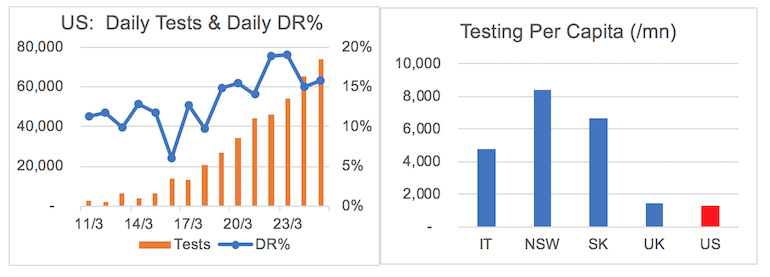
Source: The COVID Tracking Project, Montgomery
NSW – Remains early, we may still have the opportunity to suppress transmission rate
In our view the data indicates that NSW remains in an earlier stage of virus transmission than that of other countries. NSW has yet to hit the acceleration phase of the case curve. The jump in cases on 25/3/20 due to the “unknown” infections on the two cruise ships which created a distortion in detection rate, that appears corrected in the data released 26/3/20. However, the trend is clear, the detection rate is rising.
The narrative around test kit use also appears to be changing, opening up to a broader definition of testing criteria, which as explained in previous blogs was a successful strategy employed in South Korea to lower its transmission rate, test & trace hard. However, this remains dependent on test kit volume availability. NSW Testing per capita levels remain high, as does known epidemiology rate (source of infection) at 71 per cent, however there is a steadily increasing locally acquired transmission.
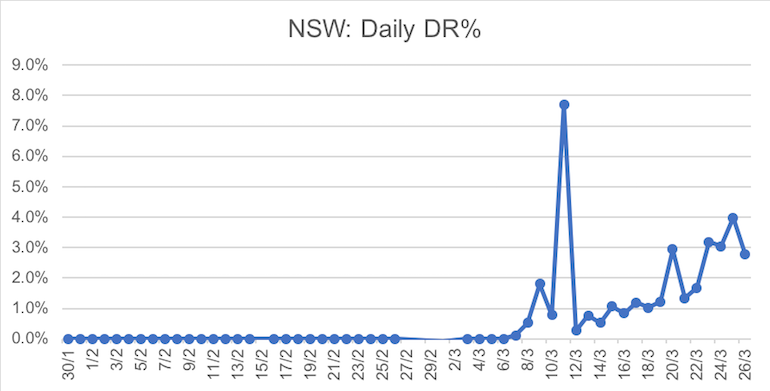 Source: Montgomery
Benchmarking testing effort, virus incidence and progression
NSW has cumulatively tested per capita at a level that is 1.4-7.3x the other datasets we have. If NSW had the same level of virus incidence as other countries then we’d expect to see that testing harder would yield higher levels of virus detected. That’s not yet observable in the data. Using the data in the table below and the UK data as a way to explain what we see. NSW has tested at 6.5x the intensity of the UK, but has only found 1.1x the cases per capita, in rough terms NSW has looked 6x as hard and found the same.
| Tests per Capita | NSW Relative | Cases per Capita | NSW Relative | |
| NSW | 9,251 | 152 | ||
| IT | 4,779 | 1.9x | 1,096 | 0.1x |
| SK | 6,702 | 1.4x | 178 | 0.9x |
| UK | 1,429 | 6.5x | 140 | 1.1x |
| US | 1,265 | 7.3x | 1,265 | 0.1x |
Source: Montgomery. Per capita data is per million of population
And the NSW data relative to the other dataset’s shows the same dimension, NSW has looked harder and found less than all other countries in our datasets. So the data shows what we all think, that NSW is at an earlier stage of virus progression than other countries.
But when could NSW see its peak case load?
That’s a tougher question. As we know this depends on the social distancing actions now being encouraged by government, and when these steps are taken. The earlier we take those steps and the better we are at applying them the lower and later our peak will be.
But we can assess progression we have observed so far. We looked at how long it has taken to go from 1 to 150 cases per capita – the virus took the 23 days to penetrate to this level of incidence in NSW. It took 22 days in South Korea (a country where testing helped bring the virus under control), it took 23 days in the UK, 17 days in the US and 16 days in Italy. We have lower confidence in the predictive power of this analysis but point it out as an observation, nonetheless.
Our central case from an investment standpoint is that Lockdown remains a likely scenario for Australia. From an investment process point of view, we are looking for companies that can sustain themselves during this period of lockdown and come through to the other side. With the aggressive market sell off, and significant price volatility we are in a target rich environment.
We will keep you up to date on further insights we get from the testing data & how we see our investing opportunity set.
Until then, stay healthy. And stay home.
Gary Rollo is the Portfolio Manager of the Montgomery Small Companies Fund. Gary joined Montgomery in August 2019 after spending three years at MHOR Asset Management in Sydney as a Founder and Portfolio Manager. Prior to this, Gary was a Portfolio Manager at Renaissance Asset Manager in Sydney for six years. Before moving to Australia, Gary spent five years in London running Morgan Stanley’s Technology Sector Equity Research Team, as well as two years covering technology companies for JP Morgan.
This post was contributed by a representative of Montgomery Investment Management Pty Limited (AFSL No. 354564). The principal purpose of this post is to provide factual information and not provide financial product advice. Additionally, the information provided is not intended to provide any recommendation or opinion about any financial product. Any commentary and statements of opinion however may contain general advice only that is prepared without taking into account your personal objectives, financial circumstances or needs. Because of this, before acting on any of the information provided, you should always consider its appropriateness in light of your personal objectives, financial circumstances and needs and should consider seeking independent advice from a financial advisor if necessary before making any decisions. This post specifically excludes personal advice.
A vicious cycle until a vaccine, which is consistently reported as 12 months away, China have allowed some citizens to move more freely around the country and the virus is spreading again, so back into lockdown again presumably.
And they will blame the rest of the world for it.
Have you looked at Spain’s numbers, at the same total cases they beat Italy with new cases by +32%!
Might be more relative to what will happen to US
You could be right Karlis. Thanks for sharing.