

The missing ingredient in Jack Cowin’s interest rate argument
Jack Cowin, who brought KFC to Australia, founded Hungry Jack’s and is Chairman of Domino’s Pizza Enterprises, recently shared his thoughts on interest rates:
“I was around in the 1970s when corporate interest rates were in the mid-20 per cent range, so this is a picnic. And in the 1980s or 1990s we had similarly high interest rates, so I’m somewhat bemused by the degree of concern people are expressing versus what it has been in the past…the reality is the sun will come up in the morning. The economy is cyclical, and things will rise, they will solve the problems, and the sun will come up.”
Whilst many older Australians would agree with Jack Cowin, there are two missing ingredients in his thesis, and the main one revolves around Australian’s insatiable appetite for debt.
Firstly, as credit became “freely available” Australia’s consumer debt to disposable income ratio has increased four-fold from 45 per cent to around 180 per cent over the past four or five decades.
Graph 1. Australia household finances debt to income
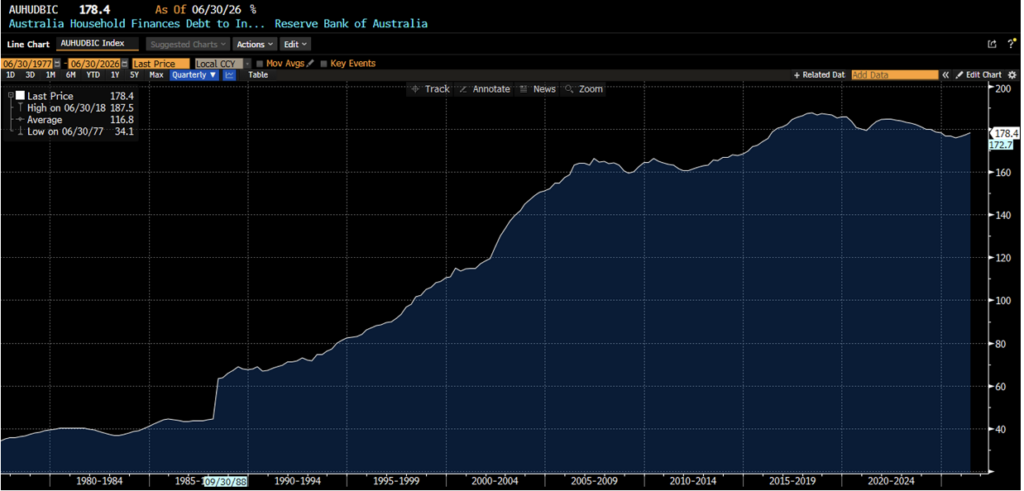
Source: RBA
Second, the cost of an average property in a city like Sydney, despite the recent severe price retracement, has jumped from around three times pre-tax earnings to twelve times pre-tax earnings. The additional expenses associated with a potential university debt and childcare, as well as the cost-of-living crisis, has meant many relatively younger Australian’s are finding it difficult to “get ahead” whilst others are heading for financial despair, despite the fact the current interest rate structure is significantly lower than it was during previous peaks.
In the table below, I have compared the typical financial situation today with one of four plus decades ago and assumed a period where there is a single-family breadwinner.
|
|
4 plus decades ago |
Today |
Change |
|
Consumer debt to disposable income ratio |
45% |
180% |
4.0X |
|
Cost of house |
$99,000 |
$1.44m |
14.5X |
|
Pre-tax income – single breadwinner |
$33,000 |
$120,000 |
3.6X |
|
House/ pre-tax income |
3X |
12X |
4.0X |
|
Annual interest rate on mortgage |
17.0% |
6.75% |
-10.25% or -60% |
|
Interest expense, assuming 60% Loan/Value Ratio |
$10,000 |
$58,000 |
5.8X |
|
Pre-tax income to annual mortgage interest expense |
3.3X |
2.07X |
-37% |
Despite the fact the mortgage interest rate today is approximately 10.25 per cent or 60 per cent lower today than it was around the peak periods of 4 plus decades ago, the typical pre-tax income for a single breadwinner relative to the annual mortgage interest expense is at least one-third worse off, assuming a 60 per cent Loan to Value ratio.
If the bank of Mum and Dad isn’t open, it is certainly a tough period for many Australian families with a significant mortgage.

Chief Executive Officer of Montgomery Investment Management, David Buckland has over 40 years of industry experience.
David is a deeply knowledgeable and highly experienced financial services executive. Prior to joining Montgomery in 2012, David was CEO and Executive Director of Hunter Hall for 11 years, as well as a Director at JP Morgan in Sydney and London for eight years.
This post was contributed by a representative of Montgomery Investment Management Pty Limited (AFSL No. 354564). The principal purpose of this post is to provide factual information and not provide financial product advice. Additionally, the information provided is not intended to provide any recommendation or opinion about any financial product. Any commentary and statements of opinion however may contain general advice only that is prepared without taking into account your personal objectives, financial circumstances or needs. Because of this, before acting on any of the information provided, you should always consider its appropriateness in light of your personal objectives, financial circumstances and needs and should consider seeking independent advice from a financial advisor if necessary before making any decisions. This post specifically excludes personal advice.


The table’s 5.8x interest-cost comparison checks out: $99,000 × 60% × 17% is about $10,098 a year, while $1.44 million × 60% × 6.75% is about $58,320, a 5.78x increase. Put another way, the mortgage rate fell about 60.3%, but the annual interest bill in this like-for-like LVR example rose roughly 477.5%. I maintain OnlinTools; our Percentage Calculator can check those changes, but it cannot compare household affordability without loan term, principal amortisation, taxes, deposits, other debt, and household income composition.
Thank you, Lang.