

It’s all good! Not.
A few aphorisms are worth reciting at this juncture in markets: You can’t put toothpaste back in a tube, and the ball rolls fastest at the bottom of the hill.
Many tech and financial companies are missing market expectations. In Q3, JP Morgan missed for the first time in three years, as did Microsoft, Intel, Alphabet, Opendoor Technologies and Amazon.
The Nasdaq fell nearly five per cent last week, putting it on course for a correction. Elsewhere, the semiconductor index plunged 12 per cent before edging higher. The VIX volatility index jumped 35 per cent to a seven-month high, while the S&P 500 was on track for its worst day since Trump imposed global tariffs on “Liberation Day”.
After a two-day bounce, many observers suggest the worst is over for the tech sell-off, though it’s worth noting they can’t know for sure. Meanwhile, sales, build-out, earnings and cash flow momentum for some, if not many, issuers are slowing or deteriorating.
In the U.S., real residential fixed investment – which adds to the total stock of residential capital – has declined for the past seven quarters. The pool of active home buyers is at a record low. These are basic economic problems, and the list of others is long and growing. AI was supposed to solve them, but it has actually made them worse.
Then there’s the terrible stock market breadth, with margin debt and many valuation metrics still near all-time highs. Meanwhile, expectations of higher-for-longer rates, another potential impeachment, Democrats in places like Texas threatening AI freezes, and the President, his cabinet, supporters, and donors facing a vengeful pogrom all add to the concerns. So do a chaotic Europe, Ukraine absorbing billions of euros, China in recession, falling markets in Korea and Indonesia, and the UK urging people to prepare for a “Black Sky” event. These are hardly bullish themes to carry into 2027.
The details
The “AI Wreck” that culminated last week has confirmed the erosion of market breadth that began weeks earlier.
While the major indices traded near record highs just weeks ago, underlying market participation tells a very different story.
According to market data and analysts, the erosion of market breadth in the first week of November is best captured by the percentage of S&P 500 stocks trading above their 200-day moving average. That share plunged to 58.56 per cent, meaning over 41 per cent of S&P 500 companies are now entrenched in a technical bear market (trading below their 200-day average).
Just as we warned over a year ago, the tech sector finally took a hit amid concerns about infrastructure spending. Take a look at the Technology Select Sector ETF (XLK) – it closed the week at $164.74, below its 200-day moving average.
On top of that, Thursday, November 5th, 2026 was a rough day for the Nasdaq Composite: it officially dipped into correction territory and also finished out the week below its 200-day line.
Nobody’s suggesting you should run your portfolio based on moving averages. But you can’t ignore how much the market’s underlying strength is drying up. Historically, that kind of deterioration usually signals a major market pullback. Over at Morgan Stanley, Mike Wilson noted in his market notes that over half of the stocks in the Russell 3000 are now down at least 20 per cent from their recent peaks.
Then you have the S&P 500, which plunged 4.4 per cent in a single day on Thursday and finished the week 5.7 per cent below its October 6th record high. High-beta groups such as Autos, Semiconductors, and short-cycle Industrials were also hit hard over the past week. Global anxieties about AI chips even spread overseas, dragging major Asian tech benchmarks – such as Japan’s Nikkei and Taiwan’s main index – down at least 20 per cent from their all-time highs.
To put this into perspective, the team at Ned Davis Research noted that whenever the S&P 500 trades just a few percentage points below its highs while more than half of its internal momentum indicators deteriorate, it creates a rare technical divergence – and historically, that’s a red flag.
Debate rages on
All this means, Wall Street is nursing some serious wounds, which is dragging investors into a fierce debate over the sustainability of the artificial intelligence boom.
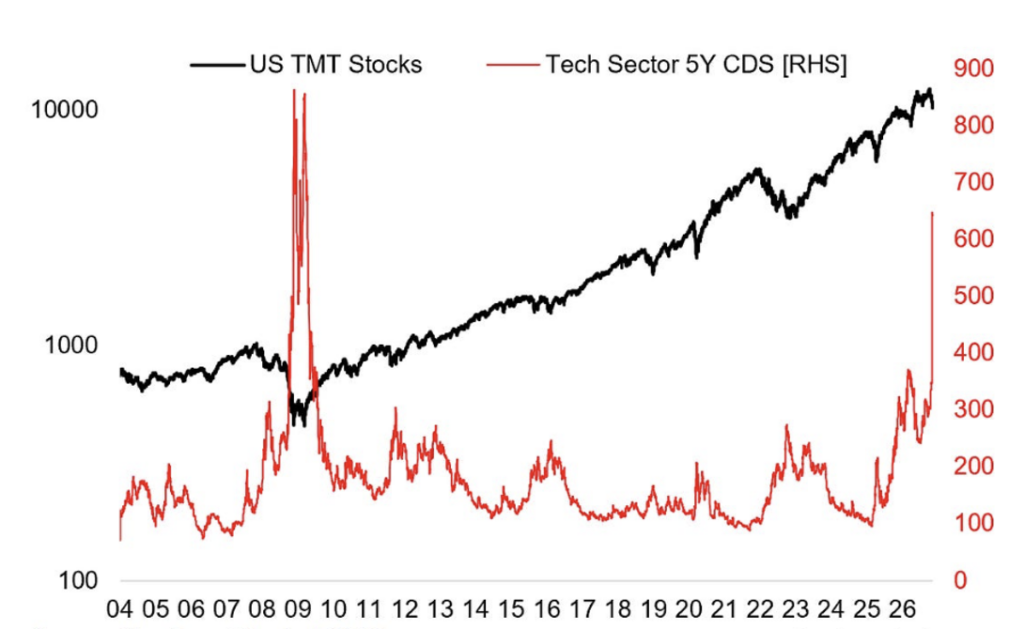
Figure 1. Tech sector credit risk pricing
Source: Topdown Charts, LSEG
As semiconductor stocks absorb historic blows and credit risk pricing reaches levels not seen since the global financial crisis (Figure 1), market participants are urgently trying to answer this question: Is this severe pullback a healthy correction, or the beginning of a deeper structural unwinding?
The bulls: A healthy release of air
Leading the optimistic charge is Ed Yardeni, widely regarded as one of Wall Street’s most bullish analysts. Yardeni attributes the sharp turbulence primarily to investor panic and the rapid unwinding of leverage, rather than any foundational collapse in tech demand. While recent post-midterm election jitters and growing political pushback against massive data centre expansions – such as localised resistance in Texas and broader community pushback – have unnerved traders, Yardeni suggests these hurdles are merely “speed bumps”.
“This is letting air out of the bubble in a controlled manner,” notes the Yardeni Research outlook, arguing that a measured rollout prevents the infrastructure boom from overheating catastrophically like the dot-com wreck of 1999–2000.
Others echo Yardeni’s bullish stance, noting that November and December are historically strong months and that strength usually persists until April.
Liquidity squeeze
Conversely, macro strategists point to deeper monetary plumbing to explain the market’s recent spasms. Liquidity expert Michael Howell attributes the tech contraction not to waning AI enthusiasm but to a peak in the global liquidity cycle and a severe “crowding out” effect.
According to Howell, a massive real-economy capital expenditure (capax) boom is draining global financial liquidity. Tech hyperscalers – including heavy debt-issuance rounds from Microsoft (US$25 billion), Apple (US$7 billion), Alphabet, Oracle, and Meta – are aggressively tapping bond and equity markets to fund infrastructure. This heavy capital demand creates a liquidity drain that compresses price-to-earnings (P/E) multiples and pressures high-beta assets, shifting markets from speculative gains to a genuine funding crunch.
Variant Perception
Then there’s Variant Perception’s (VP) November 2026 post, Cyclical Asset Allocation: Macro Risk Indicator turns neutral from ‘Risk-On’ => balanced allocations.
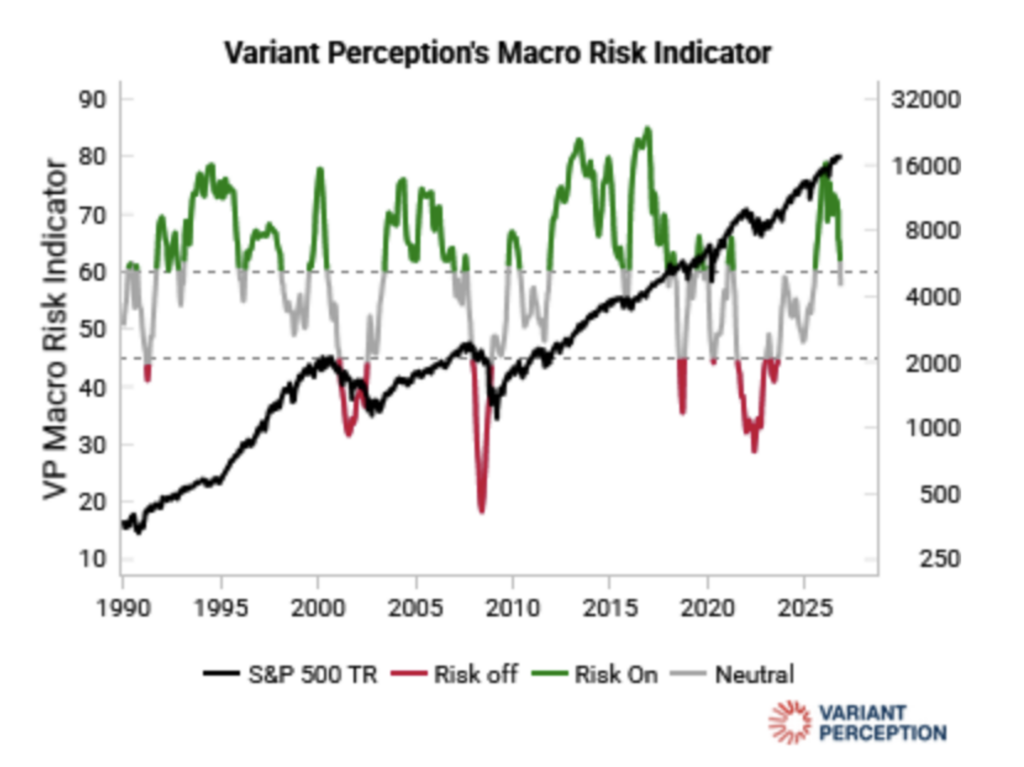
VP’s Macro Risk Indicator, which turns VP’s best cyclical models into a single number to help choose risk exposure, has shifted out of the “Risk-On” regime (Figure 2.), into neutral. This is a relatively rare macro event – the fifth time this shift has occurred since 2000.
Figure 2. Variant Perception’s macro risk indicator
Source: Variant Perception
Previous occurrences of this shift often preceded periods of equity market ‘drawdowns’ or late-cycle volatility (notably around major cycle transitions in 2000, 2007, and mid-cycle slowdowns).
The basic issue, according to Variant Perception (VP), is that persistent inflation (partially tied to geopolitical and energy-related tail risks, as well as agricultural tail risks) is limiting the Fed’s ability to cut rates just as cyclical economic momentum and liquidity begin to fade.
Meanwhile, VP’s “AI Bubble Watch” report also notes narrowing market breadth and weakening liquidity – which suggests fewer marginal buyers remain to support equity multiples at current levels.
VP’s recommendation is to shift toward more balanced allocations, away from aggressive pro-cyclical risk assets toward 60/40 portfolios. They also suggest rotating away from high-beta tech exposure toward defensive value sectors, real assets, or select fixed-income/bonds, the latter as yields become more attractive relative to slowing growth.
Finally, VP suggest increasing cash allocations or short-dated liquid securities to manage downside volatility as the margin of safety narrows.
Geopolitical echoes and divergent sectors
The current market has also inspired analysts to compare it to late-2018, which also featured post-midterm political swings, potential Federal Reserve rate hikes, and fiscal/budget deadlines.
Furthermore, as Figure 1., revealed, credit default swap (CDS) pricing for the tech sector has spiked dramatically, reflecting anxiety over a potentially less friendly regulatory backdrop under a newly swept Congress in Washington.
Interestingly, each episode of ‘carnage’ has been remarkably brief and localised. While the Philadelphia Semiconductor Index plummeted sharply – with individual names like Intel falling 50 per cent in less than a month – the broader market has been resilient.
The fridge
Setting P/E ratios – which have slipped to levels unseen since March 2020 – and other valuations aside, what matters is who will ultimately capture the economic value of AI.
In the U.S., in the 1930s households adopted mechanical refrigerators en-masse, but manufacturers ultimately lost pricing power. The unexpected beneficiaries were downstream businesses like Coca-Cola, whose revenue and profits soared as the company capitalised on the new technology.
In Australia in the 1930’s a fridge was a prohibitively expensive luxury item and each fridge cost as a much as a house – I know because a family member bought four, one for each of his houses. By 1955, roughly 67 per cent of Melbourne homes had a refrigerator. By 1964, an estimated 94 per cent of Australian households owned one, effectively phasing out the old ice chest.
Mass adoption led to skyrocketing unit volumes. During the late 1940s and early 1950s, the price of entry dropped enough to transition fridges from a luxury item to a middle-class staple. During this phase, manufacturers won on all fronts. Demand was so high that consumers faced months-long waiting lists. Even as prices per unit ticked down, the explosion in unit sales volume meant total manufacturer revenues and overall profit pools surged exponentially
By the late 1950s and 1960s, intense competition and economies of scale forced aggressive price drops. And because a refrigerator is a durable good that lasts for decades, once 94 per cent of homes owned one, the market shifted from high-growth ‘first-time buyers’ to low-growth ‘replacement buyers’. Margins shrank dramatically because manufacturers had to slash prices to win replacement customers, meaning revenues flattened out and net profit margins eroded
For investors, it’s worth remembering the fridge’s history. The AI revolution is transitioning from unbridled euphoria to a more rigorous test of financial reality.

Roger Montgomery is the Founder and Chairman of Montgomery Investment Management. Roger has over three decades of experience in funds management and related activities, including equities analysis, equity and derivatives strategy, trading and stockbroking. Prior to establishing Montgomery, Roger held positions at Ord Minnett Jardine Fleming, BT (Australia) Limited and Merrill Lynch.
He is also author of best-selling investment guide-book for the stock market, Value.able – how to value the best stocks and buy them for less than they are worth.
Roger appears regularly on television and radio, and in the press, including ABC radio and TV, The Australian and Ausbiz. View upcoming media appearances.
This post was contributed by a representative of Montgomery Investment Management Pty Limited (AFSL No. 354564). The principal purpose of this post is to provide factual information and not provide financial product advice. Additionally, the information provided is not intended to provide any recommendation or opinion about any financial product. Any commentary and statements of opinion however may contain general advice only that is prepared without taking into account your personal objectives, financial circumstances or needs. Because of this, before acting on any of the information provided, you should always consider its appropriateness in light of your personal objectives, financial circumstances and needs and should consider seeking independent advice from a financial advisor if necessary before making any decisions. This post specifically excludes personal advice.


