
Why the big banks are underperforming the market
If you’re holding shares in an Australian bank – particularly National Australia Bank (ASX:NAB), Westpac (ASX:WBC) or Australia and New Zealand Banking Group (ASX:ANZ) – then you’re likely feeling less wealthy than you were back before Coronavirus was a household word. In just two months, the market has priced in the impact of loan losses by the banks and the potential need for dilutive equity raisings. And the worst may not be over.
The major banks have underperformed the broader market over the last 6 months as well as during the recent broader market falls on the back of the developing COVID-19 pandemic. This is not surprising given that banks have leveraged exposure to economic conditions and nominal asset prices.
Since the end of September last year, the share prices of three of the four major banks have gone from a substantial premium to net tangible assets to a discount, while the premium the market is willing to pay for the Commonwealth Bank of Australia (ASX:CBA) has fallen to levels that the market had previously viewed as being justified for the other three banks.
Figure 1: Major Bank Price to Net Tangible Assets
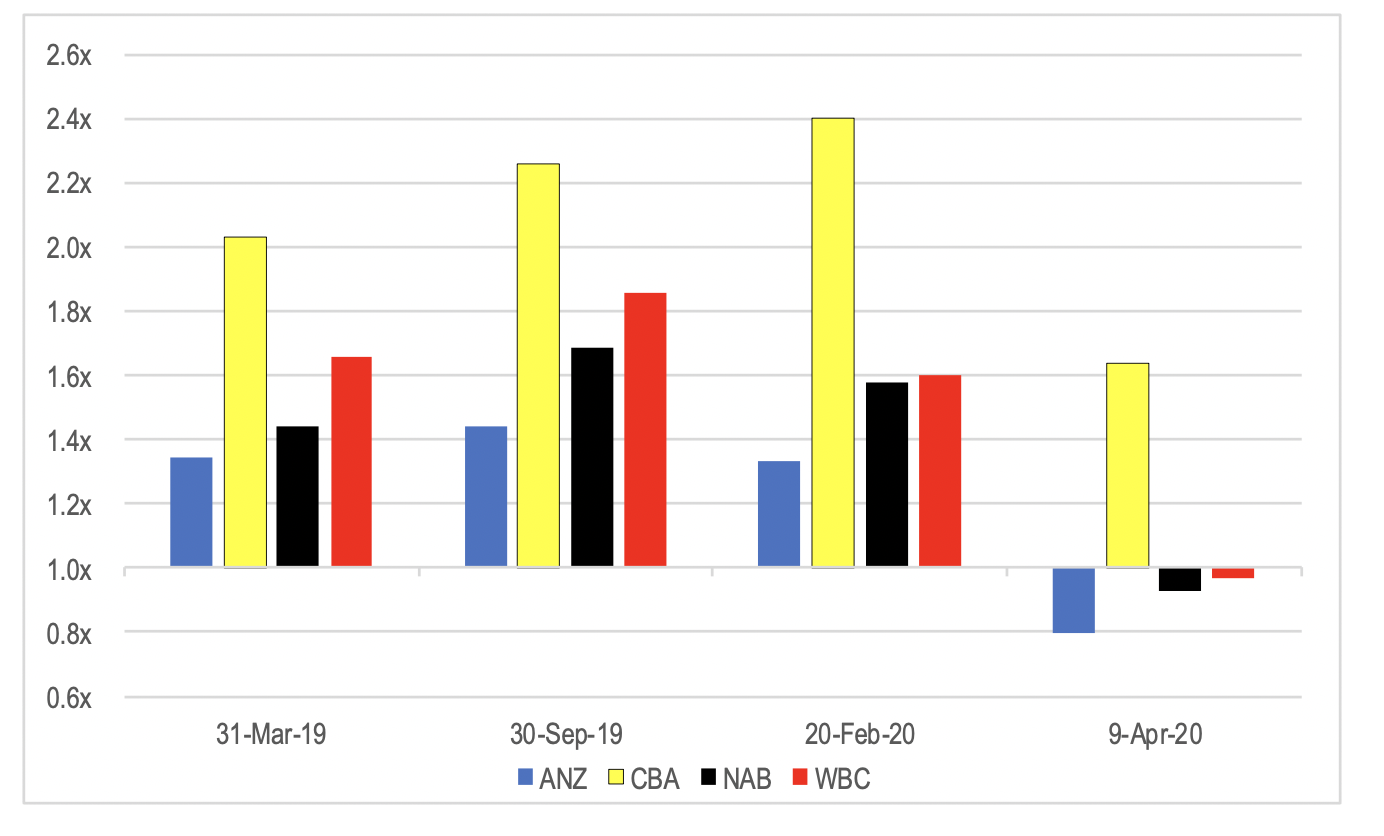
Source: Bloomberg, MIM estimates
The de-rating of the banks, particularly since 20 February, was due to the market becoming increasingly concerned about the potential for a recession and the risk of a credit crisis.
The ASX 300 Banks Accumulation index fell 44 per cent from 20 February to the recent bottom of the market on 23 March. By comparison, the broader market fell 36 per cent over the same period.
The banks have also lagged the recovery in the broader market over the last 4 weeks, underperforming the broader market by a further 6.4 per cent since the low on 23 March. This is despite the risk of a liquidity crisis having diminished as a result of the co-ordinated monetary policy response announced by the major central banks around the world.
The de-rating is largely a function of an expected increase in bad debts as a result of the coming recession and jump in the unemployment rate. This will reduce equity capital and net profit for a number of years. The difficulty for the market is in estimating the impact of a recession on bank credit losses given that the last recession was 28 years ago.
The chart below shows the aggregate annual bad debt provision charges taken by the major banks as a percentage of their gross loans and advances (Gross Loans) over the last 30 years.
Figure 2: Aggregate Major Bank Bad Debt Provisions to Gross Loans & Advances
Source: Companies, JPMorgan, MIM estimates
This shows the spike in bad debts during the last recession, which resulted in materially elevated charges for 5 years. The problem with looking at bad debt charges as a percentage of Gross Loans is that different types of loans tend to perform differently during economic downturns. For example, defaults tend to be a lot higher on corporate and unsecured consumer loans than on residential mortgages. Therefore, as the mix of loans changes within a bank’s loan book, the percentage of Gross Loans that can be expected to default also changes.
Over the last 30 years, the mix of loans has changed materially for the major banks, with corporate and business lending having represented the majority of Gross Loans in the late 1980s and early 1990s. Today, around two thirds of is residential mortgages for the major banks.
In an attempt to adjust for this, we can use credit risk weighted assets (CRWA) instead of Gross Loans as a denominator. CRWA multiplies the exposure of the bank to each loan by a risk weighting reflecting the risk of default. Mortgages have risk weights of around 30 per cent for the major banks while corporate and business loans tend to be closer to 100 per cent risk weighted on average.
Unfortunately, risk weight methodologies have changed over time. The most significant change was the move to internal risk modelling by the banks in the middle of last decade. This materially reduced the risk weight applied to mortgages. To compensate for this, CRWA has been adjusted to apply a more consistent average risk weight to mortgages since 2007. This still means that there is a break in the data at that point, but it is less material than the break caused by the change to IRB modelling at that time.
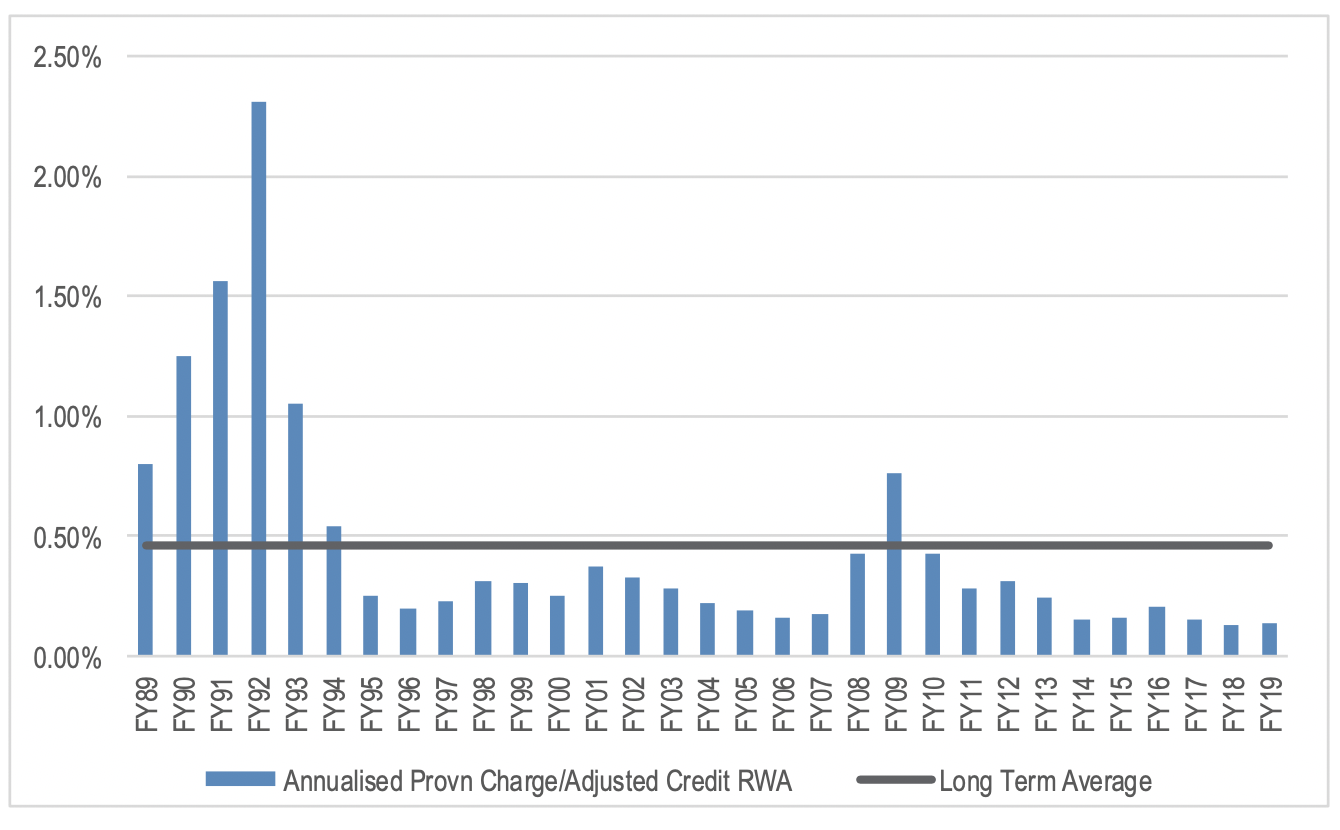
Figure 3: Aggregate Major Bank Bad Debt Charge to Adjusted Credit Risk Weighted Assets

Source: Companies, JPMorgan, MIM estimates
The spike in bad debt charges during the last recession was slightly lower as a percentage of CRWA than Gross Loans, but it was still large. The average charge taken by the majors as a percentage of adjusted CRWA over the last 30 years has been 48 basis points a year. Over the last 7 years, the charge has been well below this level, averaging 28 basis points a year.
Looking at the spike in provision charges associated with the last recession, the aggregate bad debt charges between FY89 and FY93 were 5.78 per cent of CRWA. This is 3.37 percentage points above the 30-year average charge, and 4.36 percentage points above the average annual charge taken by the major banks over the last 7 years.
As a simplistic assessment of what the market is factoring in for bad debt charges above normal levels, we can deduct a similar proportion of CRWA from the current net tangible assets (NTA) of each bank on an after-tax basis as a one-off recession driven loss. We can then recalculate the Price to NTA after these charges and compare the resulting ratio to where the banks were trading prior to the market sell off from 23 February as a guide to what is effectively being factoring in for each back.
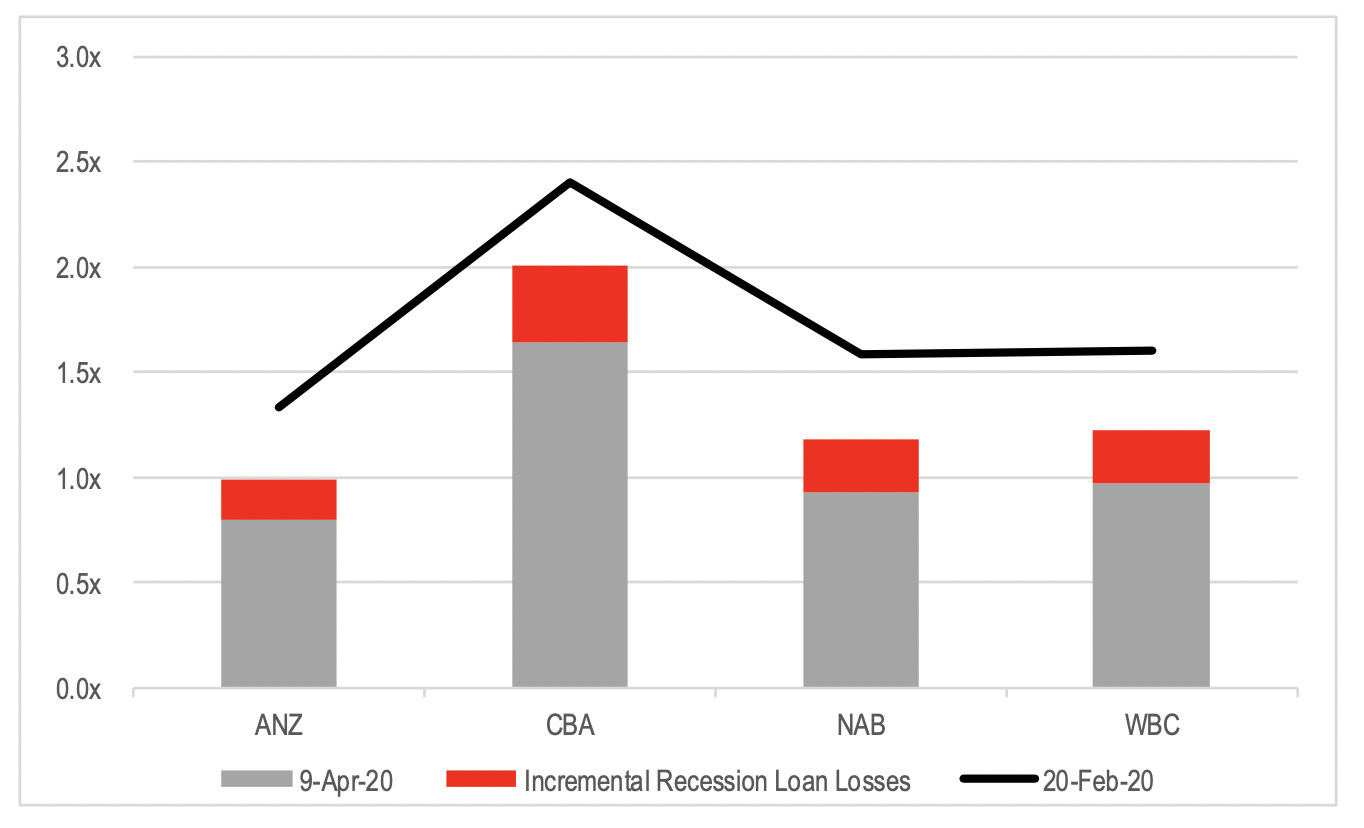
Figure 4: Price to NTA Adjusted for a 4.36ppt Cumulative Incremental Bad Debt Loss from the Recession
Source: Companies, MIM estimates
Assuming the market has only adjusted the share price of the major banks since 20 February 2020 for an incremental amount of bad debt losses that will result from the coming recession, the chart above indicates that the market is factoring in a more significant impact on loan losses from this recession than what occurred as a result of the 1991 recession, given that the Price to NTA was materially higher on 20 February than it is currently even after adjusting for incremental loan losses.
Of course, there are likely other factors at play as well, one of which is the potential need for dilutive equity raisings by the banks to recapitalise their balance sheets after loan loss provisions occur. The chart below shows the last reported CET1 ratios for the major banks as well as a proforma ratio adjusting for the timing of dividend payments, equity raisings and any future proceeds to be received from asset sales.
Figure 5: Major Bank CET1 Ratios
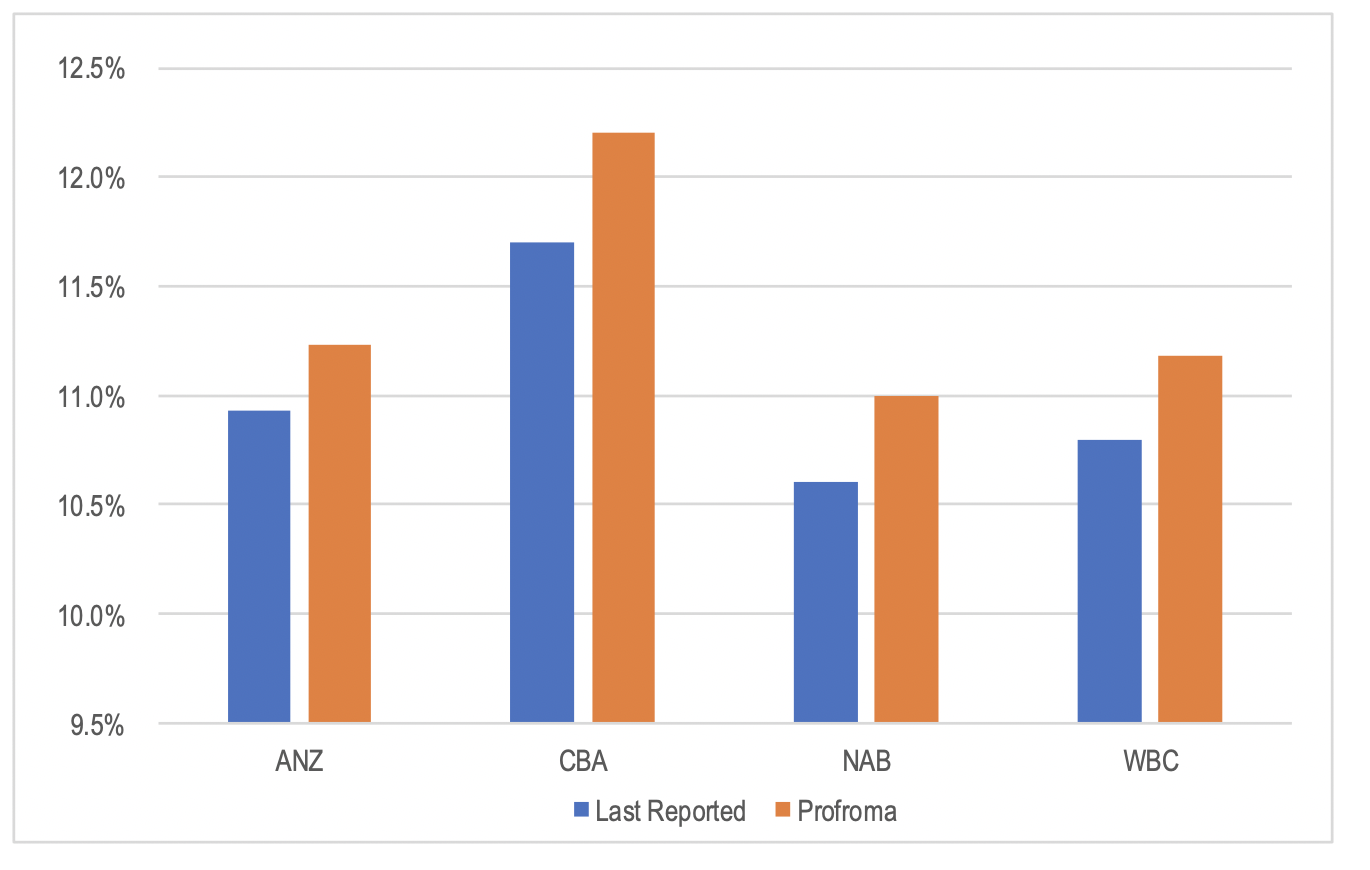
Source: Companies, MIM estimates
CBA is clearly in the strongest capital position, which would explain why its Price to NTA has fallen proportionally less than the other banks.
Another reason that would explain the fall in the price to NTA ratios is the likely enduring impact on demand for debt as a result of the recession. Risk aversion to debt is likely to be higher as result of consumers and businesses feeling the pressure that comes with high debt levels during a period of extreme economic weakness.
The Montgomery Fund and The Montgomery [Private] Fund own shares in the Commonwealth Bank of Australia and Westpac. This article was prepared 09 April 2020 with the information we have today, and our view may change. It does not constitute formal advice or professional investment advice. If you wish to trade CBA or Westpac you should seek financial advice.
This post was contributed by a representative of Montgomery Investment Management Pty Limited (AFSL No. 354564). The principal purpose of this post is to provide factual information and not provide financial product advice. Additionally, the information provided is not intended to provide any recommendation or opinion about any financial product. Any commentary and statements of opinion however may contain general advice only that is prepared without taking into account your personal objectives, financial circumstances or needs. Because of this, before acting on any of the information provided, you should always consider its appropriateness in light of your personal objectives, financial circumstances and needs and should consider seeking independent advice from a financial advisor if necessary before making any decisions. This post specifically excludes personal advice.
INVEST WITH MONTGOMERY
Hello Stuart,
Does that mean the current NAB SPP Offer of $14.15 per New Share is not worth investing in?
Hi Debbie,
We cannot predict the share price. If you believe in the CBA’s base case scenario (-11%) for residential property, then $14.15 for NAB might be cheap. If however you believe CBA’s “prolonged downturn” scenario, then NAB’s 52 week low of $13.20 will likely be tested. And keep in Mind Peter Costello’s comments today; ““… it’s going to take some time to get unemployment back to 5 per cent. If we peak at 10 per cent or 11 per cent, I think we’ll get back to 7 [per cent] pretty quickly, but I think it’s going to be a long hard grind to get back to 5 per cent unemployment.”