
Why I still prefer equities to bonds
When markets are volatile – as they are right now – we start hearing more and more from commentators talking up the benefits of holding bonds in a portfolio. After all, bonds are regarded as safer and more stable than equities. But if you look at long-term returns, another picture emerges.
The inverse relationship between price and yield isn’t the sole preserve of Government bonds. All assets are worth less when interest rates rise, and their prices, therefore, move in the opposite direction to interest rates. An asset is only worth the present value of all its future cash flows. Think of it this way, when rates are higher, you can invest less today to earn a prescribed amount at a future date. That lower amount you can invest today is the present value of the future amount. So, when rates are higher, assets are fundamentally worth less.
As well as their instructional value, Government bonds also give investors a valuation signal or guidepost for all assets.
Is the market today fair value?
When determining a fair Price-to-Earnings (P/E) ratio for the equity market, for example, we start by requiring the yield on a low-risk treasury bond. If we use today’s Australian Government ten-year bond, the rate is 3.96 per cent.
The next step adds a risk premium to cover the additional risk associated with investing in equities. According to various calculators[1] and providers implied market risk premiums vary and for the purpose of this exercise we’ll use 3.43 per cent.
Add the two together and we arrive at 7.39 per cent. In theory, this is the ‘equilibrium’ earnings yield the Australian market should be generating for an investor to be indifferent between investing in Australian equities and bonds. Think of it as an estimated fair value.
The P/E ratio is the inverse of the earnings yield, so by dividing 7.39 per cent into one (1), we can determine the equilibrium P/E ratio for the ASX200, which is 13.5 times earnings.
At the time of writing the MSCI Australia index, covering the top 80 companies, is sitting on an estimated 12-month forward P/E of 13.1 times – about fair value. And according to Bloomberg, the 12-month forward P/E ratio for the ASX200 is 12.9 times, again, about fair value.
For equity investors, the value of the signalling function of bond yields is hard to underestimate. And for longer term investors, it is also helpful to have an appreciation of what the term structure of interest rates might be. What regime are we entering?
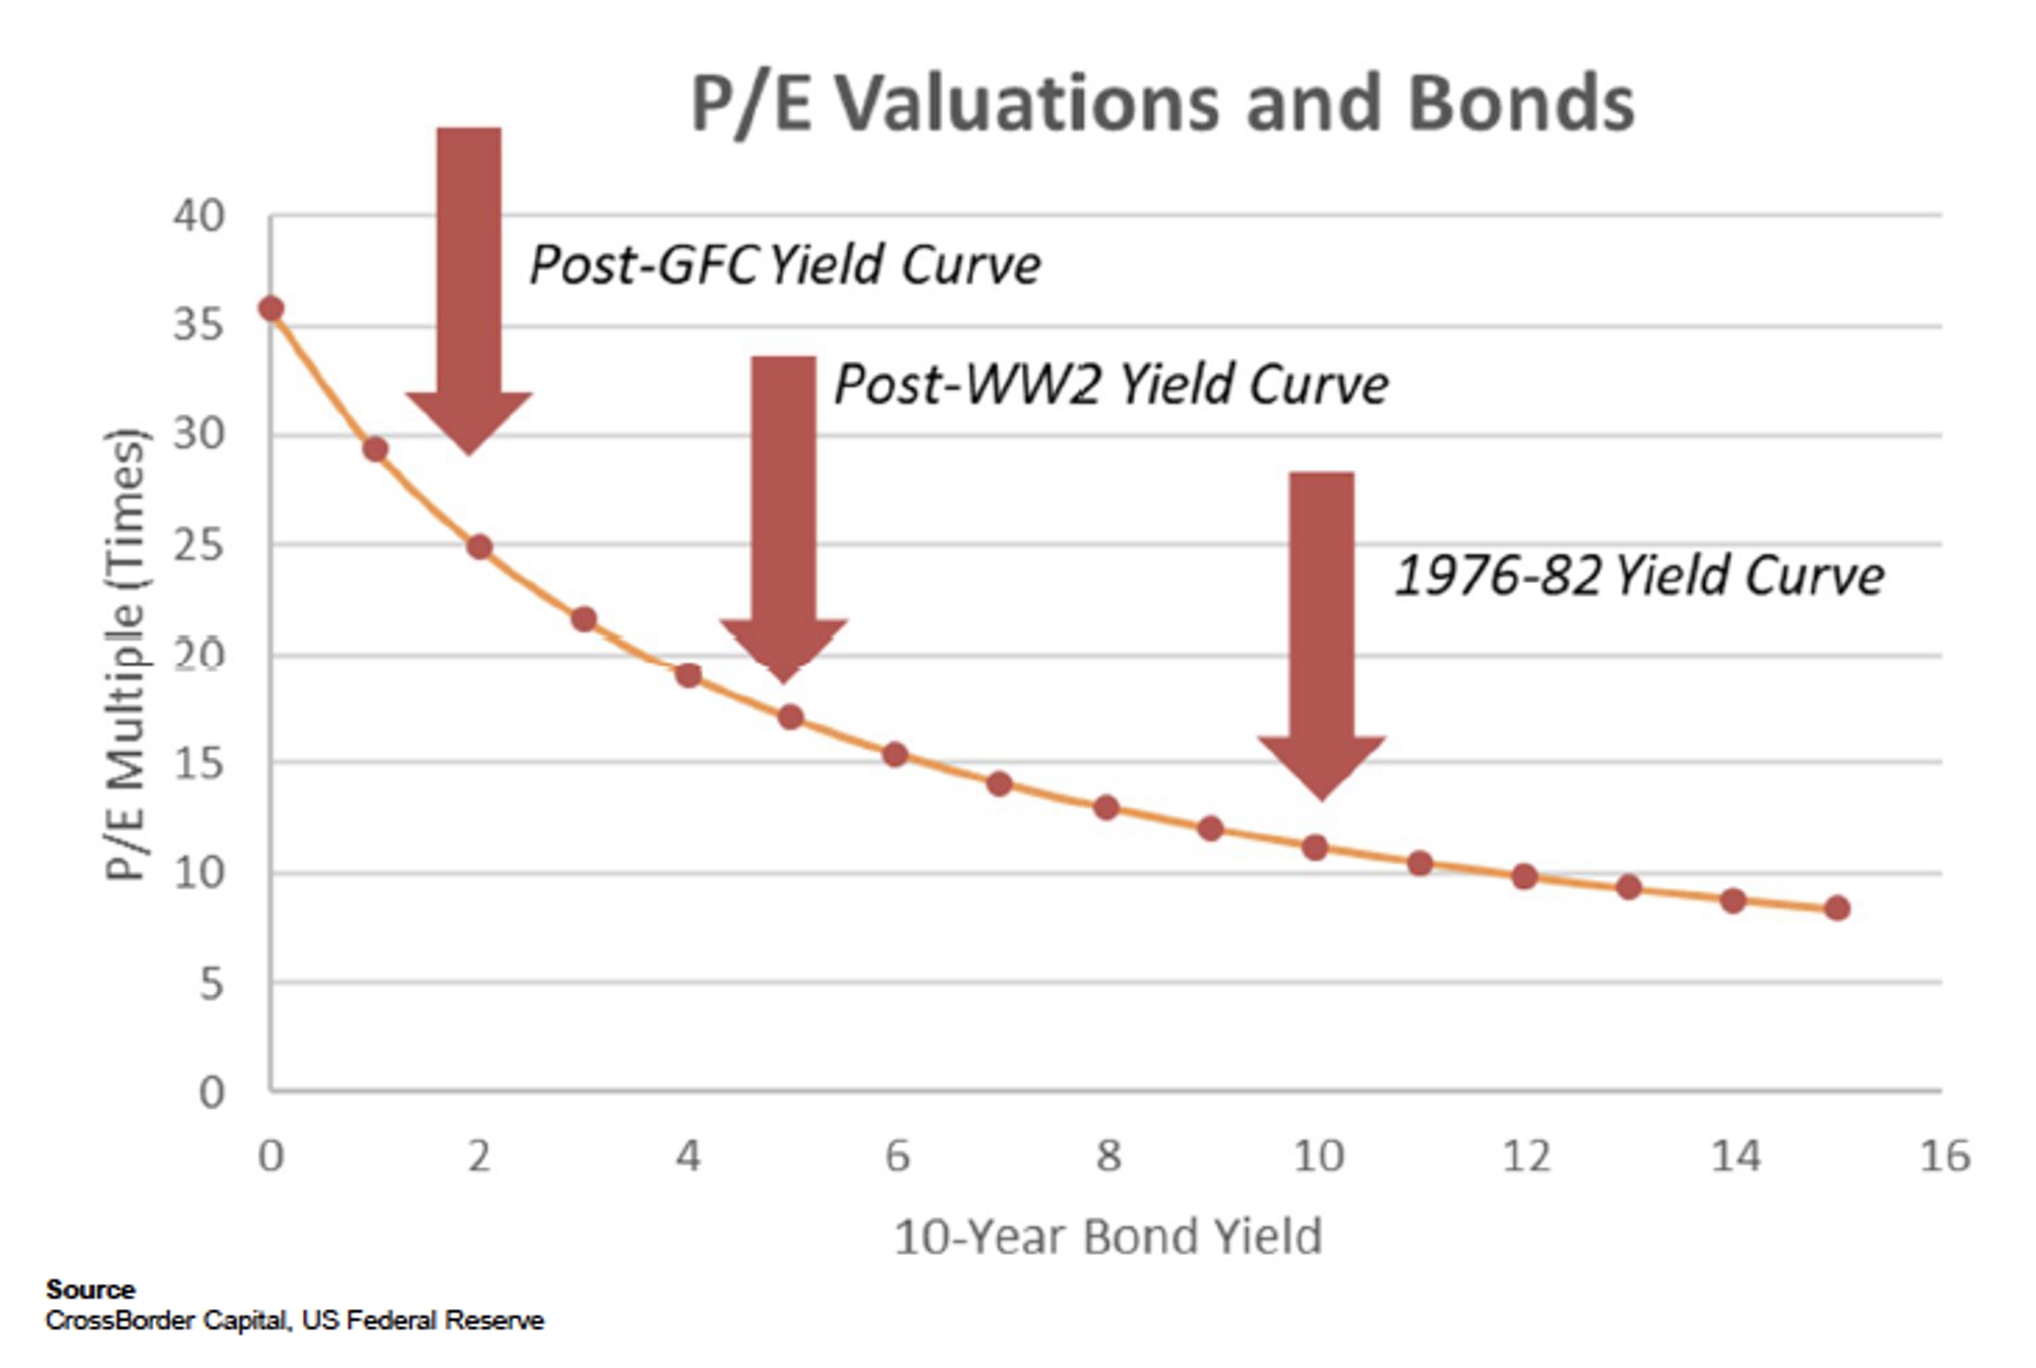
Figure 1, supplied by macroeconomic research house CrossBorder Capital in the UK, reveals a model based on a regression of the U.S. stock market P/E multiple against a time-series of bond yields. The three major marks point to the average 10-year yield from the term structure in each period. For example, the 10-year Treasury Bond Yield averaged approximately five per cent for the post-WWII average yield curve. Depending on the equity market risk premium adopted, this is equivalent to an equilibrium P/E multiple of between 10 and 15 times earnings. According to CrossBorder Capital, however, they observe an equivalent P/E ratio of 15-20 times. According to them, the more recent post-GFC (2008/09) yield curve produces an average yield of nearer two per cent and an equivalent P/E multiple of between 25-30 times.
Reverting to a 1976-82 yield structure – the period during which stubborn U.S. inflation was being tackled by aggressive monetary tightening under Fed Chair Volcker’s “keeping at it” directive – produces a Treasury yield of 10 per cent and a P/E of 10 times. I note CrossBorder’s number might be lower were they to include the equity risk premium.
Figure 1. US Stock Market P/E and U.S. Treasury Bond Yields 1946-2022
A good gauge of future P/E ratios for the aggregate indices could be determined if the future yield curve could be predicted.
Perhaps the past offers some insight. CrossBorder research provides four choices from their assessment of prior experience.
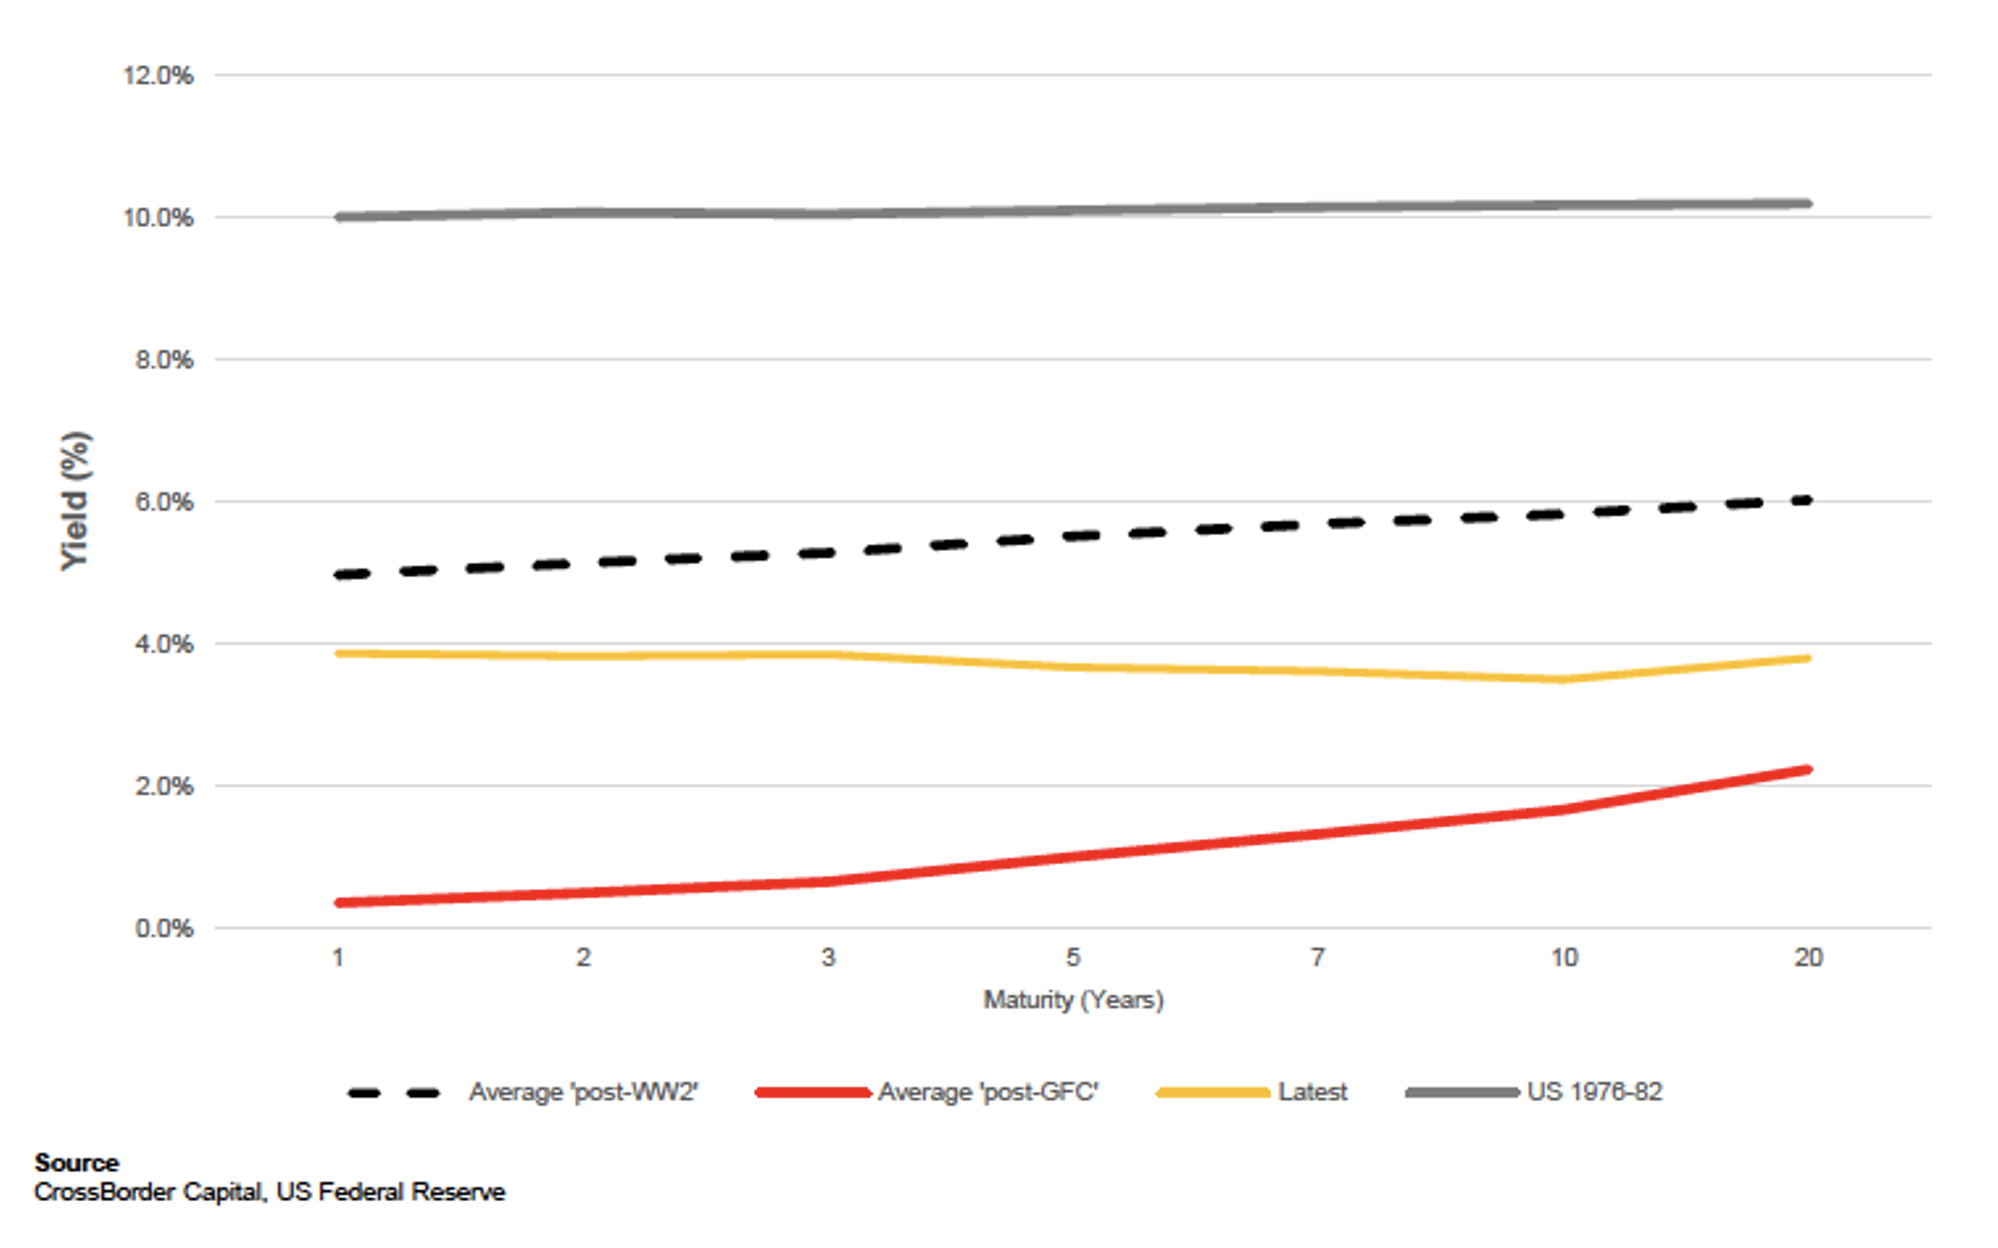
Their first observation is the U.S. financial sector is now far larger in relative terms, more integrated with the U.S. real economy, and less resilient to the extremes of monetary tightening such as was experienced in the late-1970s. Therefore, that period’s term structure is seen as an anomaly (see Figure 2) and unlikely to be repeated.
Similarly, and despite sound reasoning to justify expecting a similar term structure to the mean of the post-war years (the dashed line in Figure 2.), globalisation (witness the UN discussing debt forgiveness for poorer nations collapsing under a mountain of debt denominated in U.S. dollars), today’s economic climate, large debts and ageing Western populations, suggest such a term structure could not be supported or survived!
Consequently, Crossborder land somewhere in the middle, between the average of the post-GFC period and the long-term average of the post WWII period (between the red and dashed lines).
They conclude a future U.S. market P/E of around 20-25 times earnings. This compares to the current P/E of 15.8 times for the S&P500 (18 October 2022).
Figure 2. US Yield Curve structures 1946-2022
In such an environment, bonds may be “safe and stable” but ultimately lower-returning compared to equities, which generate a dividend yield, earnings growth, and potentially P/E expansion from current levels.
[1] We’ve used http://www.market-risk-premia.com/au.html for this example.
Roger Montgomery is the Founder and Chairman of Montgomery Investment Management. Roger has over three decades of experience in funds management and related activities, including equities analysis, equity and derivatives strategy, trading and stockbroking. Prior to establishing Montgomery, Roger held positions at Ord Minnett Jardine Fleming, BT (Australia) Limited and Merrill Lynch.
He is also author of best-selling investment guide-book for the stock market, Value.able – how to value the best stocks and buy them for less than they are worth.
Roger appears regularly on television and radio, and in the press, including ABC radio and TV, The Australian and Ausbiz. View upcoming media appearances.
This post was contributed by a representative of Montgomery Investment Management Pty Limited (AFSL No. 354564). The principal purpose of this post is to provide factual information and not provide financial product advice. Additionally, the information provided is not intended to provide any recommendation or opinion about any financial product. Any commentary and statements of opinion however may contain general advice only that is prepared without taking into account your personal objectives, financial circumstances or needs. Because of this, before acting on any of the information provided, you should always consider its appropriateness in light of your personal objectives, financial circumstances and needs and should consider seeking independent advice from a financial advisor if necessary before making any decisions. This post specifically excludes personal advice.