
What to Watch
We have often written about the boom in non-income producing assets – such as collectibles – and the associated world record prices, as being a sign of the very late stages of a credit cycle. Eventually, the boom will unwind – it always does – and one consistent signal has usually been investors pulling back from one asset class even while other asset classes continue to party. That investors are rapidly departing corporate credit markets even as equities attempt to surmount all times highs, is something investors should at least be aware of.
Following is a collection of quotes, from articles we have been reading, that we think should cause equity investors to pause and reflect…
“Despite the sharp rise in market volatility, investor bullishness and complacency is noteworthy. This is especially the case in the heavily-crowded U.S. technology sector. The entrenched bullishness toward the U.S. stock market is reminiscent of the heavily-crowded positioning and entrenched bullishness toward the U.S. dollar when it was in the process of forming an important top during 2016.”
Referring to the recent sharp selloff; “The selloff came after investors poured cash into technology shares last week at a rate not seen since the height of the dot-com bubble. Investors last week pumped $3.3 billion into the PowerShares QQQ Trust Series 1, the biggest exchange-traded fund tracking the Nasdaq 100 index, on speculation the group would continue its market-beating run.”
“A separate J.P. Morgan report noted that investors poured $34 billion into equity ETFs last week—the biggest weekly inflow ever.”
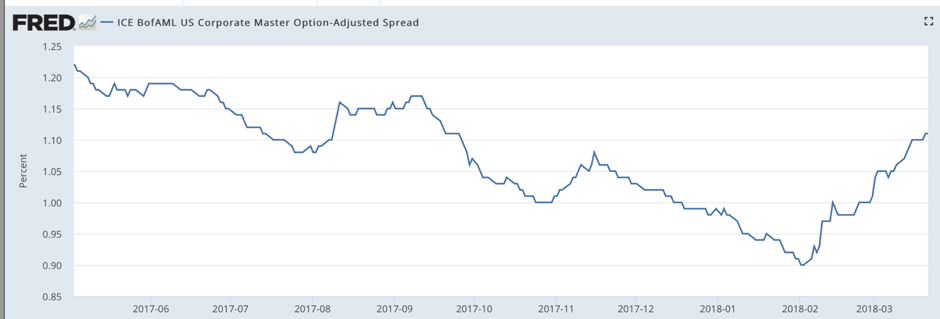
“Equity investors grappling with a technology selloff, trade tensions and hawkish monetary chatter have a new foe to contend with: growing angst in credit markets. After resisting the full force of the gales that swept through markets earlier this year, corporate bonds are sending ominous messages. Traders are jumping out of the asset class as investment-grade spreads sit near their widest in six months and yields rise to the highest in more than six years— just as stock investors seek to recover from the worst S&P 500 correction in two years.”
Figure1. Corporate Bond Spreads
“It is a sign of our debt-dependent times that forecasts for huge federal borrowing needs—now in excess of 100% of GDP within a decade—barely induce a shoulder-shrug. This stands in sharp contrast to the 1980s, when federal publicly-held debt topped-out at nearly 40%, and many observers warned of doomsday scenarios. But, demographics were more favourable then, as was productivity growth, financial-sector deregulation, and the benign inflationary environment. These factors have largely turned into headwinds, but complacency over rising debt and deficits has persisted anyway.”
“Sooner or later, a reality check will occur, which is why the TIPS (Treasury Inflation-Protected Securities) market should be setting off alarm bells. Adding to this concern has been the recent blowout in LIBOR and the LIBOR-OIS spread (the latter being the overnight index swap, which has more than doubled since January) to levels last witnessed during the GFC—a sign that monetary policy has tightened considerably.”
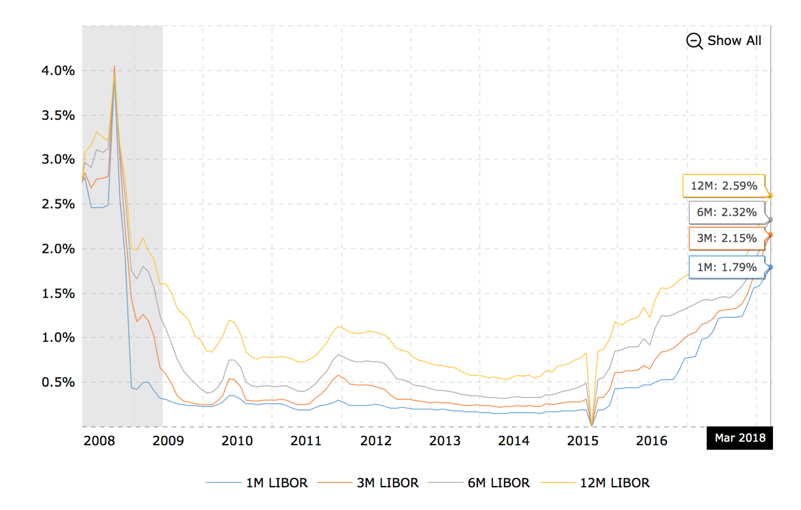
The three-month London interbank funding rate rose to 2.27 percent last week, the highest since 2008, which will make funding more costly for some borrowers outside the U.S. including Australian banks where funding costs are on track to experience their biggest monthly funding cost increase in nearly eight years. In an interview with Bloomberg Quint, Morgan Stanley’s Chief Asia and EM strategist, Jonathan Garner, recently warned that rising rates for private borrowers is a bigger concern than a more hawkish Fed.
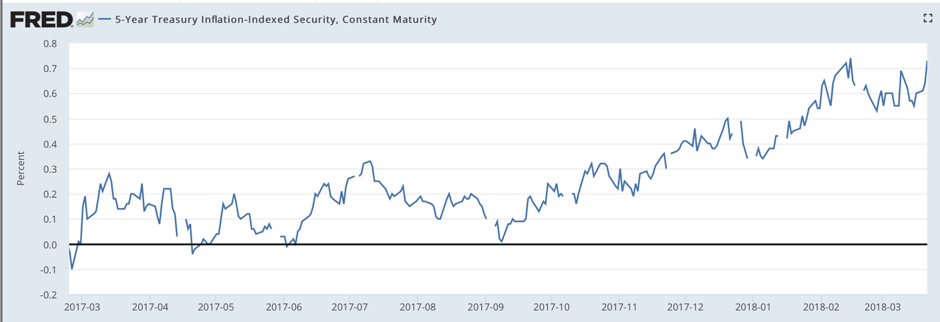
Figure 3. Libor Rates
“While QE was deflationary for commodities, it was inflationary for financial assets, especially stocks and bonds. One could therefore argue that reversing QE (via QT) will trigger considerably more volatility in both the stock and bond markets in the months ahead, as cost-of-capital assumptions increase, opportunity-costs rise, earnings multiples contract and credit stress intensifies among highly-leveraged businesses.”
Figure 4., shows the 12-month annualised Sharpe Ratio and reveals that the combination of very high returns and very low volatility in the S&P500 recently is an anomaly and you have to go back to the 1950’s to see it previously. In any event, the chart shows that a combination of higher volatility and lower returns is more normal and is very likely to return.
Figure 4. 12-month annualised S&P500 Sharpe Ratio to Dec.31, 2017
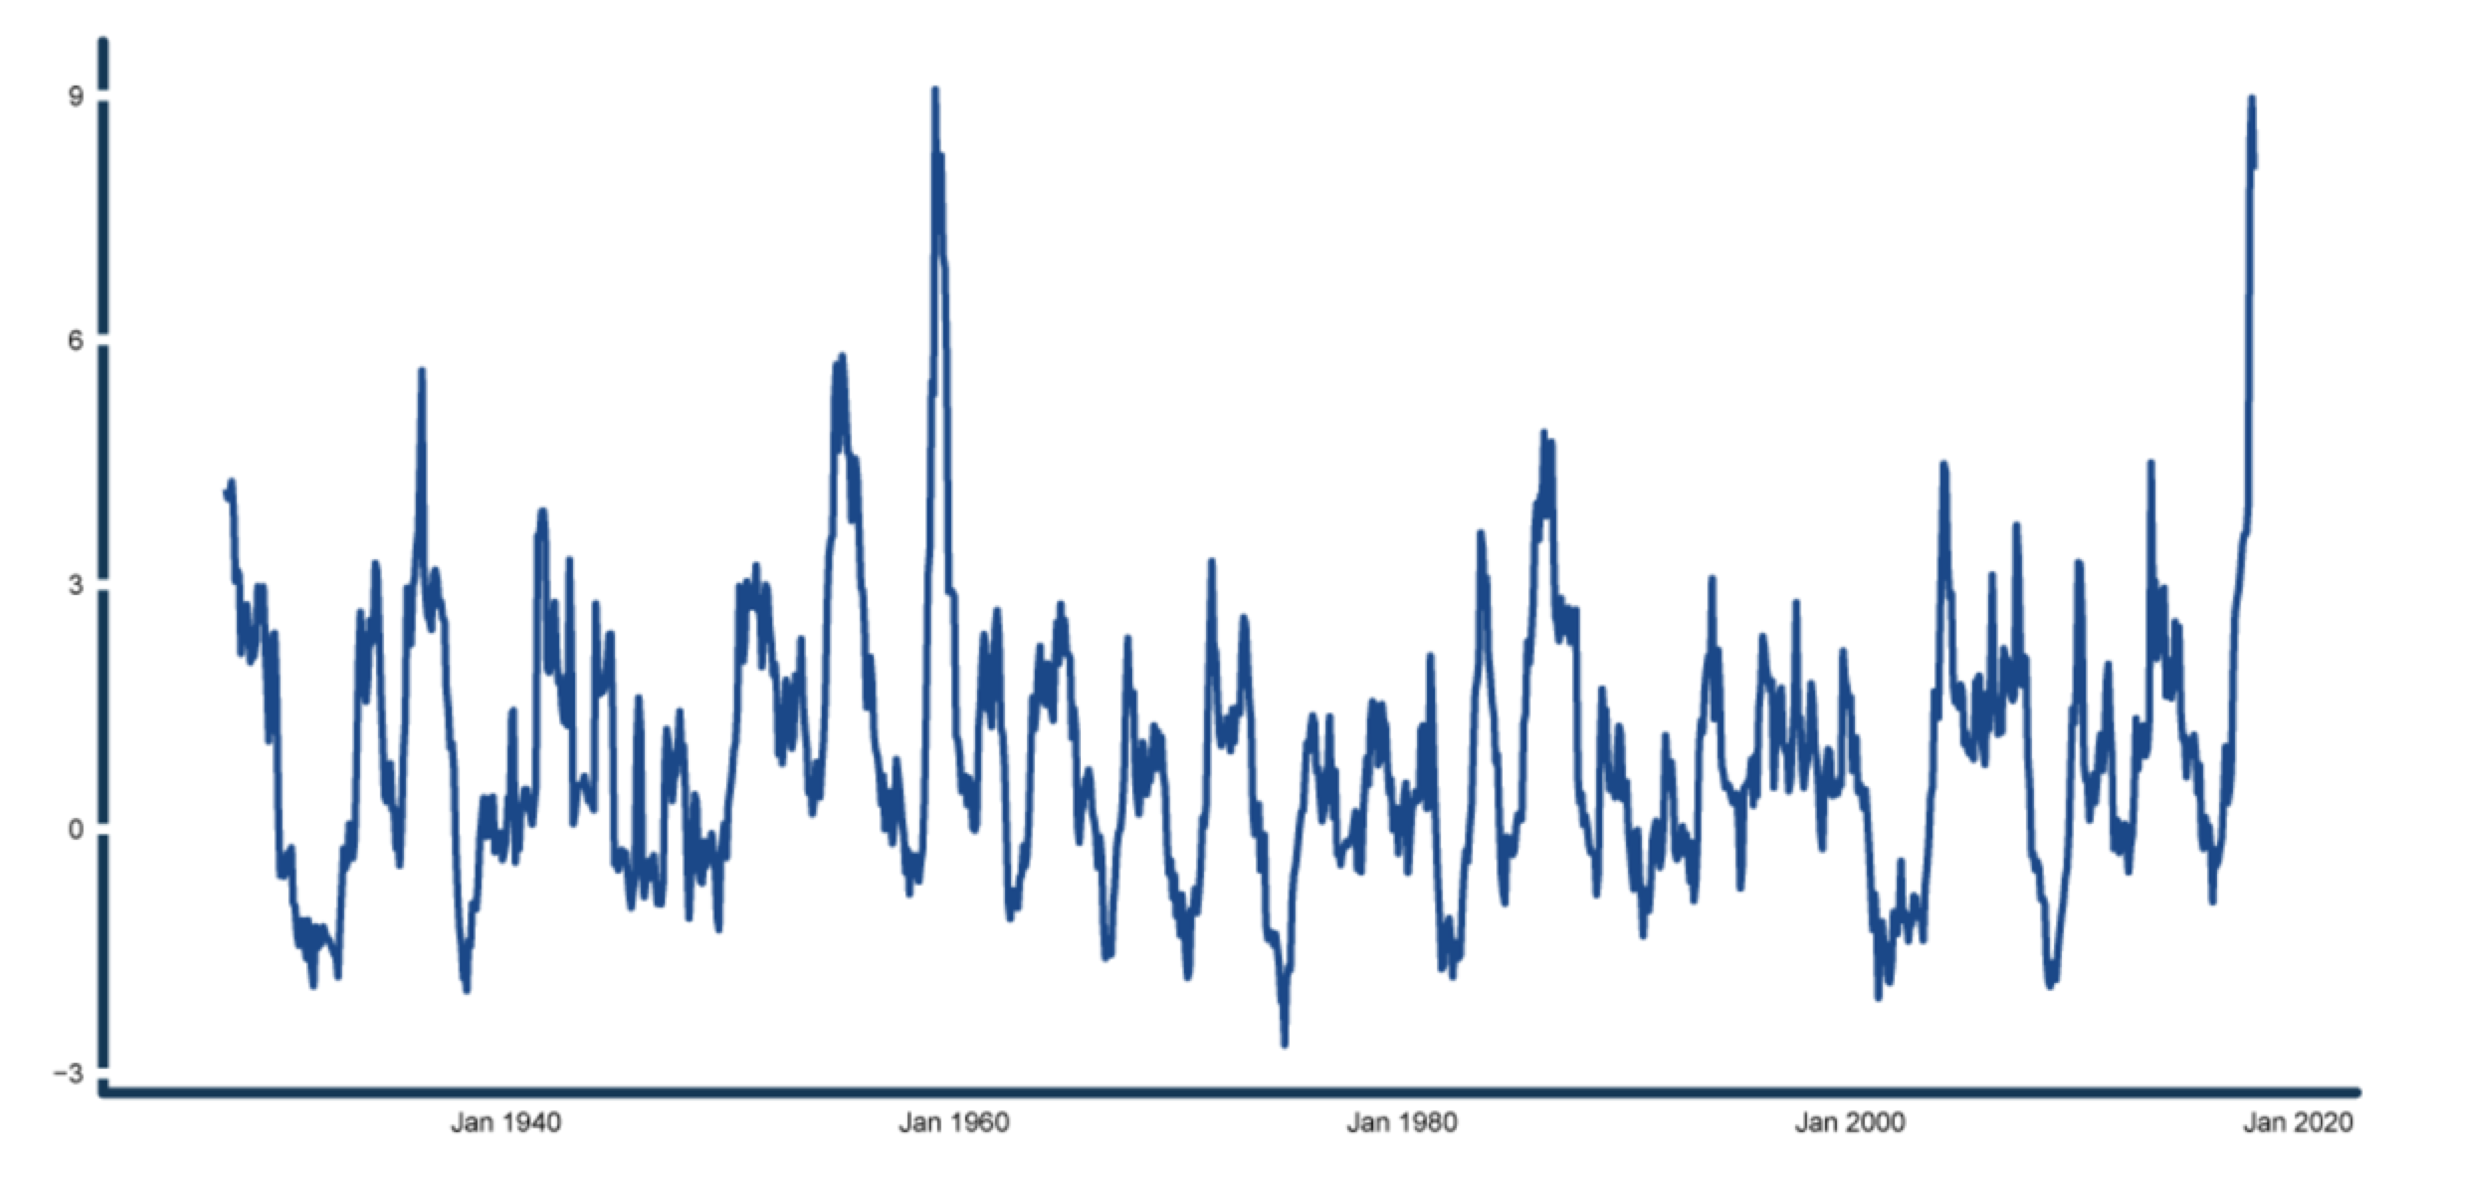
Figure 5., shows that when volatility (risk) as measured by the VIX index, picks up, P/E’s (price to earnings multiples) contract. Investors are simply less willing to make optimistic assumptions about a company’s prospects, and therefore less willing to pay higher multiples, when a fear of loss replaces the fear of missing out.
Figure 5. Volatility vs P/E S&P500

Roger Montgomery is the Founder and Chairman of Montgomery Investment Management. Roger has over three decades of experience in funds management and related activities, including equities analysis, equity and derivatives strategy, trading and stockbroking. Prior to establishing Montgomery, Roger held positions at Ord Minnett Jardine Fleming, BT (Australia) Limited and Merrill Lynch.
He is also author of best-selling investment guide-book for the stock market, Value.able – how to value the best stocks and buy them for less than they are worth.
Roger appears regularly on television and radio, and in the press, including ABC radio and TV, The Australian and Ausbiz. View upcoming media appearances.
This post was contributed by a representative of Montgomery Investment Management Pty Limited (AFSL No. 354564). The principal purpose of this post is to provide factual information and not provide financial product advice. Additionally, the information provided is not intended to provide any recommendation or opinion about any financial product. Any commentary and statements of opinion however may contain general advice only that is prepared without taking into account your personal objectives, financial circumstances or needs. Because of this, before acting on any of the information provided, you should always consider its appropriateness in light of your personal objectives, financial circumstances and needs and should consider seeking independent advice from a financial advisor if necessary before making any decisions. This post specifically excludes personal advice.
Hi Roger
Is there a reason news from the MOGL dos not flow thru to retail trading platforms like ETrade, Iress act ?
We’ll look into that Tony and speak to our ASX representative. Thanks for the ‘heads up’.
Hi Roger
Ray Dalio has publicly stated that the US is at the end it’s short term debt cycle, although the end of the long term debt cycle in the US occurred in 2008. Do you believe that Australia is at the very end of its own long term debt cycle?
It does look that way.
Roger
Are you using a theory for ‘credit cycle’ and its stages. I am thinking here of Phil Anderson or Fred Harrison who think it is roughly an 18 year cycle but you might be thinking of someone else or maybe using a heuristic?
Best John
See Ray Dalio.
Andrew recently answered my question in regards to how exposed the Montaka fund would be willing to go as follows:
“Peter, we provide soft guidance that Montaka’s net market exposure will typically range between 30-70%. There may be extreme times when we go outside of this range, though such an occurrence has not yet happened.”
I understand that Andrew runs the Montaka Fund and I have complete confidence in him. I am just curious as to what might constitute an ‘extreme’ scenario if what you have presented above is not yet there. Are we close to an extreme scenario?