
Putting the recent global correction into perspective
As most Australians venture back to work throughout the month of January, it will be somewhat of a relief that global equity markets have staged a U-turn from the previous quarter and look set to post a solid positive return for the month (as at the time of writing, being 25/1/19 the MSCI World index MTD was 4.5 per cent higher).
However, most of us will not have forgotten about the correction that took place in the major global equity markets during last year. The Montgomery Global team produced this chart in their quarterly letter to illustrate the volatility, magnitude and timing of the corrections that took place last year.
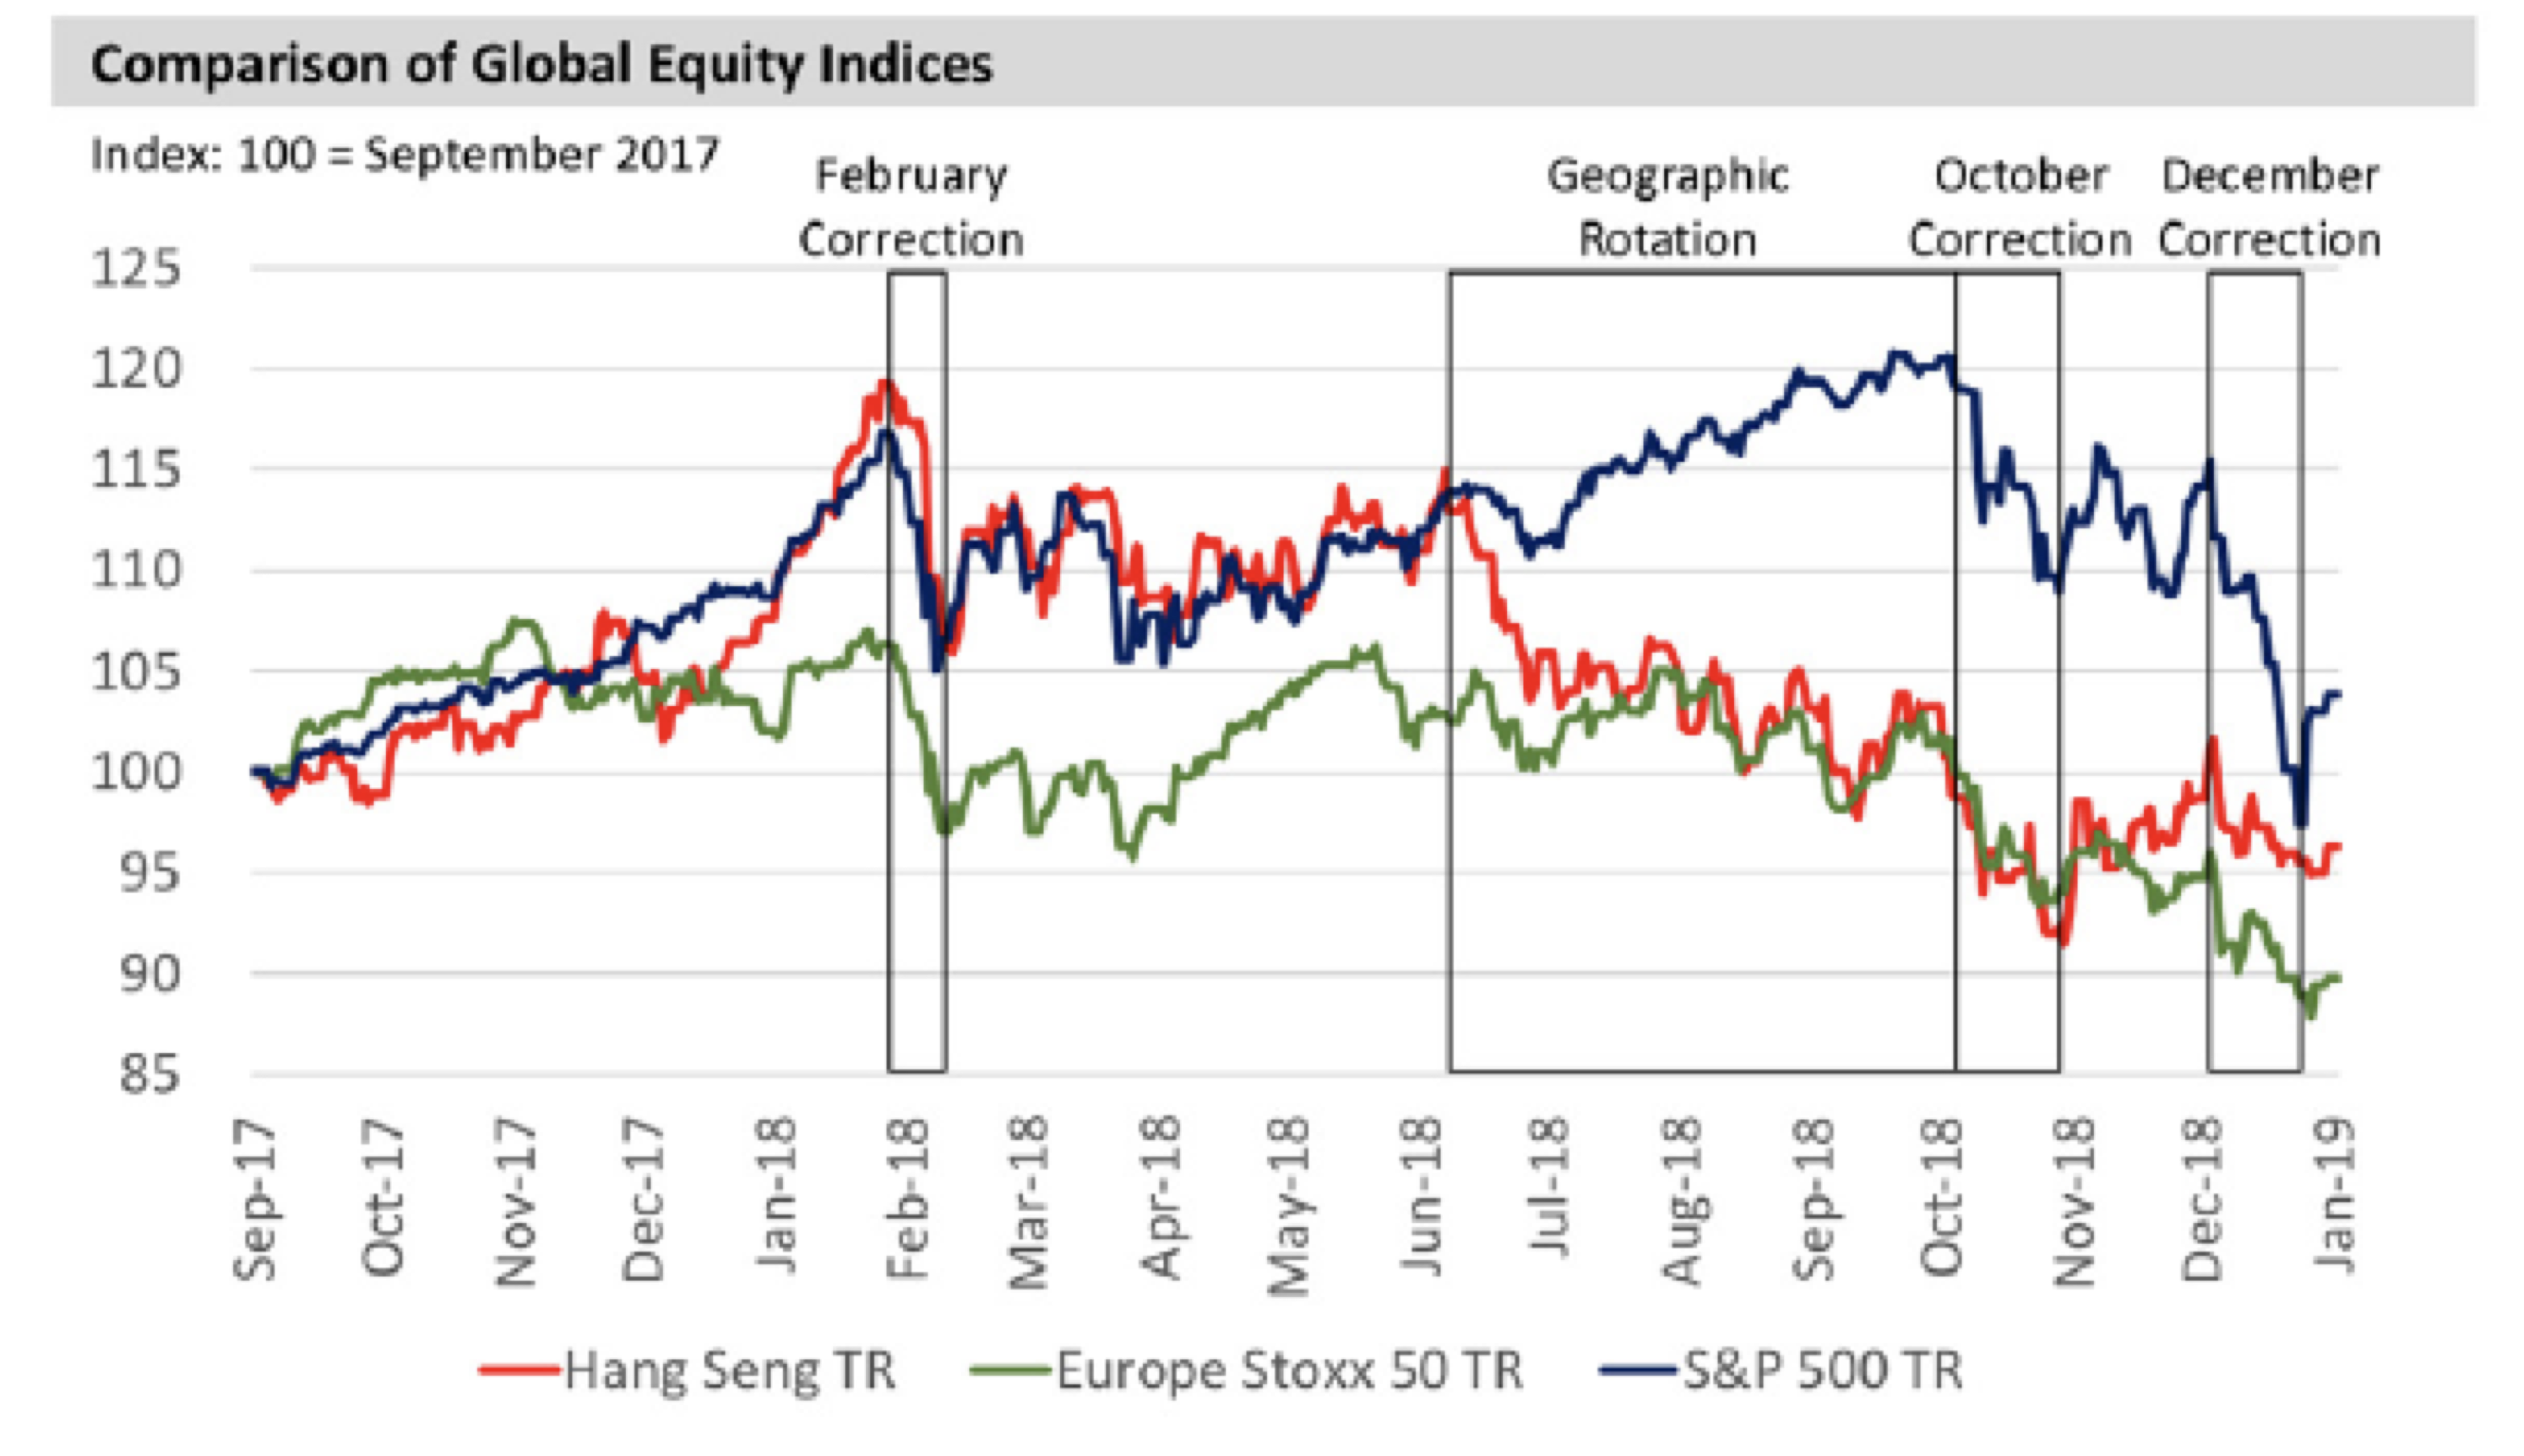
Source: Bloomberg, MGIM
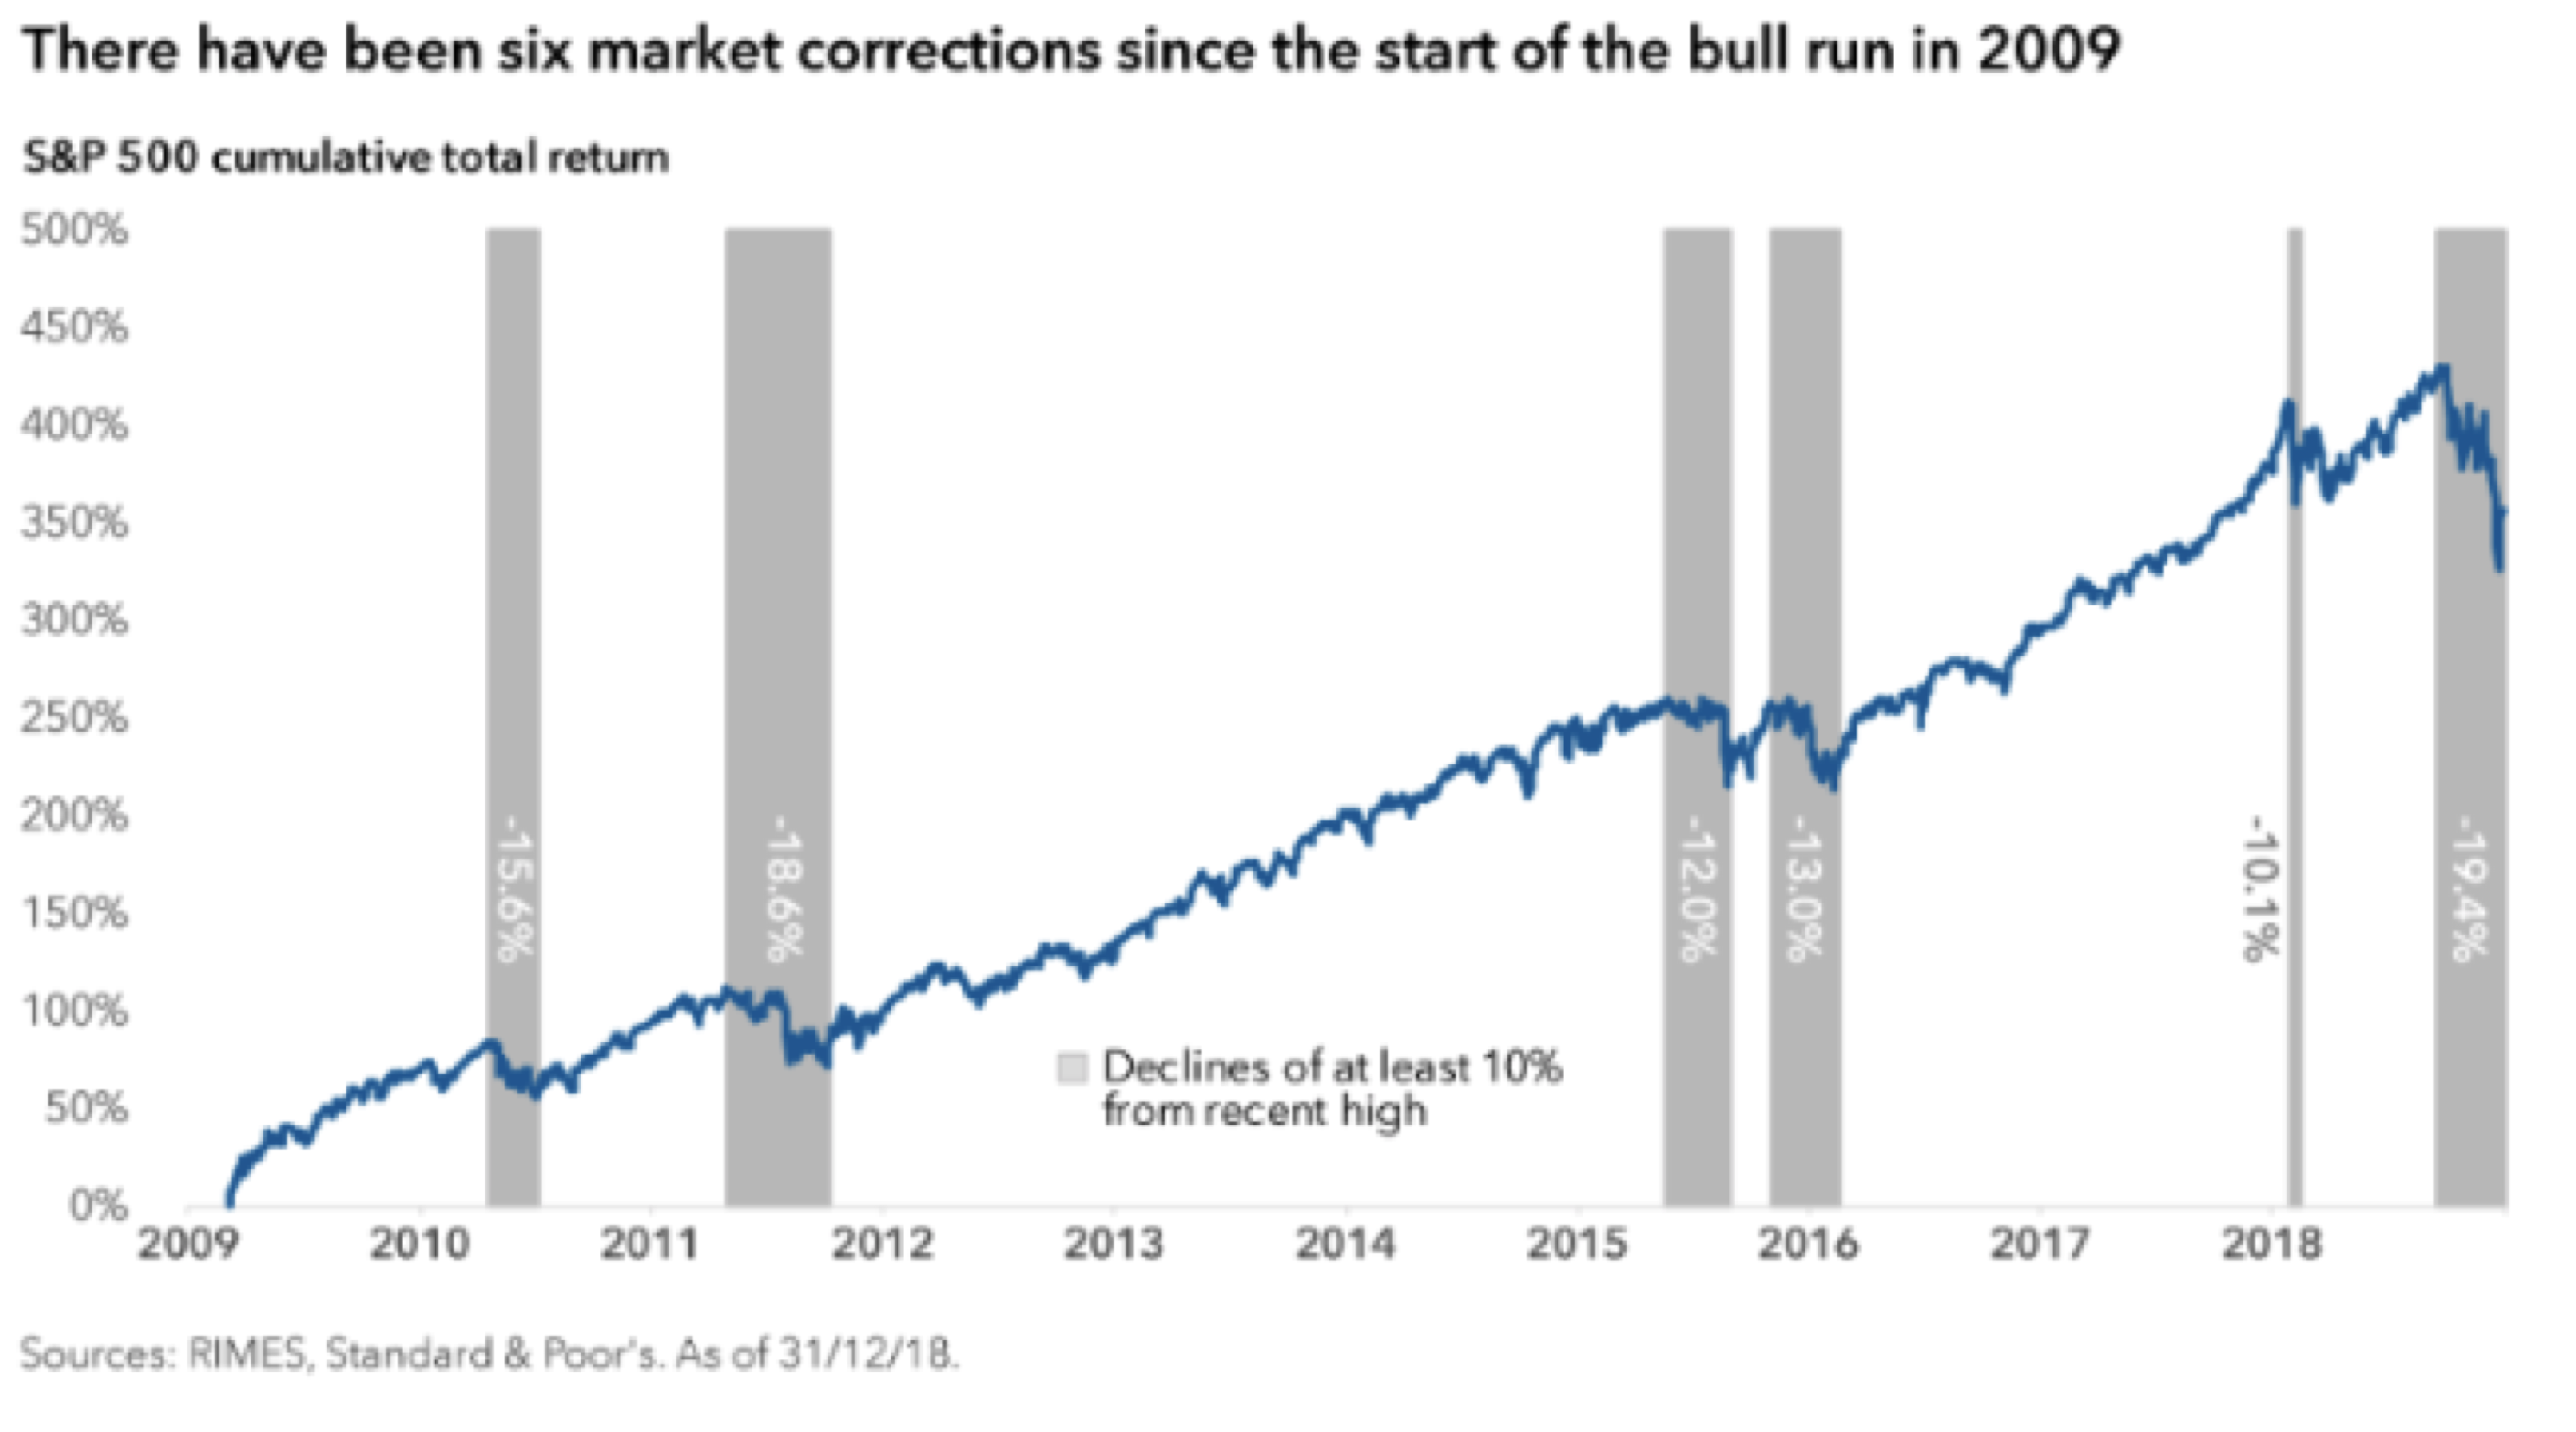
If we look specifically at the U.S. Equity market as represented by the S&P 500 Composite Index, then we saw a slide of nearly 20 per cent (19.4 per cent to be exact) which puts it firmly in a “correction” category, (a fall of more than 10 per cent) and almost into a “bear market” territory (a fall more than 20 per cent) peak to trough.
During this period, I witnessed at least a dozen investors redeeming their holdings in our equity funds citing nervousness of their capital going down if markets continued to fall. Interestingly our reaction here at Montgomery was to spend some of our cash reserves and buy more high qualities stocks at cheaper prices.
In trying to put this recent “correction” into context, because who knows if it is the start of a much bigger decline, I wanted to draw upon a recent article by the Capital Group who looked at the history of market declines.
Some of their key findings and charts are reproduced here:
- There have been six market declines of at least 10 per cent since this last bull market which started in March 2009 as can be seen below.
- Market corrections are common and over the last 50 years of S&P 500 Composite Index returns a 10 per cent or more fall happens on average once a year and lasts for 117 days until a new high is produced. A fall of 15 per cent or more occurs about every 3.5 years and lasts 275 days and a fall of 20 per cent or more occurs about once every 6.3 years.
- Equity returns are often strongest after a decline when investors believe that the market has overreacted to the downturn. The average 12-month return immediately following a 15 per cent or greater decline is 55 per cent. That’s why it often can pay to remain calm and stay the course.
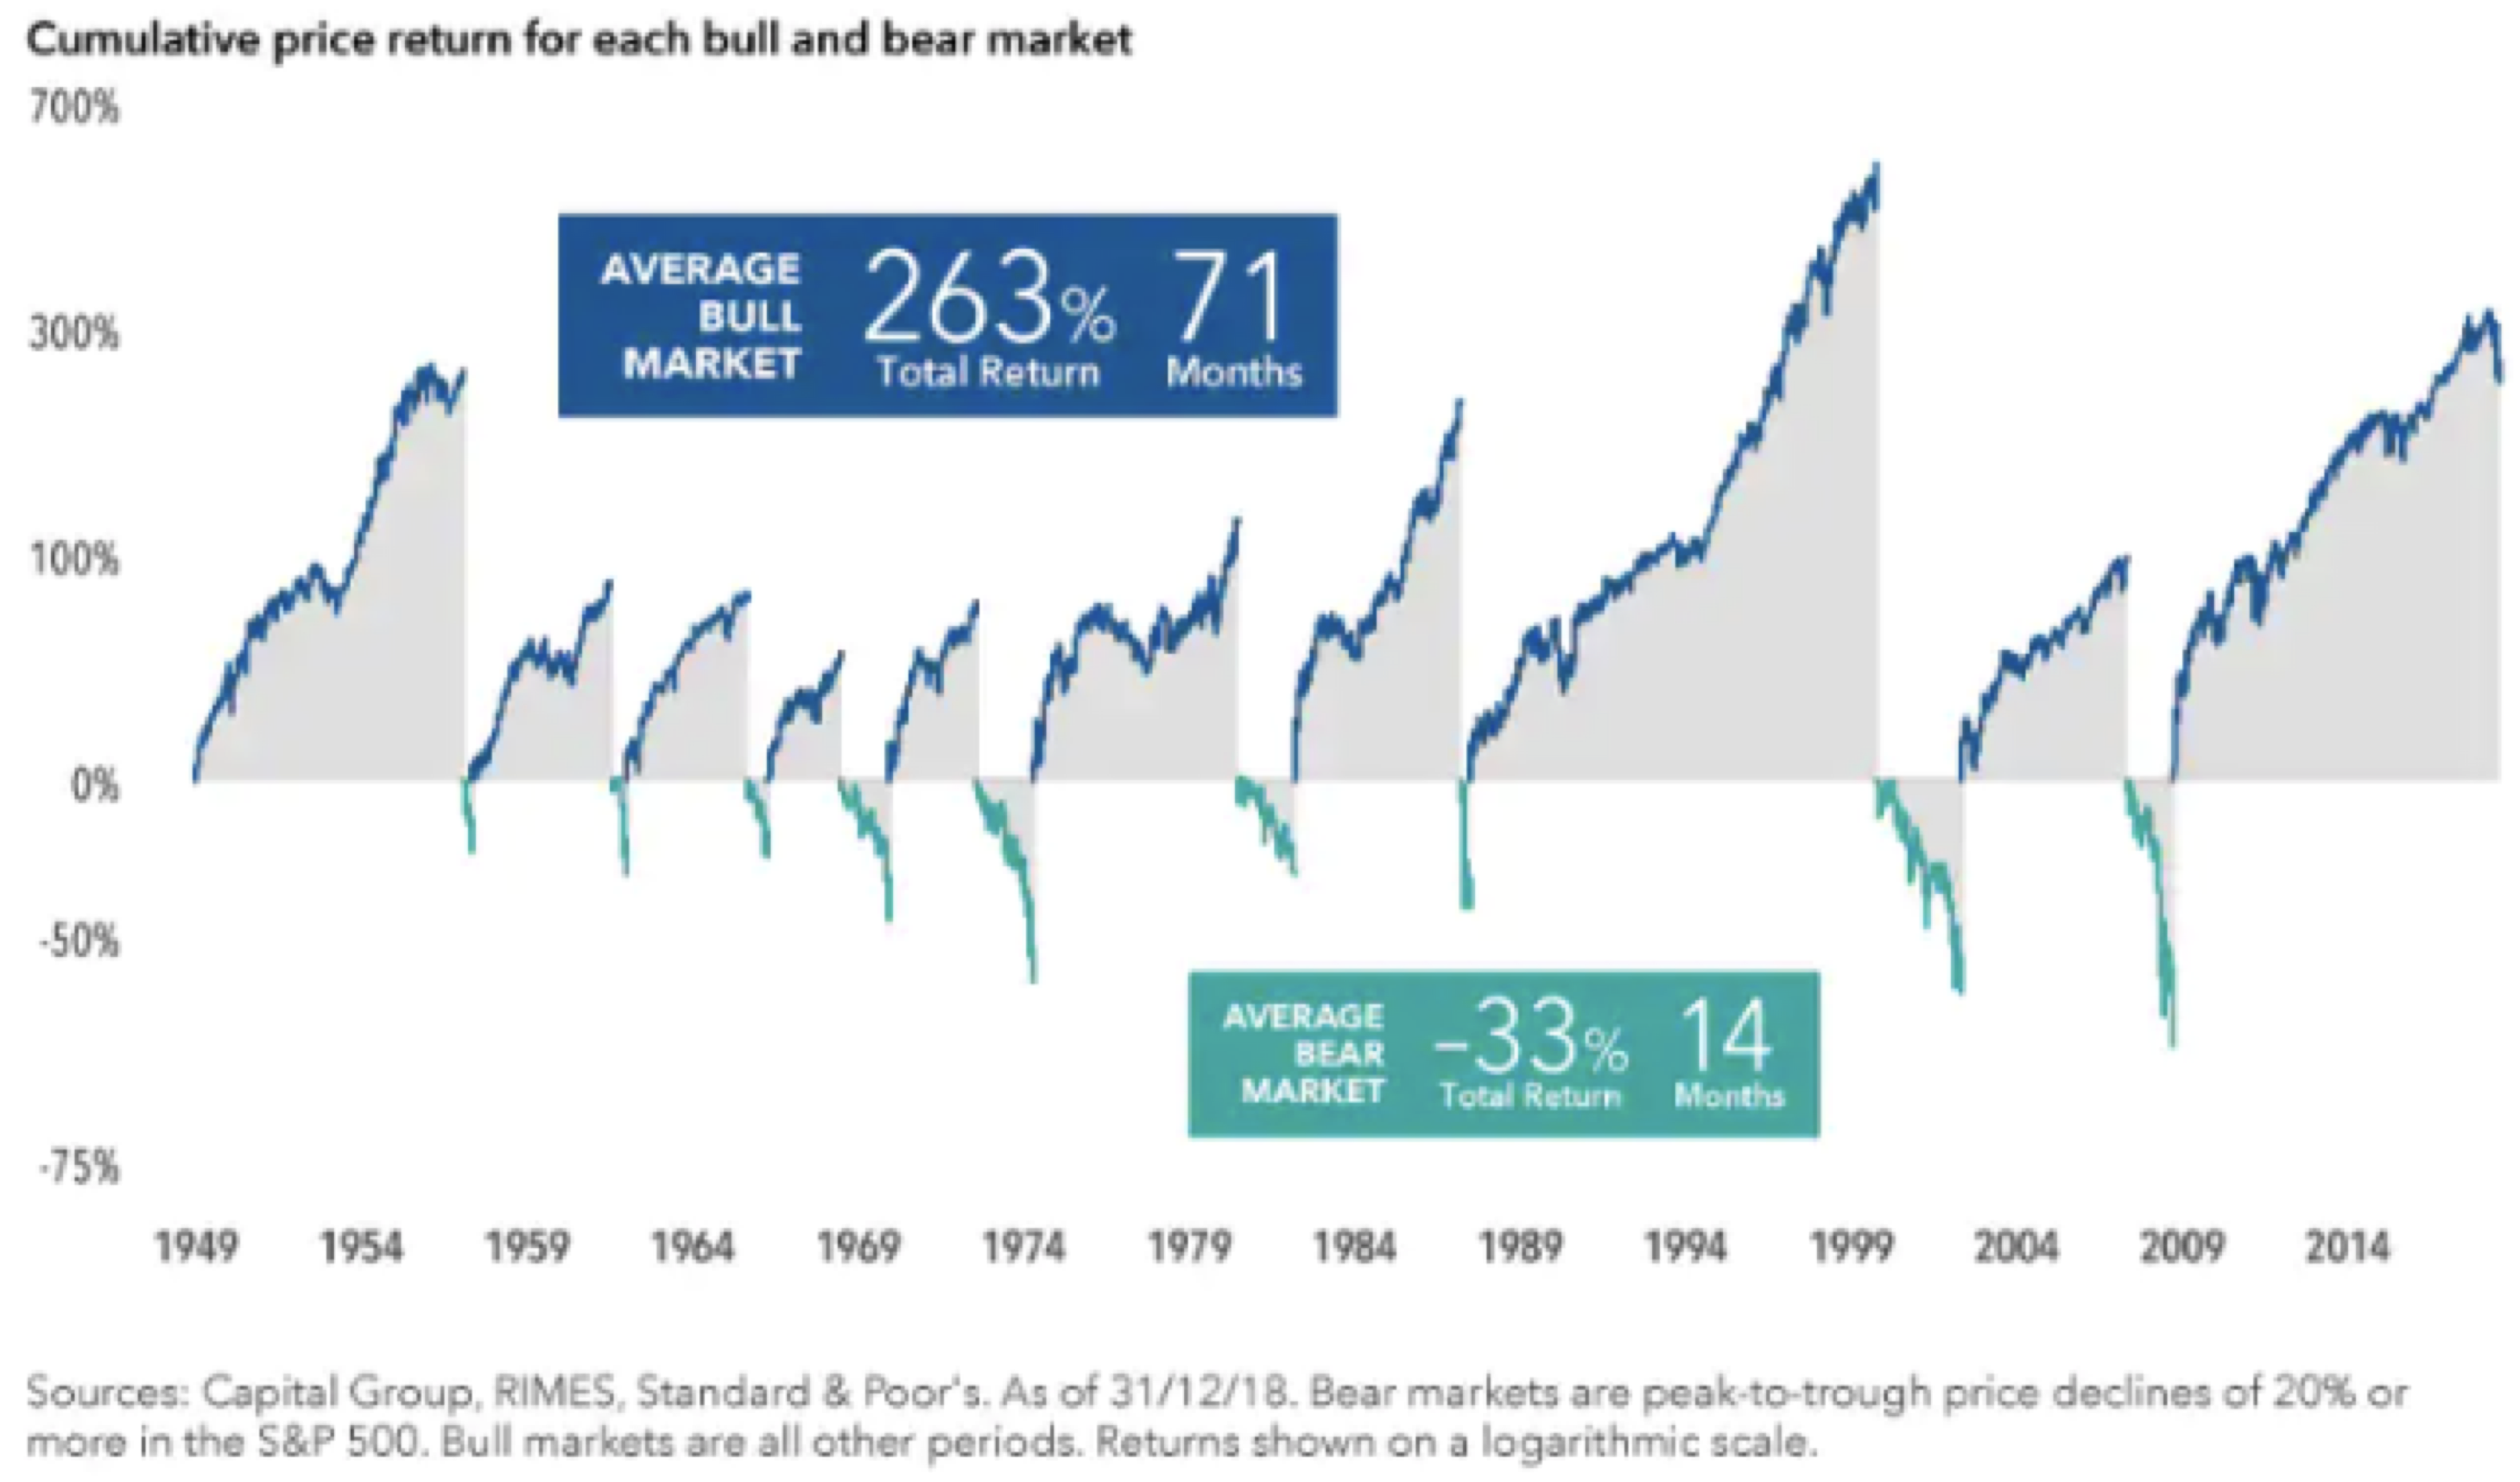
- A long-term focus can help investors put bear markets into perspective. Since 1949 there have been nine periods of 20 per cent or greater declines in the S&P 500. And while the average 33 per cent decline of these cycles can be painful to endure, missing out on part of the average bull market’s 263 per cent return could be even worse. Bear markets have averaged 14 months, a relatively short time compared with the 71 months of the average bull market.
Finally, as we have written about here on the blog before and as Dalbar studies have shown, investors often don’t do as well as the funds they invest in due to two principal behavioural biases that can kick in during times of market stress, causing investors to capitulate and sell at the wrong time for the wrong reasons: herding and loss aversion. The urge to do as others are doing is a particularly powerful bias in human behaviour that has aided social development, but is not always helpful in investing.
And at this point it’s also useful to consider what some of the most successful investors have had to say about their experiences while investing.
Sir John Templeton
“The first rule of investment is ‘buy low and sell high’, but many people fear to buy low because of the fear of the stock dropping even lower. Then you may ask: ‘When is the time to buy low?’ The answer is: When there is maximum pessimism.”
Warren Buffett
“You pay a very high price for a cheery consensus. It won’t be the economy that will do in investors; it will be the investors themselves. Uncertainty is actually the friend of the buyer of long-term values.”
Peter Lynch
“Everyone has the brainpower to make money in stocks. Not everyone has the stomach. If you are susceptible to selling everything in a panic, you ought to avoid stocks and mutual funds altogether.”
Nassim Nicholas Taleb
“When an investor focuses on short-term investments, he or she is observing the variability of the portfolio, not the returns – in short, being fooled by randomness.”
Seth Klarman
“The stock market is the story of cycles and of the human behaviour that is responsible for overreactions in both directions.”
Benjamin Graham
“In the short run, the market is a voting machine, but in the long run it is a weighing machine.”
Scott Phillips joined Montgomery Investment Management in 2013.
Scott joined the firm from BlackRock Investment Management, where he was Managing Director, Head of Retail Australia for 12 years.
This post was contributed by a representative of Montgomery Investment Management Pty Limited (AFSL No. 354564). The principal purpose of this post is to provide factual information and not provide financial product advice. Additionally, the information provided is not intended to provide any recommendation or opinion about any financial product. Any commentary and statements of opinion however may contain general advice only that is prepared without taking into account your personal objectives, financial circumstances or needs. Because of this, before acting on any of the information provided, you should always consider its appropriateness in light of your personal objectives, financial circumstances and needs and should consider seeking independent advice from a financial advisor if necessary before making any decisions. This post specifically excludes personal advice.
That S/P 500 graph looks nothing short of terrifying to me when you overlay it with a long term interest rate graph. And while taking into consideration the Cape Shiller index at around 30 after dropping from over 30, that alone is what stops me buying the dips or bull traps.
One only has to look at what has happened %100 of the times the Cape shiller index crossed the 30 mark in the last 120 years or so , that alone should scare the pants off you.
I like you have no crystal ball, but I have more faith in the Cape shiller index than Donald Trumps take on the markets.
Until proven otherwise I’m not buying the dip.
It seems the market is now in full control of the Fed, does this mean QE forever? probably, gold maybe the last place to hide/wait it out. Or Montaka if they get the shorts right.