
Private Credit outclassing the asset classes
Every six months, Morningstar assembles its Annual Asset Class Returns “gameboard” (Figure1.). The matrix displays the performance of seven major asset classes over the last 20 financial years to 30 June 2023. While the compilation doesn’t offer much by way of predictive value, its usefulness is in its educational content.
For example, it is clear no asset class wins consistently, and the winner is possibly random although, over 20 years, domestic and international equities featured in first or second place 75 per cent of the time (i.e. 15 of the 20 years under review). Another observation is that while domestic small caps were the most frequent winner in terms of annual returns, domestic or international equities also produced negative returns in five of the twenty years (25 per cent of annual observations). Diversification is clearly necessary. More on that in a moment.
Figure 1. Annual Asset Class Returns – Financial Year
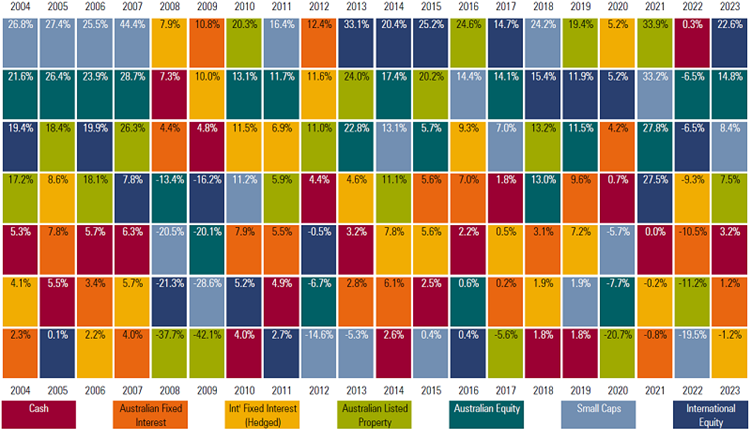
Cash – RBA Bank accepted Bills 90 Days; Aust. Fixed Interest – UBS Composite 0+ Yr TR AUD; Intl. Fixed Interest |H) – BarCap Global Aggregate TR HDG; A-REITs – S&P/ASX 300 A-REIT TR; Global REITs |H) – UBS Global Investors Ex AUS NR Hdg AUD; Aust. Equity – S&P/ASX 200 TR; Small Caps – S&P/ASX Small Ordinaries TR; Intl. Equity – MSCI World Ex Australia NH AUD © 2023 Morningstar, Inc. All rights reserved. Neither Morningstar, its affiliates, nor the content providers guarantee the data or content contained herein to be accurate, complete or timely nor will they have any liability for its use or distribution. This report has been prepared for clients of Morningstar Australasia Pty Ltd |ABN: 95 090 655 544, ASFL: 240892) and/or New Zealand wholesale clients of Morningstar Research Ltd, subsidiaries of Morningstar, Inc. Any general advice has been provided without reference to your financial objectives, situation or needs. For more information refer to our Financial Services Guide at www.morningstar.com.au/s/fsg.pdf. You should consider the advice in light of these matters and if applicable, the relevant Product Disclosure Statement before making any decision to invest. Our publications, ratings and products should be viewed as an additional investment resource, not as your sole source of information. Morningstar’s full research reports are the source of any Morningstar Ratings and are available from Morningstar or your adviser. Past performance does not necessarily indicate a financial product’s future performance. To obtain advice tailored to your situation, contact a financial adviser. Some material is copyright and published under license from ASX Operations Pty Ltd CAN 004 523 782. Source Morningstar
We can also see that domestic small caps were the best performing asset class four years in a row (from financial year 2004 to financial year 2007, inclusive) prior to the GFC but they haven’t won an annual race for five years now. Described roughly, domestic small caps seem to swing from best to worst and back again. Given they were the worst-performing class in 2022 and middling in 2023, today there may be merit in them tactically.
But this post is not about predicting the future; the table cannot help us divine it.
Illuminating is the picture of average, best and worst returns, derived from the matrix and from which we can calculate a Sharpe ratio.
Figure 2. Overview
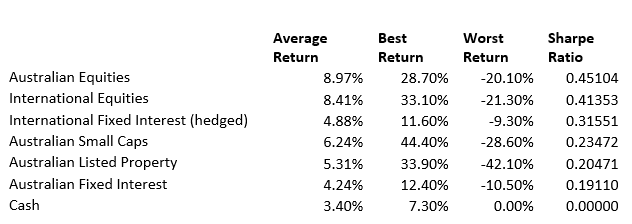
Sorted by the Sharpe ratio – a measure of risk-adjusted returns – the best bang for buck has been domestic large caps followed by international equities over the sampled time frame.
However, using the gameboard in isolation would be a mistake because there are a few things it doesn’t reveal. It doesn’t, show the correlations between the asset classes. For example, when U.S. inflation is above four per cent, bonds and equities are highly correlated. Therefore, bonds don’t offer the traditional protection that many investors seek when including fixed interest in their portfolios.
Without additional information, the matrix cannot help us construct a portfolio. Of course, it doesn’t purport to either.
Importantly the table only includes seven major asset classes, which means it’s not providing a complete picture of asset class returns. The table doesn’t supply the history of returns from alternative asset classes such as real property, commodities, private equity, venture capital, infrastructure, hedge funds, long-short funds or private debt/credit.
The growth of Private Debt or Private Credit globally has generated enormous interest, with the asset class no longer the exclusive preserve of European and U.S. ultra-high net worth investors and their family offices.
Thanks to tighter bank regulation following the GFC, rising labour costs and growing demand, private credit is fast supplanting bank lending to smaller corporates in Australia and overseas.
At Montgomery, we offer investors access to the Aura High Yield SME Fund (for wholesale investors), and the Aura Core Income Fund. Using the six years of data, since the Fund’s inception, I am curious to see how the Aura High Yield SME Fund would sit among the other asset classes. It’s an unfair and cheeky comparison because I compare an individual fund to asset class returns. However, I am still interested in how it did if I suspend belief and assume it represented a new asset class in the mix.
Figure 3. Aura High Yield SME Fund among the Asset Classes, since inception*
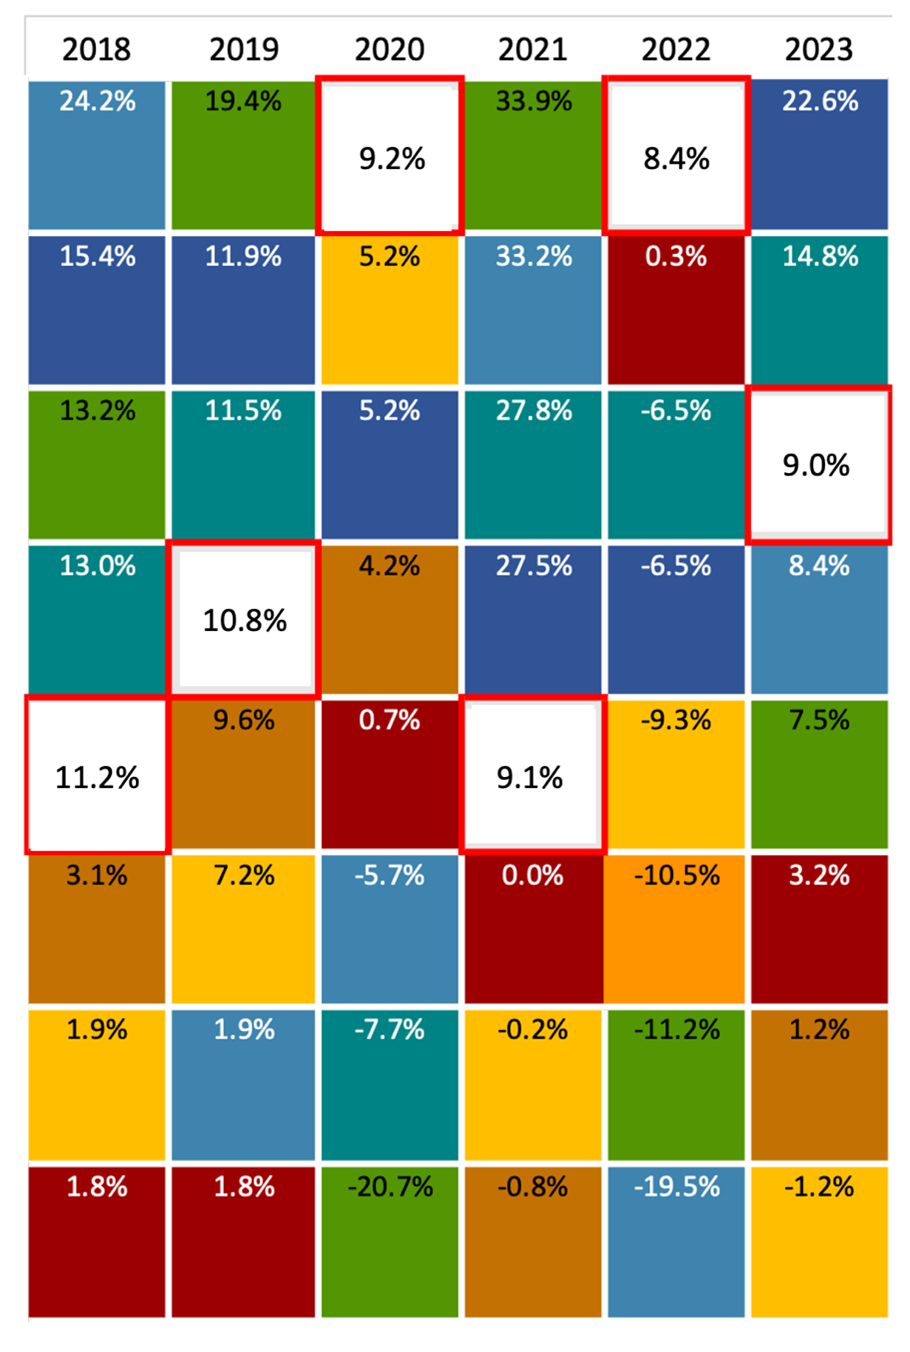
*The Aura High Yield SME Fund returns above are shown for the 12-month period to the end of each financial year. For financial year 2018, the returns are for the 11 months to June 2018 annualised.
The Aura High Yield SME Fund’s historical track record (remember, historical performance is not a reliable guide to future returns) is impressive, albeit relatively short. Over its six years to 30 June 2023, which includes the period the COVID-19 pandemic hobbled the global economy, the Aura High Yield SME Fund, represented by the white squares with a red border, was the best performing ‘asset’ twice, and it experienced no negative years (indeed, since inception, and over 72 months, there have been no negative months either).
Finally, it’s worth observing that the Aura High Yield SME Fund produced its best rankings, and, therefore, arguably its best ‘service’ in terms of protecting portfolio returns when other asset classes all did relatively poorly, such as in 2020, when Covid first hit, and then in 2022, when fears of recession had everyone running for the hills and selling the other asset classes.
We believe the Aura High Yield SME Fund and the Aura Core Income Fund are compelling Funds that advisers should seriously consider for a role in investor portfolios.
For individual investors, it’s worth noting there are risks with every investment you must understand. With that in mind, may I suggest you send a link to this blog post to your adviser and ask them whether diversification of part of your portfolio into a Private Credit Fund makes sense for you.
Disclaimer
Find out more about the Aura Private Credit Funds
You should read the relevant Product Disclosure Statement (PDS) or Information Memorandum (IM) before deciding to acquire any investment products.
Past performance is not an indicator of future performance. Returns are not guaranteed and so the value of an investment may rise or fall.
* Net returns for the Aura High Yield SME Fund (for wholesale investors only) as at 31 May 2023. Performance assumes reinvestment of distributions since inception in August 2017. Past performance is not a reliable indicator of future performance.
This information is provided by Montgomery Investment Management Pty Ltd (ACN 139 161 701 | AFSL 354564) (Montgomery) as authorised distributor of the Aura Core Income Fund (ARSN 658 462 652) (Fund). As authorised distributor, Montgomery is entitled to earn distribution fees paid by the investment manager and, subject to certain conditions being met, may be issued equity in the investment manager or entities associated with the investment manager.
The Aura Core Income Fund (ARSN 658 462 652)(Fund) is issued by One Managed Investment Funds Limited (ACN 117 400 987 | AFSL 297042) (OMIFL) as responsible entity for the Fund. Aura Credit Holdings Pty Ltd (ACN 656 261 200) (ACH) is the investment manager of the Fund and operates as a Corporate Authorised Representative (CAR 1297296) of Aura Capital Pty Ltd (ACN 143 700 887 | AFSL 366230).
You should obtain and carefully consider the Product Disclosure Statement (PDS) and Target Market Determination (TMD) for the Aura Core Income Fund before making any decision about whether to acquire or continue to hold an interest in the Fund. Applications for units in the Fund can only be made through the online application form. The PDS, TMD, continuous disclosure notices and relevant application form may be obtained from www.oneinvestment.com.au/auracoreincomefund or from Montgomery.
The Aura High Yield SME Fund is an unregistered managed investment scheme for wholesale clients only and is issued under an Information Memorandum by Aura Funds Management Pty Ltd (ABN 96 607 158 814, Authorised Representative No. 1233893 of Aura Capital Pty Ltd AFSL No. 366 230, ABN 48 143 700 887).
Any financial product advice given is of a general nature only. The information has been provided without taking into account the investment objectives, financial situation or needs of any particular investor. Therefore, before acting on the information contained in this report you should seek professional advice and consider whether the information is appropriate in light of your objectives, financial situation and needs.
Montgomery, ACH and OMIFL do not guarantee the performance of the Fund, the repayment of any capital or any rate of return. Investing in any financial product is subject to investment risk including possible loss. Past performance is not a reliable indicator of future performance. Information in this report may be based on information provided by third parties that may not have been verified.
Roger Montgomery is the Founder and Chairman of Montgomery Investment Management. Roger has over three decades of experience in funds management and related activities, including equities analysis, equity and derivatives strategy, trading and stockbroking. Prior to establishing Montgomery, Roger held positions at Ord Minnett Jardine Fleming, BT (Australia) Limited and Merrill Lynch.
He is also author of best-selling investment guide-book for the stock market, Value.able – how to value the best stocks and buy them for less than they are worth.
Roger appears regularly on television and radio, and in the press, including ABC radio and TV, The Australian and Ausbiz. View upcoming media appearances.
This post was contributed by a representative of Montgomery Investment Management Pty Limited (AFSL No. 354564). The principal purpose of this post is to provide factual information and not provide financial product advice. Additionally, the information provided is not intended to provide any recommendation or opinion about any financial product. Any commentary and statements of opinion however may contain general advice only that is prepared without taking into account your personal objectives, financial circumstances or needs. Because of this, before acting on any of the information provided, you should always consider its appropriateness in light of your personal objectives, financial circumstances and needs and should consider seeking independent advice from a financial advisor if necessary before making any decisions. This post specifically excludes personal advice.