
Midterms, war and U.S. debt
With the prospect of a full-scale war in the Middle East increasing, with bond yields heating up, and with famed short seller Michael Burry increasing his short position against the U.S. SOXX Semiconductor Index, could this month be the month that investors will look back on with regret, wishing they’d diversified?
It’s a midterm election year in the U.S.
Let’s begin with the U.S. Midterm elections in mind. Did you know the midterm year is historically the worst year of the four-year presidential cycle for stocks? Some analysts suggest it’s because of something called the “midterm discount.”
We’re told markets despise uncertainty. If that’s true, the midterm years offer a maximum dose. Over the last 23 midterms, the sitting president’s party has lost an average of 27 House seats and three Senate seats. That means a large amount of legislation being rewritten for tax and trade policy, as well as industry regulation. The higher volatility could also be thanks to the negative messaging of U.S. election campaigns as well as politicians pointing to the problems facing the country. Then, regulatory priorities shift, and committees are overthrown, gutted, upgraded or reshuffled.
The result is heightened volatility.
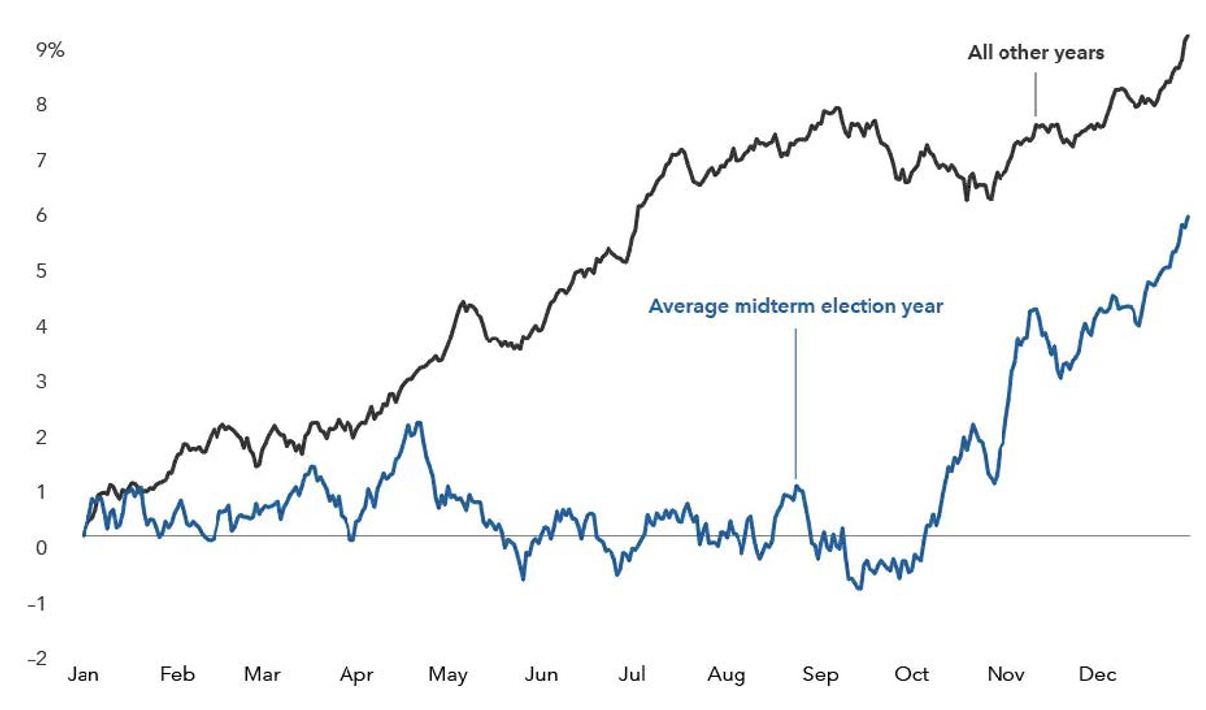
Figure 1., shows the average trajectory of U.S. equity returns throughout midterm election years since 1931, compared to non-midterm election years. Each point on the lines represents the average year-to-date (YTD) return as of that month and day, calculated from daily price returns.
Figure 1. S&P 500 average index returns since 1931.
Source: HBKS, Capital Group, RIMES, Standard & Poor’s.
A couple of observations are useful at this juncture. The first, of course, is that the market tends to rise strongly in the fourth quarter of the year. It seems clear the election results mark the end of the election-related ‘uncertainty’.
The second observation is that to arrive at the average election year market return profile in Figure 1., there will have been positive and negative years. The average of those is a positive year meaning the winning years tended to be bigger than the years that ended in a loss. But the average of all those years also produces a negative period between late April and October.
Indeed, other studies reveal this period to be negative for the S&P500 irrespective of whether the full year ended positively or negatively.
Finally, with the midterm elections held in November, we discover, going back to 1926, the S&P 500 has seen an average drawdown of 18.2 per cent in the 12 months before midterm elections. Going back to 1965, the smallest drawdown has been 7.4 per cent, while the largest was 41.8 per cent.
Four war scenarios
As I write, the U.S. is deploying 15,000 service members and over 100 aircraft to escort stranded commercial vessels through the Strait of Hormuz under Project Freedom.
You might not know this but the first two U.S.-flagged merchant tankers were successfully escorted earlier this week. But…and it’s a big one… Iran struck the UAE’s Fujairah energy hub and a UAE oil tanker, and hit residential areas in Oman.
Meanwhile, the U.S. reportedly destroyed six small Iranian boats and intercepted multiple missiles and drones.
With the two sides diplomatically deadlocked, there are perhaps four scenarios that could play out next:
- A prolonged stalemate, with the Strait remaining closed, while the U.S. blockades Iran’s ports. Oil prices would rise and inflation would persist.
- A negotiated deal, which is unlikely given Iran wants to retain its nuclear program. Oil prices would plunge, and inflation would ease, eventually.
- The U.S. opens the Strait militarily, and continues to blockade Iran. Sounds good on paper, but would lead to (4),
- Recommencement of a full-scale war with more damage to energy infrastructure around the Persian Gulf and further rises in the price of oil.
Given these scenarios and their probabilities, it is perhaps unsurprising the launch of Project Freedom is already causing the price of oil to rise.
Bond yields rising, inflation and U.S. debt
Since the war commenced, and helped along by the rising price of oil, U.S. Treasury yields and mortgage rates have been rising (see Figure 1.)
Figure 2. U.S. Treasury 2-year & 10-year yields & 30-year mortgage rate
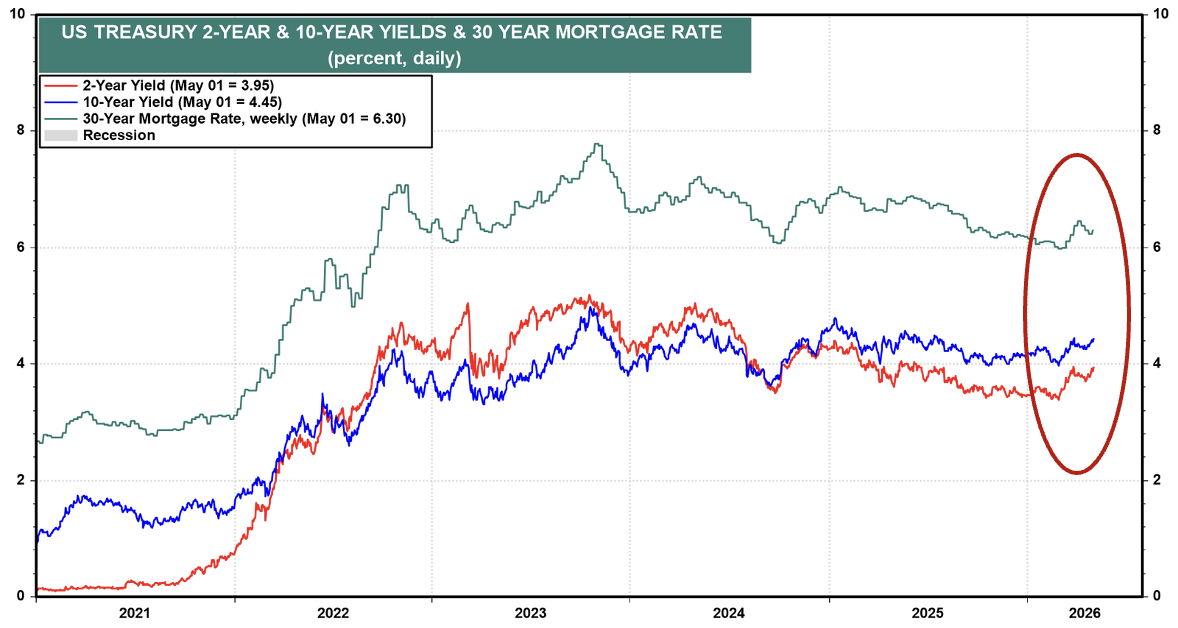
Source: LSEG Datastream and Yardeni Research, Federal Reserve and Freddie Mac
With expected inflation – as measured by the spread between 10 years bond yields and the 10 year Treasury Inflation-Protected Securities (TIPS) yield – closely correlated with the price of oil, it is perhaps unsurprising that the 10 year Treasury bond rate has been pushed higher.
With the U.S. national debt at more than US$36 trillion (this is understated because it doesn’t include Social Security reserves, which are held in instruments that do not trade on open markets and never appear in the standard national debt calculation, but still represent future repayment obligations), and representing a 39-fold increase since 1981, rising Treasury yields today carry systemic implications.
With 10-year Treasury yields at 4.434 per cent, and 2-year yields at 3.948 per cent, the resulting spread of approximately 0.49 basis points reflects a yield curve that has normalised from its deep inversion of 2022–2023. But this time, the elevation at the long end is not driven by growth expectations but by term premium – the additional yield investors require as compensation for the risk of holding long-duration U.S. debt in an environment of expanding supply and an unpalatable fiscal trajectory.
The U.S. needs more debt to fund Trump’s Big Beautiful Bill Act and to fund a fast-rising military budget. And with China pulling back from increasing its U.S. Treasury portfolio the U.S needs to attract new buyers. To do that, it needs to offer higher rates, which it can ill afford as its debt rises to even higher all-time records.
Consequently, the question for investors is not whether Treasury yields are elevated relative to the recent past. They clearly are. The more important question serious investors are asking, is whether August 2020 – when bond yields hit historic lows –marked the beginning of a bear market for bonds not unlike the bear market that ran from 1958 to 1981. And within that episode, there were periods like that between 1965 and 1978, during which enormous volatility caused the S&P500 to produce no net gain.
And adjusted for inflation (Figure 2), the S&P 500 produced a negative real return from 1958 to the end of 1981.
Figure 3. S&P 500 real return 1958-1981
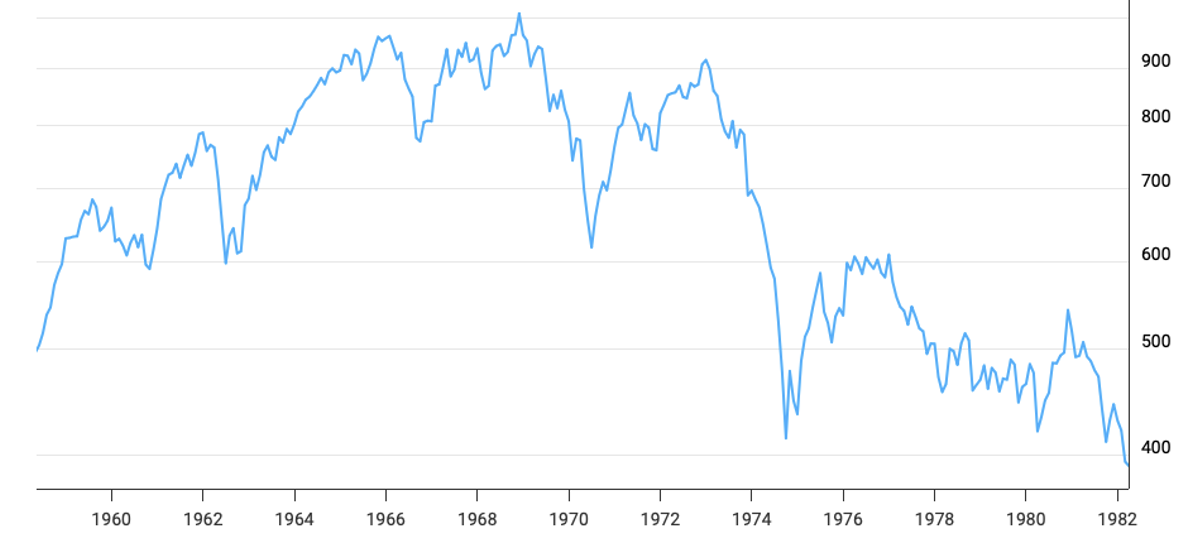
Source: Macrotrends.net
Conclusion
We began this discussion by looking at Midterm election years and the returns between April and October. We ended by looking at the S&P500’s real returns between 1958 and 1981. We linked them by looking at the war in the Middle East and its impact on the oil price, inflation expectations, and bond yields, with a nod to the U.S. debt picture.
If equities can overcome all of that and produce another double-digit return, we will have achieved something not seen for a very long time – four consecutive years of double-digit positive returns.
Roger Montgomery is the Founder and Chairman of Montgomery Investment Management. Roger has over three decades of experience in funds management and related activities, including equities analysis, equity and derivatives strategy, trading and stockbroking. Prior to establishing Montgomery, Roger held positions at Ord Minnett Jardine Fleming, BT (Australia) Limited and Merrill Lynch.
He is also author of best-selling investment guide-book for the stock market, Value.able – how to value the best stocks and buy them for less than they are worth.
Roger appears regularly on television and radio, and in the press, including ABC radio and TV, The Australian and Ausbiz. View upcoming media appearances.
This post was contributed by a representative of Montgomery Investment Management Pty Limited (AFSL No. 354564). The principal purpose of this post is to provide factual information and not provide financial product advice. Additionally, the information provided is not intended to provide any recommendation or opinion about any financial product. Any commentary and statements of opinion however may contain general advice only that is prepared without taking into account your personal objectives, financial circumstances or needs. Because of this, before acting on any of the information provided, you should always consider its appropriateness in light of your personal objectives, financial circumstances and needs and should consider seeking independent advice from a financial advisor if necessary before making any decisions. This post specifically excludes personal advice.