Has a down-leg commenced?
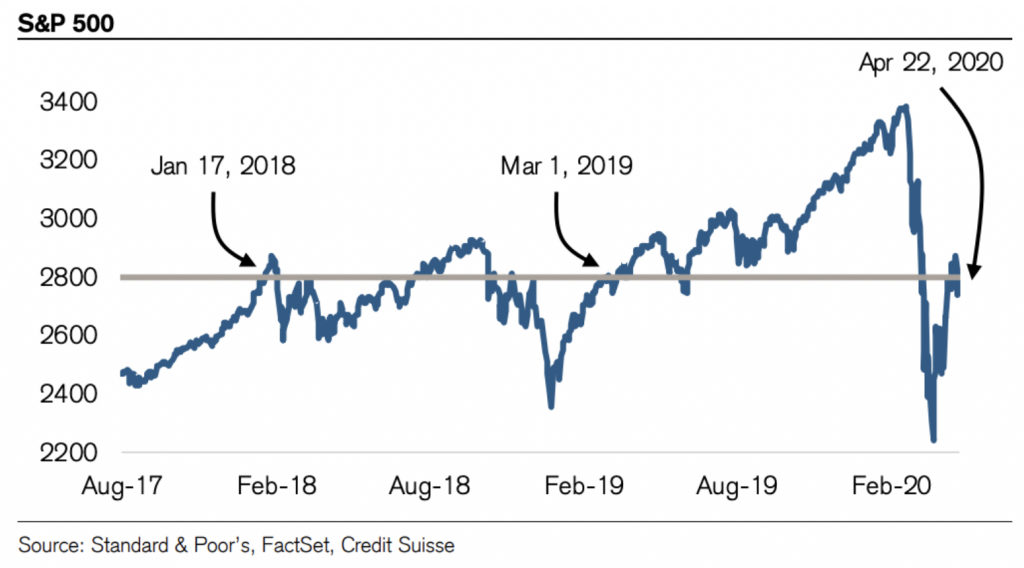
With the S&P 500 and the Australian all Ordinaries Index possibly stalling in the terms of the most recent rally at 2,870 points and 5,550 points respectively, I have received a few telephone calls from investors asking, “has the Wave C down-leg commenced?”
After peaking around 19/20 February 2020, the initial decline into the latter part of March was severe. Since then markets have recorded a very strong rally, as the cases of Coronavirus continues to decelerate; and a staged opening of many economies has commenced or is about to commence.
While I confess, I have never met a wealthy chartist, and don’t ever expect to, Elliott Wave Theory would like us to believe a classic zig-zag charting pattern is unfolding from the market lows established in the latter part of March 2020, known as a counter trend rally. The technique is used as an aid to set price targets, where the ensuing Wave C down-leg would, for example, typically approximate 61.8 per cent of Wave A, being 740 points for the S&P 500 and 1,750 points for the Australian All Ordinaries Index.
| Market Index | US S&P 500 | Australian All Ordinaries Index |
| Peak (February 2020) | 3,394 | 7,290 |
| Trough (March 2020) | 2,192 | 4,460 |
| Loss by points | 1,202 | 2,830 |
| Loss by percentage | 35% | 39% |
| April 2020 Peak (?) | 2,869 | 5,550 |
| Gain from Trough by points | 677 | 1,090 |
| Gain from Trough by percentage | +31% | +24% |
| Recent Gain/Loss | +56% | +38% |
| April Peak/ February Peak | -15% | -24% |
If this theory comes to fruition, and it is a big IF (Roger Montgomery thought Elliott Wave was nonsense and dismissed it after the world’s ‘leading’ Elliott Wave proponent called an ‘all-time’, ‘forever’-high for the Dow Jones in…wait for it….1994!), then the S&P 500 could re-test the March lows; whilst the Australian All Ordinaries Index, which has demonstrated a relatively weaker market performance, could test sub 4,000 points.
Pulling numbers out of the air has its limitations, so let us at least try and analyse where things currently stand. We will use the S&P 500 as it seems to lead many of the world share markets. At the current 2,800 points, the S&P 500 is at the same level as 17 January 2018 and 1 March 2019, and the table below illustrates some interesting comparisons:
| S&P 500 at 2,800 | 17 January 2018 | 1 March 2019 | Now |
| Two year forward EPS | $167 | $190 | $177 |
| Two year forward PE | 16.8X | 14.7X | 15.8X |
| Two year forward EPS growth | 25.1% | 18.5% | 2.5% |
| 10 Year Bond Yield | 2.6% | 2.8% | 0.6% |
| High Yield Bonds | 6.1% | 6.9% | 8.6% |
| High Yield Bond Spread | 3.5% | 4.1% | 7.9% |
| VIX Level | 11.9 | 13.6 | 40.1 |
| ISM Manufacturing Index | 59.1 | 54.1 | 36.4 (1). |
| Unemployment | 4.1% | 3.8% | 12.8% (1). |
(1). Bloomberg estimates
Current observations include:
- While US Government Bond yield at 0.6 per cent is lower, credit spreads at 7.9 per cent are higher
- Volatility, as measured by the VIX at 40.1, is 3-4X higher than the 11.9 or 13.6
- The two-year forward EPS (of $177) and PE forecast (of 15.8X) assume a sharp V-shaped recovery, from the economic battering experienced – particularly in the June 2020 Quarter, in earnings.
In summary, it seems to me chartists are more pessimistic than consensus analysts and economists, probably believing there will be a second wave of Coronavirus infections thus stalling any recovery in economic and earnings growth. While forecasts are changing rapidly, and I should add I am not a supporter of charting, I have some sympathy with their more cautious view.

People are slowly waking up to central banks and their total distruction of markets and price discovery, most asset markets have been rendered univestable by central banks in my view, and totally disconnected from reality, i find it laughable that people still say gold has no intrinsic value, yet put their faith in fiat currencies that are being eviscerated daily, and all while central banks around the world have had a historic buying spree on gold in the last couple of years, maybe they know something most don’t .
I have a large allocation to gold and will continue buying on weakness, when markets become sane again I will change my allocation back to stocks that can be valued against reality and not helicopter money insanity.
This insanity fueled by central bank arrogance/stupidity can only result in absolute disaster as historically proven over and over again, when this is over the entire monetary system will be discarded if this madness doesn’t result in ww3, in which case it won’t matter.
Thank you Andrew. Markets seem comfortable disregarding the deterioration of the Government Sector balance sheet.
In light of this sympathy, it would be good for MFM to revisit its stance on gold. It might not fundamentally hold weight (excuse the pun) or any real intrinsic value once dug up but as a hedge against the very real recent collapse in markets and uncertainty that chartists Elliot wave indicates will ensue, the time to take a calculated punt and ride the gold “wave” higher might be now……interestingly your small companies fund has a decent 5% stake in it, maybe those maverick lads are slowly changing the cultural stance at Montgomery??
Thanks Richard. Gold is performing well, and in A$ terms is performing brilliantly. The margins for Australian producers are at record levels. I wrote a number of blogs on Evolution Mining, for example, much earlier in their development when they were closer to $1 than $5. Yes, the Montgomery Small Companies Fund has around 5 per cent weighted to Gold Companies, and they are performing very well on a relative basis, and yes we are cross fertilising our analysis and ideas on a daily basis. I believe this will be reflected in the portfolio over time.
USA Unemployment at 17%, Manufacturing and services index in recession territory , new cases of corona continues at around 30,000 cases per day …. and start up likely to see this increasing
Mmmmm go figure….. and yet the money still is pouring into the market ….
Thanks Mike, another 41 points appreciation (like last night) and the S&P 500 reaches 2,928 points, an area the Elliot Wave junkies would target (being a 61.8% retracement of the 1,202 point decline). There are 140 Companies from the S&P 500 reporting their results for the March 2020 Quarterly over the week. Excluding the big tech, Alphabet, Amazon, Facebook, Microsoft, as well as Tesla – which are on a tear – the remainder should give some insights into their near term outlook. It will be a strange period as we experience staggered re-openings and massive government stimulus measures. At nearly 20X Earnings Per Share (EPS) two years out, some caution is justified!