
For the love of real estate
Australia has a love affair with property the likes of which the rest of the world may not fully appreciate. The 18th top-ranked site in Australia is realestate.com.au, pipped only by sites operated by global powerhouses such as Google, Twitter, Ebay and Facebook.
Realestate.com.au’s website ranks higher than those owned and operated by News Limited, SMH, the Bureau of Meteorology, the ABC and Netflix, so it seems we care more about real estate than we do about the news and the weather.
This amorous connection with real estate is reflected in REA Group’s revenues and profits. The company’s operating earnings have grown by more than 37 per cent per annum for the last decade. Over the last five years, shareholders have directly contributed an additional $34 million of equity, which has generated $180 million of additional profit to the forecast year ending 2016. The company has no debt and returns on its equity have hovered near 40 per cent since 2009 – try getting that in a term deposit.
But this blog post is not about the past it is about the future and there are two forces that are likely to cause value investors to salivate.
The first is that as the property market matures the economics of the business improves, and the second is that as the property market matures, the share price deteriorates – a mouth-watering combination.
We have previously noted that the company’s share prices will be driven by sentiment towards property. As the Brisbane, Sydney and Melbourne property booms cool amid an oversupply of apartments (watch out if you’re buying off-the -plan today!), REA’s share price will come under pressure. Indeed, to some extent, that is already happening. REA’s share price achieved a closing high of $55.09 on 31 December 2015 but since then the share price has been declining and now sits just above $49.00.
As I discussed in our recent Whitepaper investors should buy shares like they buy groceries and REA’s share price decline has seen it become even more attractive to us. With its ranking, in the initial stock screening and ranking step of our investment process, jumping from No.#73 to No.#4 in the last week, it’s worth considering the company’s merits.
Many market participants will sell shares in REA and some might even short the stock amid the expectation that its earnings will come under pressure in a property market that matures or declines.
Our understanding however is almost the reverse. You see, in a booming property market many properties rarely see their way to an actual listing – they are sold in Dutch auctions, before being advertised, to a list of ready buyers who have previously registered with the agent. Anecdotes of such activity abound across Sydney and Melbourne including in my own street, which has seen a steady stream of removalists delivering new residents to houses where ‘For Sale’ signs were never displayed.
When demand for property cools however the competition to sell one’s house becomes more intense and properties need to be advertised, and are often listed, for longer periods before being sold. In fact as Chart 1. illustrates, the average numbers of days a property was listed has been trending down for some years.
Chart 1. Average time on market combined capitals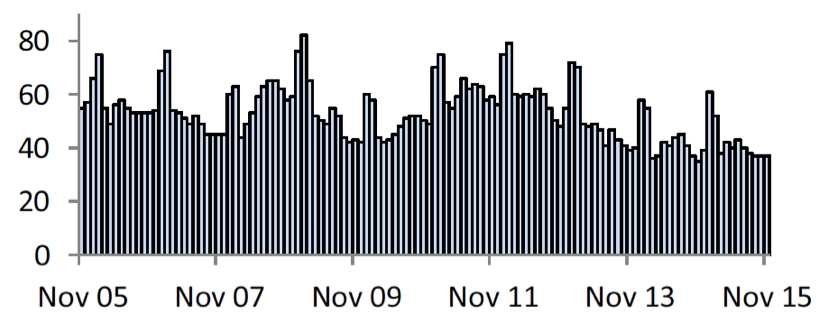 Source: CorelogicRPdata
According to RP data in a blog post published on 4 February this year;
“…the number of residential properties available for sale is starting to climb again, and this year at a much faster rate than last year.
“In fact, the number of new listings being added to the market is currently higher in all capital cities with the exclusion of Sydney, where new listings over the four week period ending 31 January 2016 were -5.1% lower than at the same time last year. To put this into perspective, that represents 272 less residential properties being added to the stock pool this year compared to last. On the other hand, the total number of homes available for sale currently (18,442) is 15.3% higher than one year ago, when 15,994 Sydney homes were listed for sale, essentially meaning the buyers have around 2,500 more properties to choose from.”
So the numbers of homes available for listing (supply) is going up and the rate of price change (demand) is declining. See Chart 2. Below.
Chart 2. The annual rate of capital gain has been trending lower since July 2015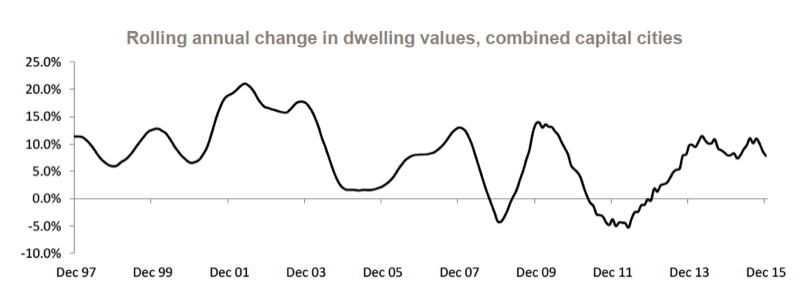 Source: Corelogic
You might recall we warned property investors about this last year (listen to the 2GB radio interview here) when we discussed the implications of the recommendations proposed by David Murray in his Financial System Inquiry Report, for house prices.
Whether house prices go up or down doesn’t really matter for REA’s profits in the short or medium term. What does matter is that there are more properties being listed and the consequence is more competition for vendors, which translates to longer periods properties remain for sale.
More properties means more competition and that means agents and vendors need to make their property stand out from the crowd. One way to do this is to pay up for a more prominent ad on REA’s site realestate.com.au. And it seems that is exactly what is happening.
According to our very good friend Ivor Ries – a prominent and respected analyst at Morgans Financial Limited – ‘depth ads’ are staging a strong seasonal rebound (see Chart 3.).
Chart 3. REA Group Weekly Depth Ad Volumes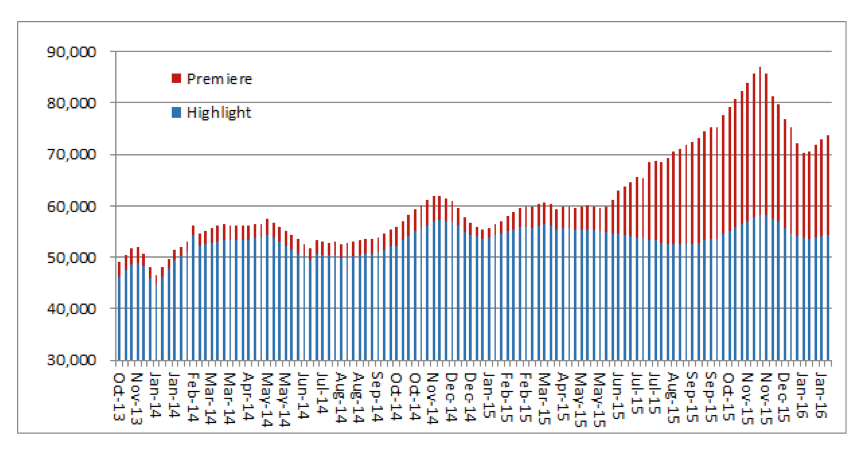 We quote from Ivor’s email of 8 February 2016:
“Paid depth listings on realestate.com.au for the first six weeks were up 27% on the same period last year, a notable outcome as the first five weeks of 2015 set new records for volume growth.
“In the week ended 5 February Highlight listings were 54,300, down slightly on the same time last year. More expensive Premiere listings were 19,491, 6.6 times the same week last year. Aggregate depth listings volumes of 73,791 were 27% higher than the same week a year ago.
“In mid 2015 REA introduced a new “All Premiere” subscription deal that caused a shift in the mix of depth ads to Premiere. Discounting may have driven demand for “All Premiere” listings and thus revenue growth will be lower than volume growth suggests.
“For the FY16 financial year to date average weekly depth listings were 33% higher than the same period last year. This number corresponds with the 33% increase in paid depth listings revenues recently reported by REA in the first half.
“Actual paid volume growth from depth listings may be higher or lower than our volume counts suggest as our sampling method does not count the duration (time on site) of ads. In a strengthening market where average days to sell are falling, our method would under-estimate actual volume growth of ads being sold. In a weakening market, where average days to sell properties is getting longer, our method may overstate the volume of ads being sold. Premiere ads have a typical duration of 45 days, longer than the 30 day duration of typical Highlight ads.
“Total national for sale listings remain at low levels. Average weekly for sale listings remain well below long term historic norms.”
Seasonality and the important final point Ivor makes aside, we believe the higher volume of depth listings will become a trend as the maturing property market continues to attract more sellers and higher mortgage rates dissuade buyers for clearing the supply quickly.
One should reasonably expect the listings to remain ‘live’ on REA’s site for longer too.
That competition for vendors is rising, and that homes will take longer to sell (and will therefore be listed with REA for longer), is already being picked up in statistics monitored by Corelogic RP Data and reported in their January 2016 Monthly Housing & Economic Chart Pack. We quote:
“The typical capital city home is currently selling after 37 days on the market compared to 35 days a year ago. The average level of discount is recorded at -5.8% compared to -5.6% a year ago Auction clearance rates are trending lower after reaching 80% earlier in 2015 and were sitting at around 60% at the end of last year.”
For REA group the chart that may matter most may simply be the volume of ‘depth’ ad volumes compared to prior years.
As Chart 4 illustrates, 2016 numbers are well above prior years.
Chart 4. Weekly depth ad comparisons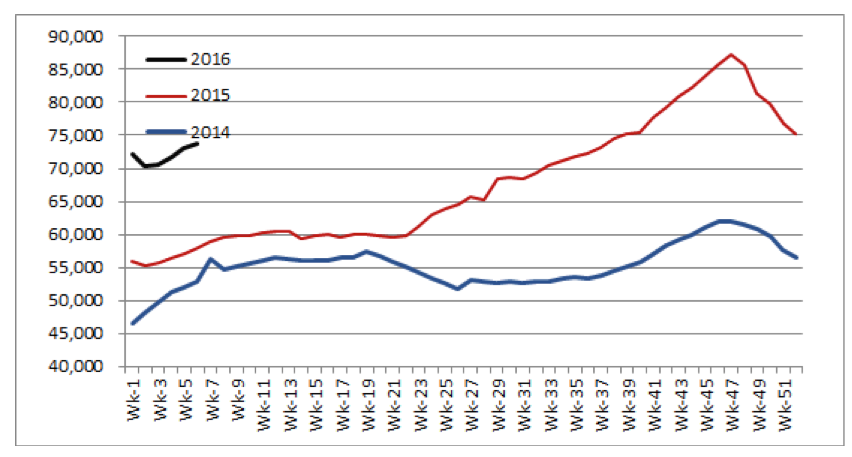 Of course while all of this is important to value investors with a business-like approach to their investing, it matters naught to speculators who will simply look at the maturing property market as the litmus test for revenues across the real estate industry. It comes as no surprise to us that REA’s share price is falling and while that may dissuade speculators, value investors might just be looking at a mouth-watering opportunity.
None of these comments or insights suggest we can predict REA’s share price in the short run – it could continue to decline and perhaps even precipitously. But we, and our investors, care less about short-term share price volatility than others because we know that in the long run the share price will follow the intrinsic value of the business, which in turn will reflect the economic performance of the business.
At the present time we believe the economic future of the business couldn’t be much brighter.
PS; And don’t forget the basic facts; Apartment supply is going up amid near-record approvals, record commencements and record construction. But this is happening at precisely the same time that population growth is slowing. See Chart 5. That means lower property prices.
Chart 5. Population growth continues to slow. Quarterly change in national population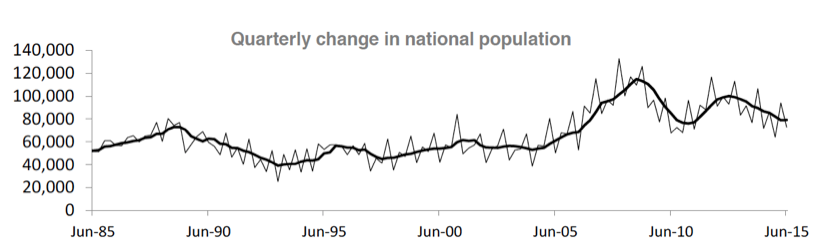 Source: Corelogic RPdata, ABS
Putting our money where our mouth is disclaimer: The Montgomery Fund, The Montgomery [Private] Fund, the Montgomery Global Fund and Montaka funds all hold REA Group shares.
Question(s): Have you just purchased a unit off-the-plan or know someone who has? What do you think will happen to property prices this year? Do you have a property warning of your own to share?
Roger Montgomery is the founder and Chief Investment Officer of Montgomery Investment Management. To invest with Montgomery domestically and globally, find out more.
Roger Montgomery is the Founder and Chairman of Montgomery Investment Management. Roger has over three decades of experience in funds management and related activities, including equities analysis, equity and derivatives strategy, trading and stockbroking. Prior to establishing Montgomery, Roger held positions at Ord Minnett Jardine Fleming, BT (Australia) Limited and Merrill Lynch.
He is also author of best-selling investment guide-book for the stock market, Value.able – how to value the best stocks and buy them for less than they are worth.
Roger appears regularly on television and radio, and in the press, including ABC radio and TV, The Australian and Ausbiz. View upcoming media appearances.
This post was contributed by a representative of Montgomery Investment Management Pty Limited (AFSL No. 354564). The principal purpose of this post is to provide factual information and not provide financial product advice. Additionally, the information provided is not intended to provide any recommendation or opinion about any financial product. Any commentary and statements of opinion however may contain general advice only that is prepared without taking into account your personal objectives, financial circumstances or needs. Because of this, before acting on any of the information provided, you should always consider its appropriateness in light of your personal objectives, financial circumstances and needs and should consider seeking independent advice from a financial advisor if necessary before making any decisions. This post specifically excludes personal advice.
Thanks Ken Day…appreciate you taking time to respond to my question about my IV calculations for REA. I’m still earning and your points are informative and useful.
I have a question about REA’s intrinsic value. I’ve been studying Value.Able and calculating estimated intrinsic value for various organisations using figures from Westpac’s Online Investing website (Company financials 2015/06)
I’ve calculated REA’s estimated intrinsic value at $28.59 using these figures:
Shares outstanding – 131.7m
Shareholders equity – 557.5m
Equity per share – $4.23
ROE – 35.9%
EPS – 152c
DPS 70c
Payout ratio – 46.1%
Retained ratio – 53.9%
Required rate of return – 10%
Income multiplier – 3.5
Growth multiplier – 9.535
However, on this week’s video insight, ‘Pleasing results from REA Group’, Scott commented ‘with the share price (approx $49) trading well below overall intrinsic value…’
Am I imissing something in my calculations as $28.59 is well $49?
Similarly my estimated intrinsic value for Platinum Asset Management is very low.
Hi Roger G, Perhaps one of the Value.able graduates here on the blog could help you out…
Hi Roger G,
I have recently (June 2016) dug out my old hand-built ‘Value.enabled’ spreadsheet to do a first cut valuation screen on my high quality companies. Although my ‘default’ IV calculation for REA is higher than yours, it is much lower than Roger (very generously I might add) published after the REA Group 3Q16 result. So I find myself facing the same question as you pose here.
It seems we are using the same data so that is not an issue. I obtain a valuation which is close enough to yours if I plug in the values you quote. You will see that the ROE which you quote (35.9%) is the 2014/2015 financial year net profit before abnormals ($200.3 million) divided by shareholder’s equity at the end of the 2015 financial year ($557.5 million). Applying equity at the beginning (rather than the end) of the 2014/15 financial year (i.e. $407.8 million) gives a ROE of 49.1%. This is the more appropriate ROE to use in the IV calculation (see VALUE.ABLE p. 188 Step C).
Now (29 June 2016) we are at the end of the current financial year so the relevant question is “what has the ROE been this financial year?” If we believe the $1.67 consensus EPS forecast (the median of only two analyst’s forecasts) and assume that the number of shares outstanding hasn’t changed, the forecast net profit is close to $220 million. This represents a 39.5% return on shareholder’s ‘beginning’ equity (i.e. $557.5 million as at July 1, 2015). As my ‘default’ IV calculation is based on this consensus EPS forecast, I calculate a $42 IV as at 30th June 2016 (applying a 10% required rate of return and a 46% payout ratio). This IV is much lower than the $65 IV Roger shared after the REA Group 3Q16 result.
So, assuming we have straightened out the calculations, why the gap between $42 (my ‘default’ IV) and Rogers’ $65 valuation after the Quarter 3 results? Comparing the implied 39.5% ROE (current consensus forecast} with the previous year ROE (49.1% as above) we see that the consensus analyst forecast implies a 20% decline in ROE. Given that ROE and payout ratios have remained remarkably constant over recent years, the analyst outlook represents a departure from the recent ‘norm’.
I suspect that the team at Montgomery would consider, particularly early in the financial year, a wide range of ROE scenarios in constructing their “valuation spectrum” for a particular company. Using a ROE of 49.1% (i.e. ‘ROE remains constant’) I calculate an IV for REA which is very close to the $65 Roger has recently shared. However my spreadsheet tells me that, assuming a 20% increase in full year revenue growth, further margin expansion (i.e. beyond that already achieved to Q3) will be required to achieve this. Roger makes particular mention of margin expansion in his commentary on Quarter 3 results i.e. “further EBITDA margin expansion in Q4 should be expected because marketing costs will be lower in the fourth quarter”.
Maybe I’m getting the hang of this?
And all without mentioning the long term benefits to REA from (a) US growing market position from a low user base & experience and, (b) China/SE Asia positions.
While Australia’s foreign investment maintain that foreign persons are prevented from buying established dwellings, I do not see the demand for ‘off the plan’ sales of apartments slowing a great deal. Developers are selling 80%+ of stock before even laying a brick (and sometimes without even opening a sales office in Australia). Unless the capital flight from China is restircted by the Chinese government, I think that new apartment sales will remain solid.
The issue will come with a secondary sales market of these off the plan apartments. Who will be there to maintain the prices we are currently seeing when they are re-listed for sale in 5-10 years time?
Hi lachie,
Your argument is known as the “weight of money argument”. It suggests that a wall of money entering an asset class will prevent that asset from declining in price. History and even very recent history shows that a tidal wave of money does not prevent crashes from occuring.
I have been holding off from buying a 4 bedroom home in the eastern suburbs of Sydney as I presume the current correction in the apartment market and stock market will filter through to the housing market.
Will some housing markets be immune to the downtrend.
I can wait up to 18 months.
Is my thinking clear? (no rush)
Regards
Ed
Hi Ed, Some people invest and then worry about a crash. Far better to wait for a crash and then worry about what to invest in.
Thanks Roger, always love your articles!
Thanks for that Phil
Beautiful report Mr. Roger, read it 3 times just so I don’t miss anything golden nuggets. Found quite a few golden nuggets here which were swiftly jotted down in my notebook. These reports are a perfect companion to your book, which I am very fond of by the way.
Thank you, love from an aspiring value investor, you have changed my way of thinking and the outlook I have on businesses dramatically.
Delighted to hear it Ghazi. Stay tuned for more.
Great report, Roger.
Interested in your thoughts on FXJ (specifically Domain) given it’s also exposed to same thematic but at a cheaper price given discount a applied due to “old media” biz?
If the number 1 player is cheap why invest in the second best option?
Great work as always Roger, if only the news was this informative and valuable!
That others are distracted by noise is of great benefit to those following the approach advocated here Mark.
Here’s a few random anecdotal observations-
1. I am covering most of Brisbane each day maintaining traffic signals and the number of cranes within a 5km radius around the city is truly staggering. Many of the the already completed buildings have banners hanging advertising daily, weekly or long-term accommodation, which seems a bit desperate for inner-city apartments. I also heard on The Business last week that Brisbane is already at a 5% vacancy rate (3% is considered a renter’s market) and potential tenants are being offered iPads and $500 grocery vouchers to sign on. It could be really nasty when the other 20 odd cranes I could count around the city, from a high point in West End, finish their work too.
2. A carpenter friend who supervises floor laying said a Chinese investor had bought 50 of the apartments in a complex his company is subbying on in Toowong. I know Chinese investment was already high, however maybe a lower dollar is giving a kick to purchases like this one.
3. A colleague bought a townhouse (8km out) off the plan 18 months ago for $540k and recently boasted that another TH in the complex has just gone for $650k and he can “see” his being worth $800k plus in the next few years, even though the suburb in question wouldn’t have rated a mention 5 years ago.
4.Another colleague lives in an average bay suburb about 30kms out from town and a new TH development has been finished near him asking $560k for an ordinary and quite ugly townhouse with no particular aspect to recommend it in a pretty ordinary area (you would know this is truly crazy if you knew the area).
5.If you dare to suggest at a worksite or bbq (even with good friends) that the housing market may be overvalued and list a few reasons why it could come off a bit, prepare for angry responses. Which might indicate that the market is still very full of emotional buyers who haven’t thought too much about their affordability status under adverse conditions, as long as the prices kept rising.
Hi Guy, Thanks for taking the time to share those observations. You will be a wise man holding cash. We suspect that you will be able to buy units at lower prices within the next 18 to 24 months. Remember your job is to invest wisely – not to convince everyone else that they aren’t.
Not to mention the potential powerhouse in iproperty, REA’s latest purchase! Iproperty is still in its infancy and has only just started to make a profit. It has become the number one site of it’s territories. This number one position attracts the most buyers which in turn attracts the most sellers which then attract even more buyers etc. Sound familiar?
Thanks Paul.
I nominated Rea group back in your blog on 24th November:
http://rogermontgomery.com/what-is-the-highest-quality-business-on-asx/
Was able to do this due to value.able. Was a no brainer. I might apply for a job at Montgomery! Ha. Thanks for the book Roger.
Delighted to hear you are making good use of it Brett.
Surprised News Corp hasn’t tried to mop up the rest of the business. Hopefully their overseas interests pay off to really add zing to a great business.
An excellent piece.
A couple of things to clarify though. Firstly, you suggest that a weakening in property demand should result in vendors (REA customers) listing for longer and spending more to list. This seems logical, but is there any historical evidence is support this through previous cycles, or is it just a though? Second, you suggest that earning are just as likely to hold or grow in response to a weakling in property demand as oppose to deteriorate, but again, is there any historical evidence through previous cycles? It seems logical to me that a softening in demand and therefore pricing, leads to a reduction in listing activity as vendors prefer not to participate in a sinking market. Sure (subject to evidence) it may be that those who do choose to list, list longer and “harder”, but so what if total listing fall? The underlying gap to be addressed is therefore: how does listing volume behave through historical cycles? Not so much how does the listing product mix and length change. That is a much more insightful path to walk down I expect.
Hi Pierre,
Your questions are excellent and the sort of questions we expect from those frequenting the insights blog. Investing is most business like when it is fact-based. With respect to your questions about evidence pertaining to vendors listing for longer in a previous downward cycle AND earnings/revenue reactions…we met with REA last year in their Richmond office and asked precisely the same questions. What we learned was that the scenarios we painted have indeed occurred in the past. The company admitted it was some time ago and the company was substantially smaller then.
You are right to question whether a falling market or even a flat market prompts owners to sell. Given the level of gearing involved, I presume there will be some concern if prices aren’t rising. Don’t expect prices to rise if banks aren’t extending growing volumes of credit. Rising vacancies may also lower rents and a widening gap between mortgage payments and rents could cause landlords to question the merits of their investment. Time will tell but we think the balance of risks is skewed more than slightly to the downside now.
Also Roger with the recent market volatility can i get your thoughts on Ramsay Health care ( RHC) .
A spot light is being held to the relatively high costs hospitals and suppliers charge Australian consumers and their insurers. It will possibly be policy leaks (ostensibly to sound out constituents), rather than changes to the actual economics of businesses in the healthcare space, that may be responsible for share prices changes in the foreseeable future.
Great report Rog ! Very informative and Explains why REA is a quality business to own.
Thanks for the encouraging words Damian.