
Farewell Fiscal 2017, Hello Fiscal 2018
As fiscal 2017 draws to a close, let’s take a look at the year that was.
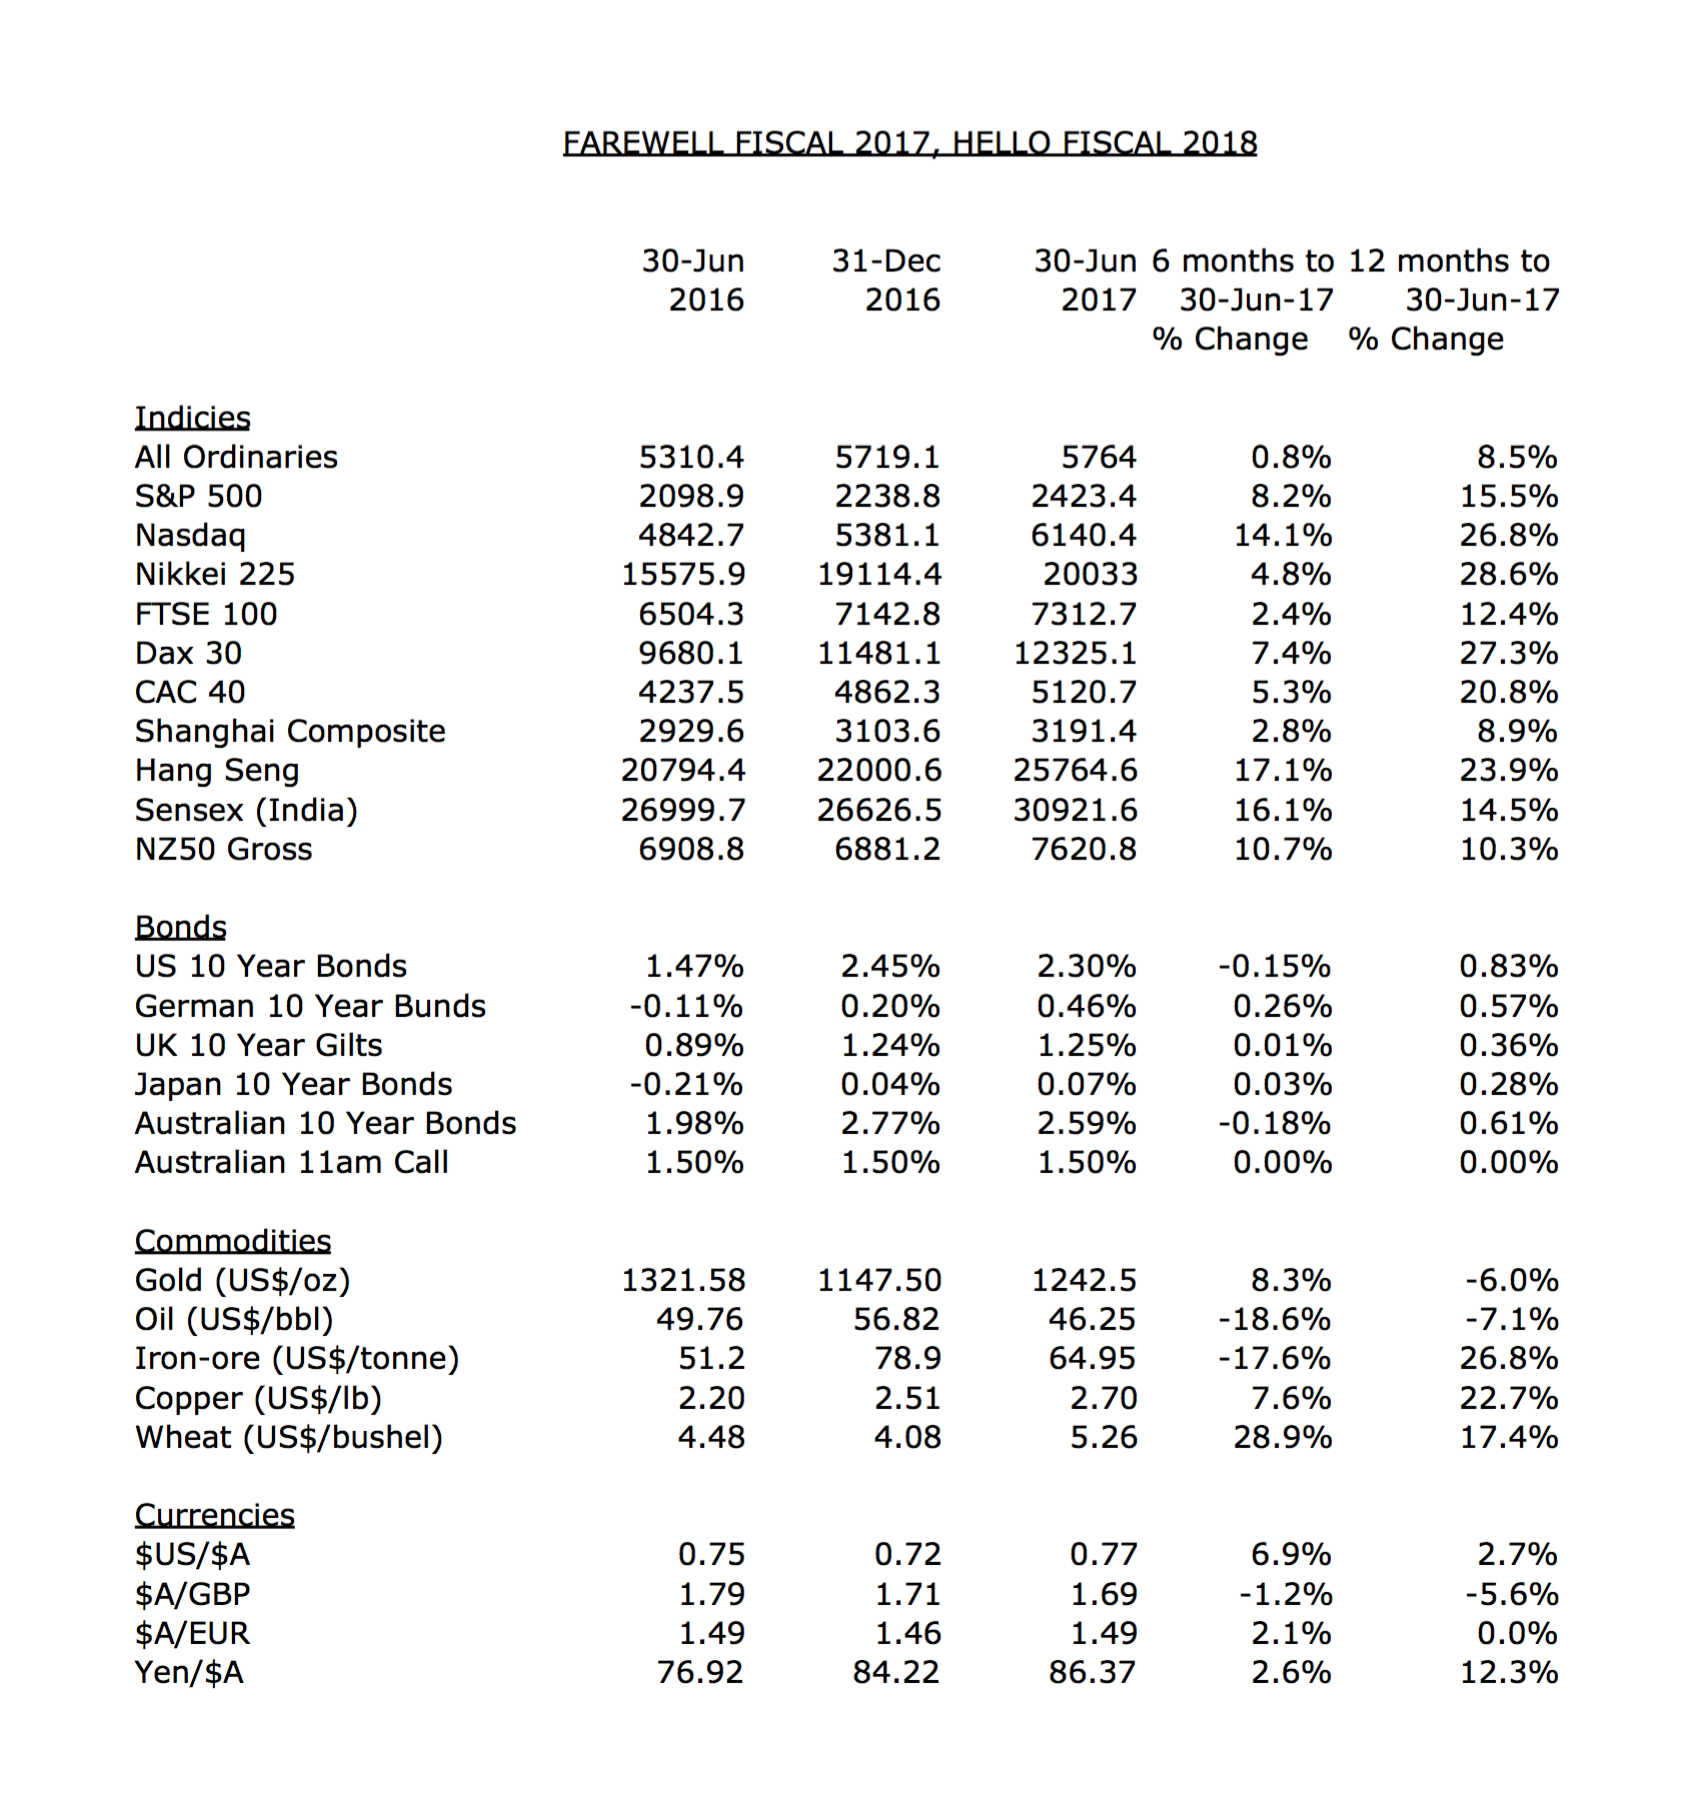
Excluding dividends, the Australian market put on 8.5 per cent in Fiscal 2017 and 0.8 per cent in the six months to 30 June. Most other indices did significantly better, with Japan’s Nikkei 225 up 28.6 per cent for the year and 4.8 per cent for the six months; the German Dax 30 up 27.3 per cent for the year and 7.4 per cent for the six months; while the US Nasdaq was up 26.8 per cent for the year and 14.1 per cent for the six months.
In the past six months to June 2017, the Hong Kong Hang Seng, the Indian Sensex and the New Zealand Gross50 were up 17.1 per cent, 16.1 per cent and 10.7 per cent, respectively.
The US, German, UK, Indian and New Zealand stock markets have all recently recorded their record highs. For context, The Australian All Ordinaries Index peaked in November 2007 at 6,850 points, and while it has twice challenged 6,000 points, in April 2015 and in May 2017, it seems to have trouble going on with it.
The US ten-year bond yield sold off from 1.47 per cent to 2.63 per cent in March 2017 (+1.16 per cent), before closing the financial year at 2.30 per cent (+0.83 per cent). Australian ten-year bonds followed suit, selling off from 1.98 per cent to 2.59 per cent (+0.61 per cent).
The six months to June 2017 saw Oil come back 19 per cent to US$46.25/bbl and Iron-ore retreat 18 per cent to US$65/tonne. Wheat had a late burst, putting on 29 per cent to US$5.26/bushel, while Gold and Copper rose 8 per cent to US$1242.50/oz and US$2.70/lb, respectively.
The Australian Dollar put on 7 per cent against the US Dollar, up from US$0.72 to US$0.77.
Chief Executive Officer of Montgomery Investment Management, David Buckland has over 40 years of industry experience.
David is a deeply knowledgeable and highly experienced financial services executive. Prior to joining Montgomery in 2012, David was CEO and Executive Director of Hunter Hall for 11 years, as well as a Director at JP Morgan in Sydney and London for eight years.
This post was contributed by a representative of Montgomery Investment Management Pty Limited (AFSL No. 354564). The principal purpose of this post is to provide factual information and not provide financial product advice. Additionally, the information provided is not intended to provide any recommendation or opinion about any financial product. Any commentary and statements of opinion however may contain general advice only that is prepared without taking into account your personal objectives, financial circumstances or needs. Because of this, before acting on any of the information provided, you should always consider its appropriateness in light of your personal objectives, financial circumstances and needs and should consider seeking independent advice from a financial advisor if necessary before making any decisions. This post specifically excludes personal advice.
I note in the table that the $US and Yen exchange rates quoted as how many one $A will buy, yet the GBP and EUR are quoted in reverse ie. how many $A are required to buy one GBP or one EUR. As the $A is common, wouldn’t it be better to have them all the same way? Or is there some FOREX convention for how each currency pair must be quoted?
A bit of a mind twister I’m afraid Graeme. I’ll reverse the GBP and Euro exchange rates (for consistency) next time.