
Don’t get too comfortable: Bridgewater says there’s more pain ahead
With U.S. and Australian equities having fallen for almost a year, many investors are starting to wonder if this bear market is coming to an end. After all, the average length of a bear market is 9.5 months, according to Investopedia. So, we’re getting close, right? Apparently not, say the analysts at Bridgewater Associates, the giant hedge fund started by Ray Dalio.
The boom in all asset classes, from bonds, property and equities to private equity, art, wine and collectables, was indisputably the consequence of 37 years of declining interest rates and the Quantitative Easing (QE) that accompanied it in more recent years. With respect to the latter, when central banks are buying all the bonds, safe assets become difficult to acquire and investors are forced out along the risk curve, driving higher-risk assets up.
The question now is whether we have seen the worst or whether the worst is yet to come.
Bridgewater Associates – one of the world’s largest hedge funds – has long been known for its technical dissection of markets. The firm’s founder Ray Dalio has been feted after correctly predicting the 2008 financial crisis. Perhaps his 2008 success can be attributed merely to forecasting frequently because, since then, many bearish forecasts from Bridgewater have failed to materialise. Most recently Dalio has relinquished control of Bridgewater, taking on a role known as ‘CIO Mentor’; however, his bearish predisposition may have left an indelible mark.
As part of the firm’s semi-regular LinkedIn engagement, Bridgewater recently presented a macroeconomic update titled “Progressing Through the Tightening Cycle”.
Figure 1. First the fall then the response
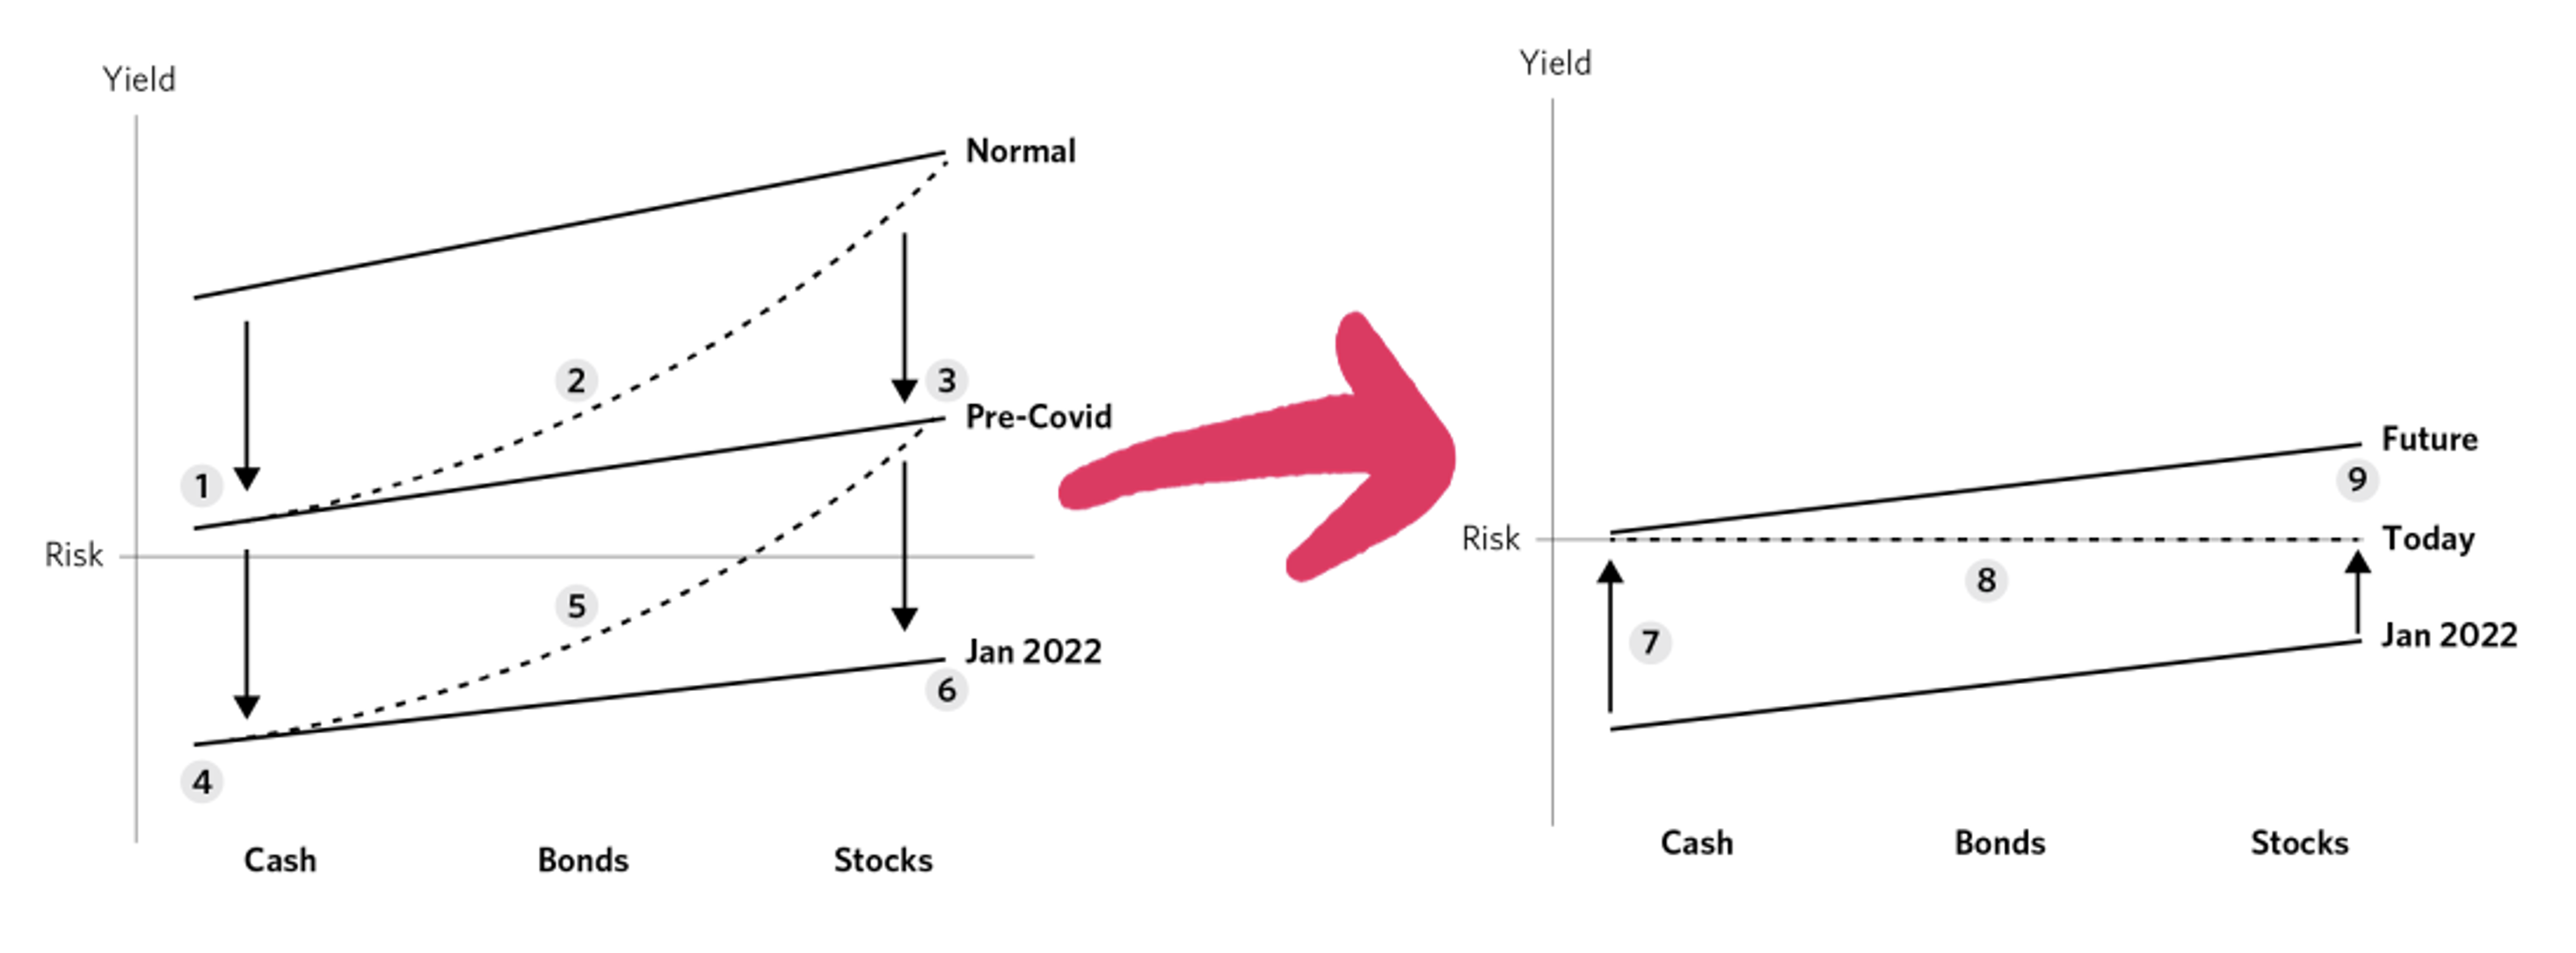
Source: Bridgewater Associates
Figure 1. describes in Bridgewater’s terms the relationship between declining rates and the coincident boom in asset prices right along the risk spectrum from sovereign treasury securities to NFTs. It represents the impact of the final phase of rate cuts and QE. In Bridgewater’s presentation, they note: “The…illustration shows how over the past decade central banks managed a progressive decline in the discount rate in stages (1) and (4), which led to the decline in yields on other assets, steepening the risk curve (2) and (5), which induced money to move from cash to assets (3) and (6), driving their yields down. That was the basis of very high returns on assets over this period.”
Over on the right-hand side is a depiction of what is happening now. It is the reverse of the process described on the left-hand side. Remembering the lower the price one pays, the higher the future return, the left-hand side of Figure 1. shows prospective returns are being pressed higher on all assets, coincident with rising risk-free rates.
But have prices fallen enough? Have future returns risen enough to compensate for the changing environment?
Bridgewater’s presentation suggests, no, returns aren’t high enough yet. Their answer stems from an examination of the hypothetical performance of the stock market, since December 2021, adjusted for the change in discount rates since then.
Figure 2. More declines to come, according to Bridgewater
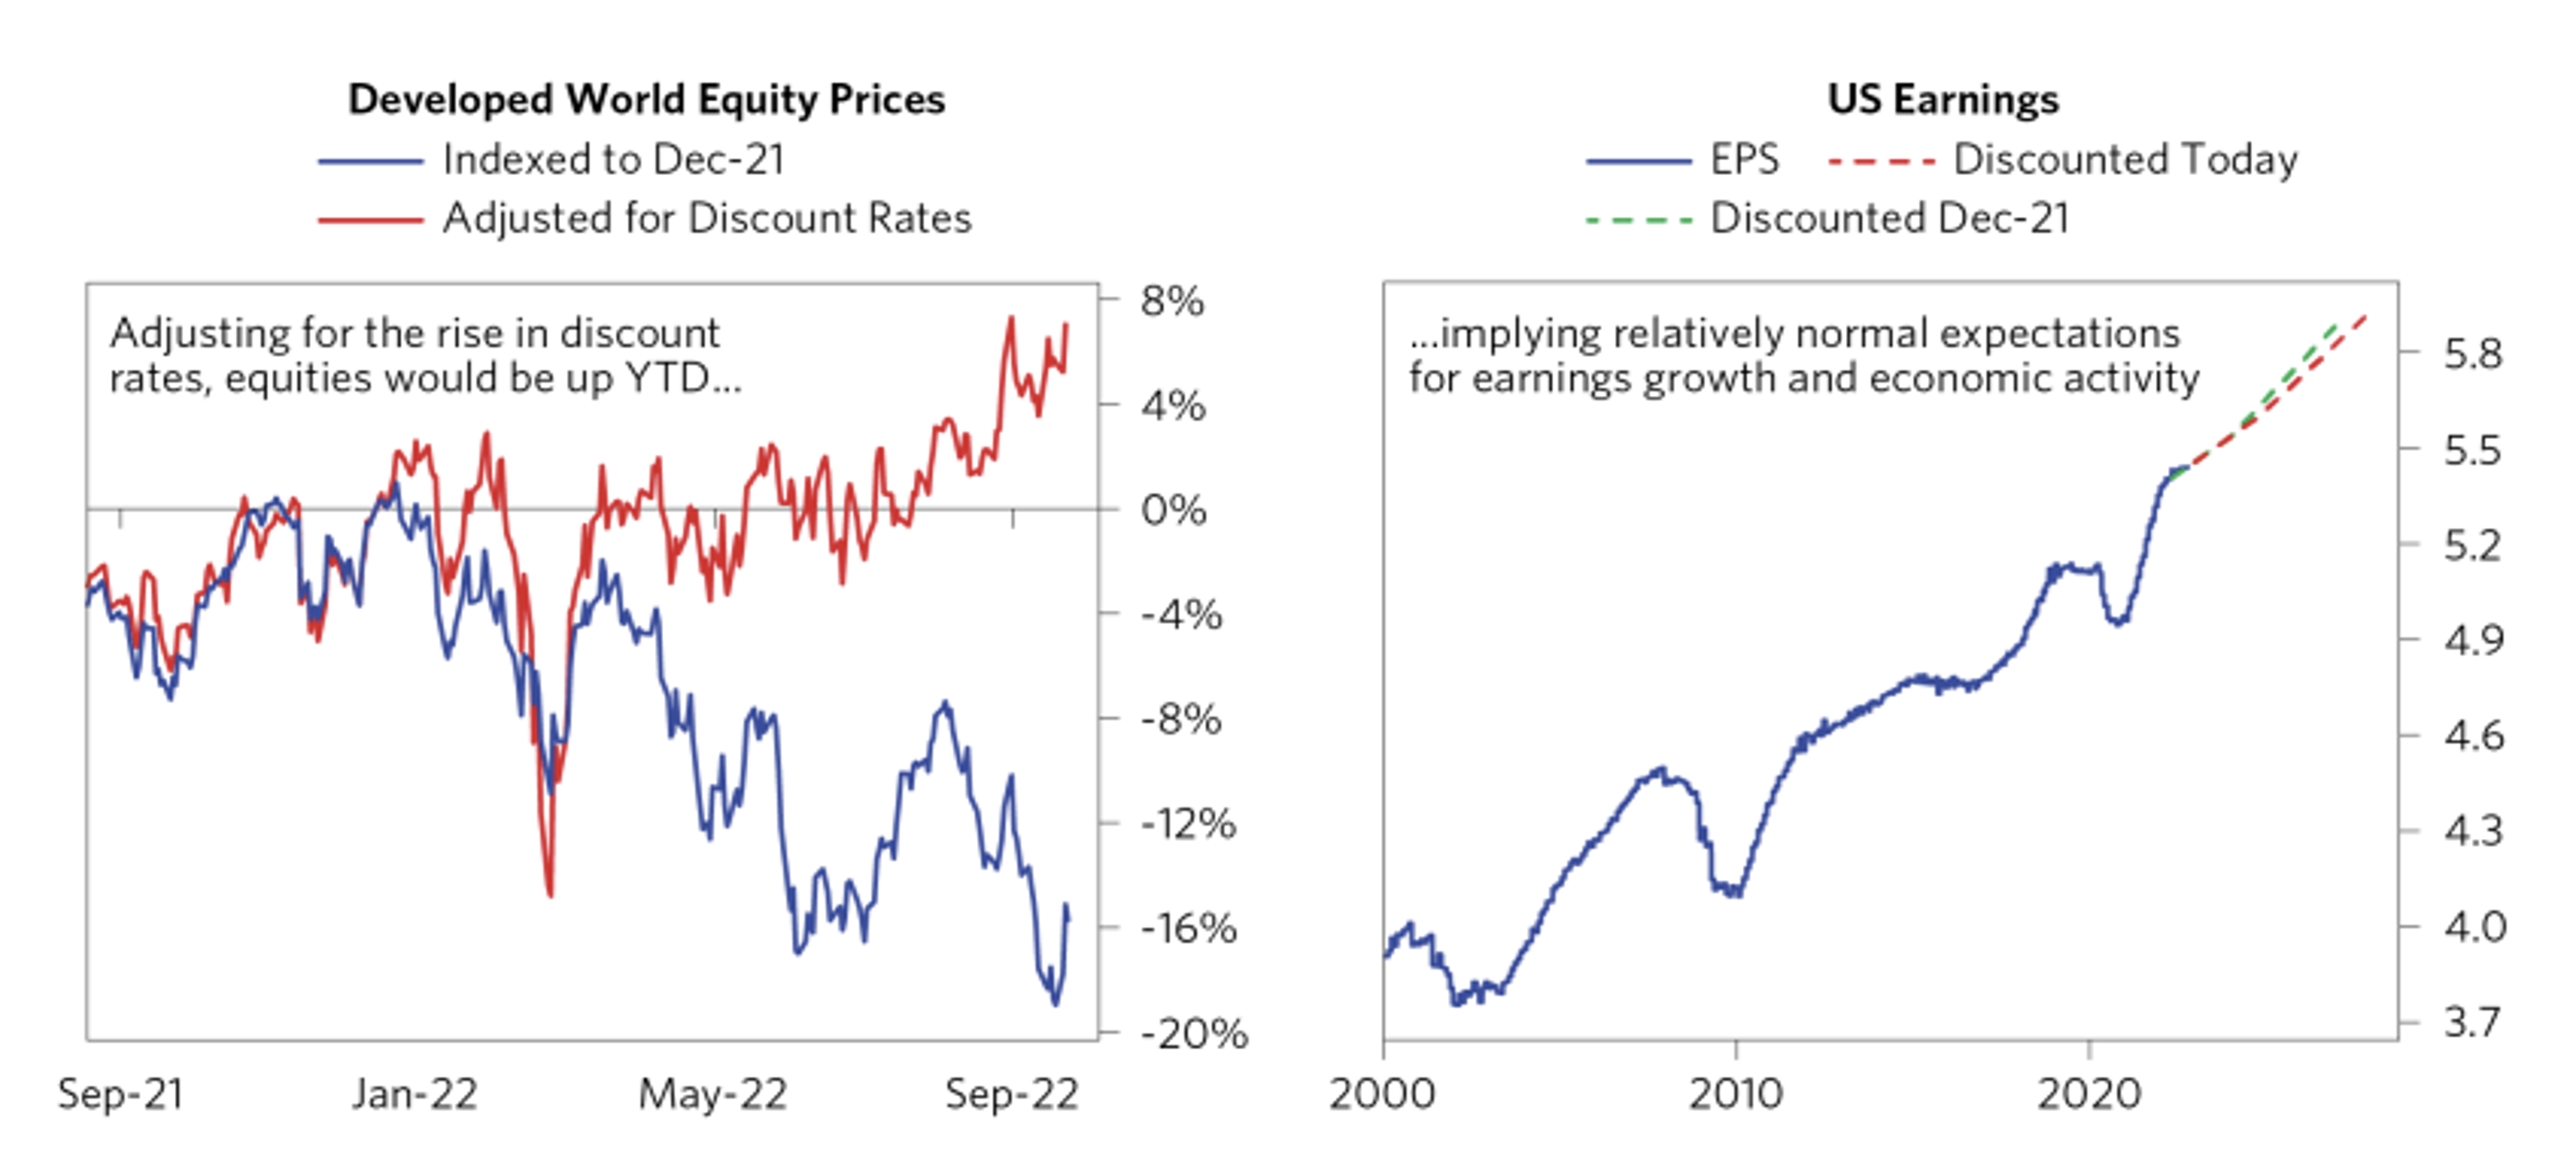
Bridgewater’s presentation discussing Figure 2.: “If you adjust recent equity returns for the portion that is attributable to the rise in discount rates, they are not down. In other words, there has been no discounting of a decline in future earnings. This is corroborated by analysts’ earnings estimates, which have barely changed post-tightening.”
What Bridgewater concludes is that equities have further to fall because, after the impact of rising discount rates are taken into account, developed market equities are actually up for the year. There’s something a bit too clever about this analysis and no historical track record of the effectiveness of the analysis is offered.
Nevertheless, considering the consensus forecasts for rising earnings, which need to be downgraded, the firm believes another leg lower is likely.
P/E ratios are potentially helpful in this discussion. You see, P/E ratios are now at historically low extremes (Figure 3). Additionally, the annual return for equities in 2022 (Figure 4.) is on the far left of the tail of a normal distribution suggesting in coming years returns may indeed improve.
Figure 3. P/E ratios for U.S. small and mid-cap stocks as at October 31, 2022
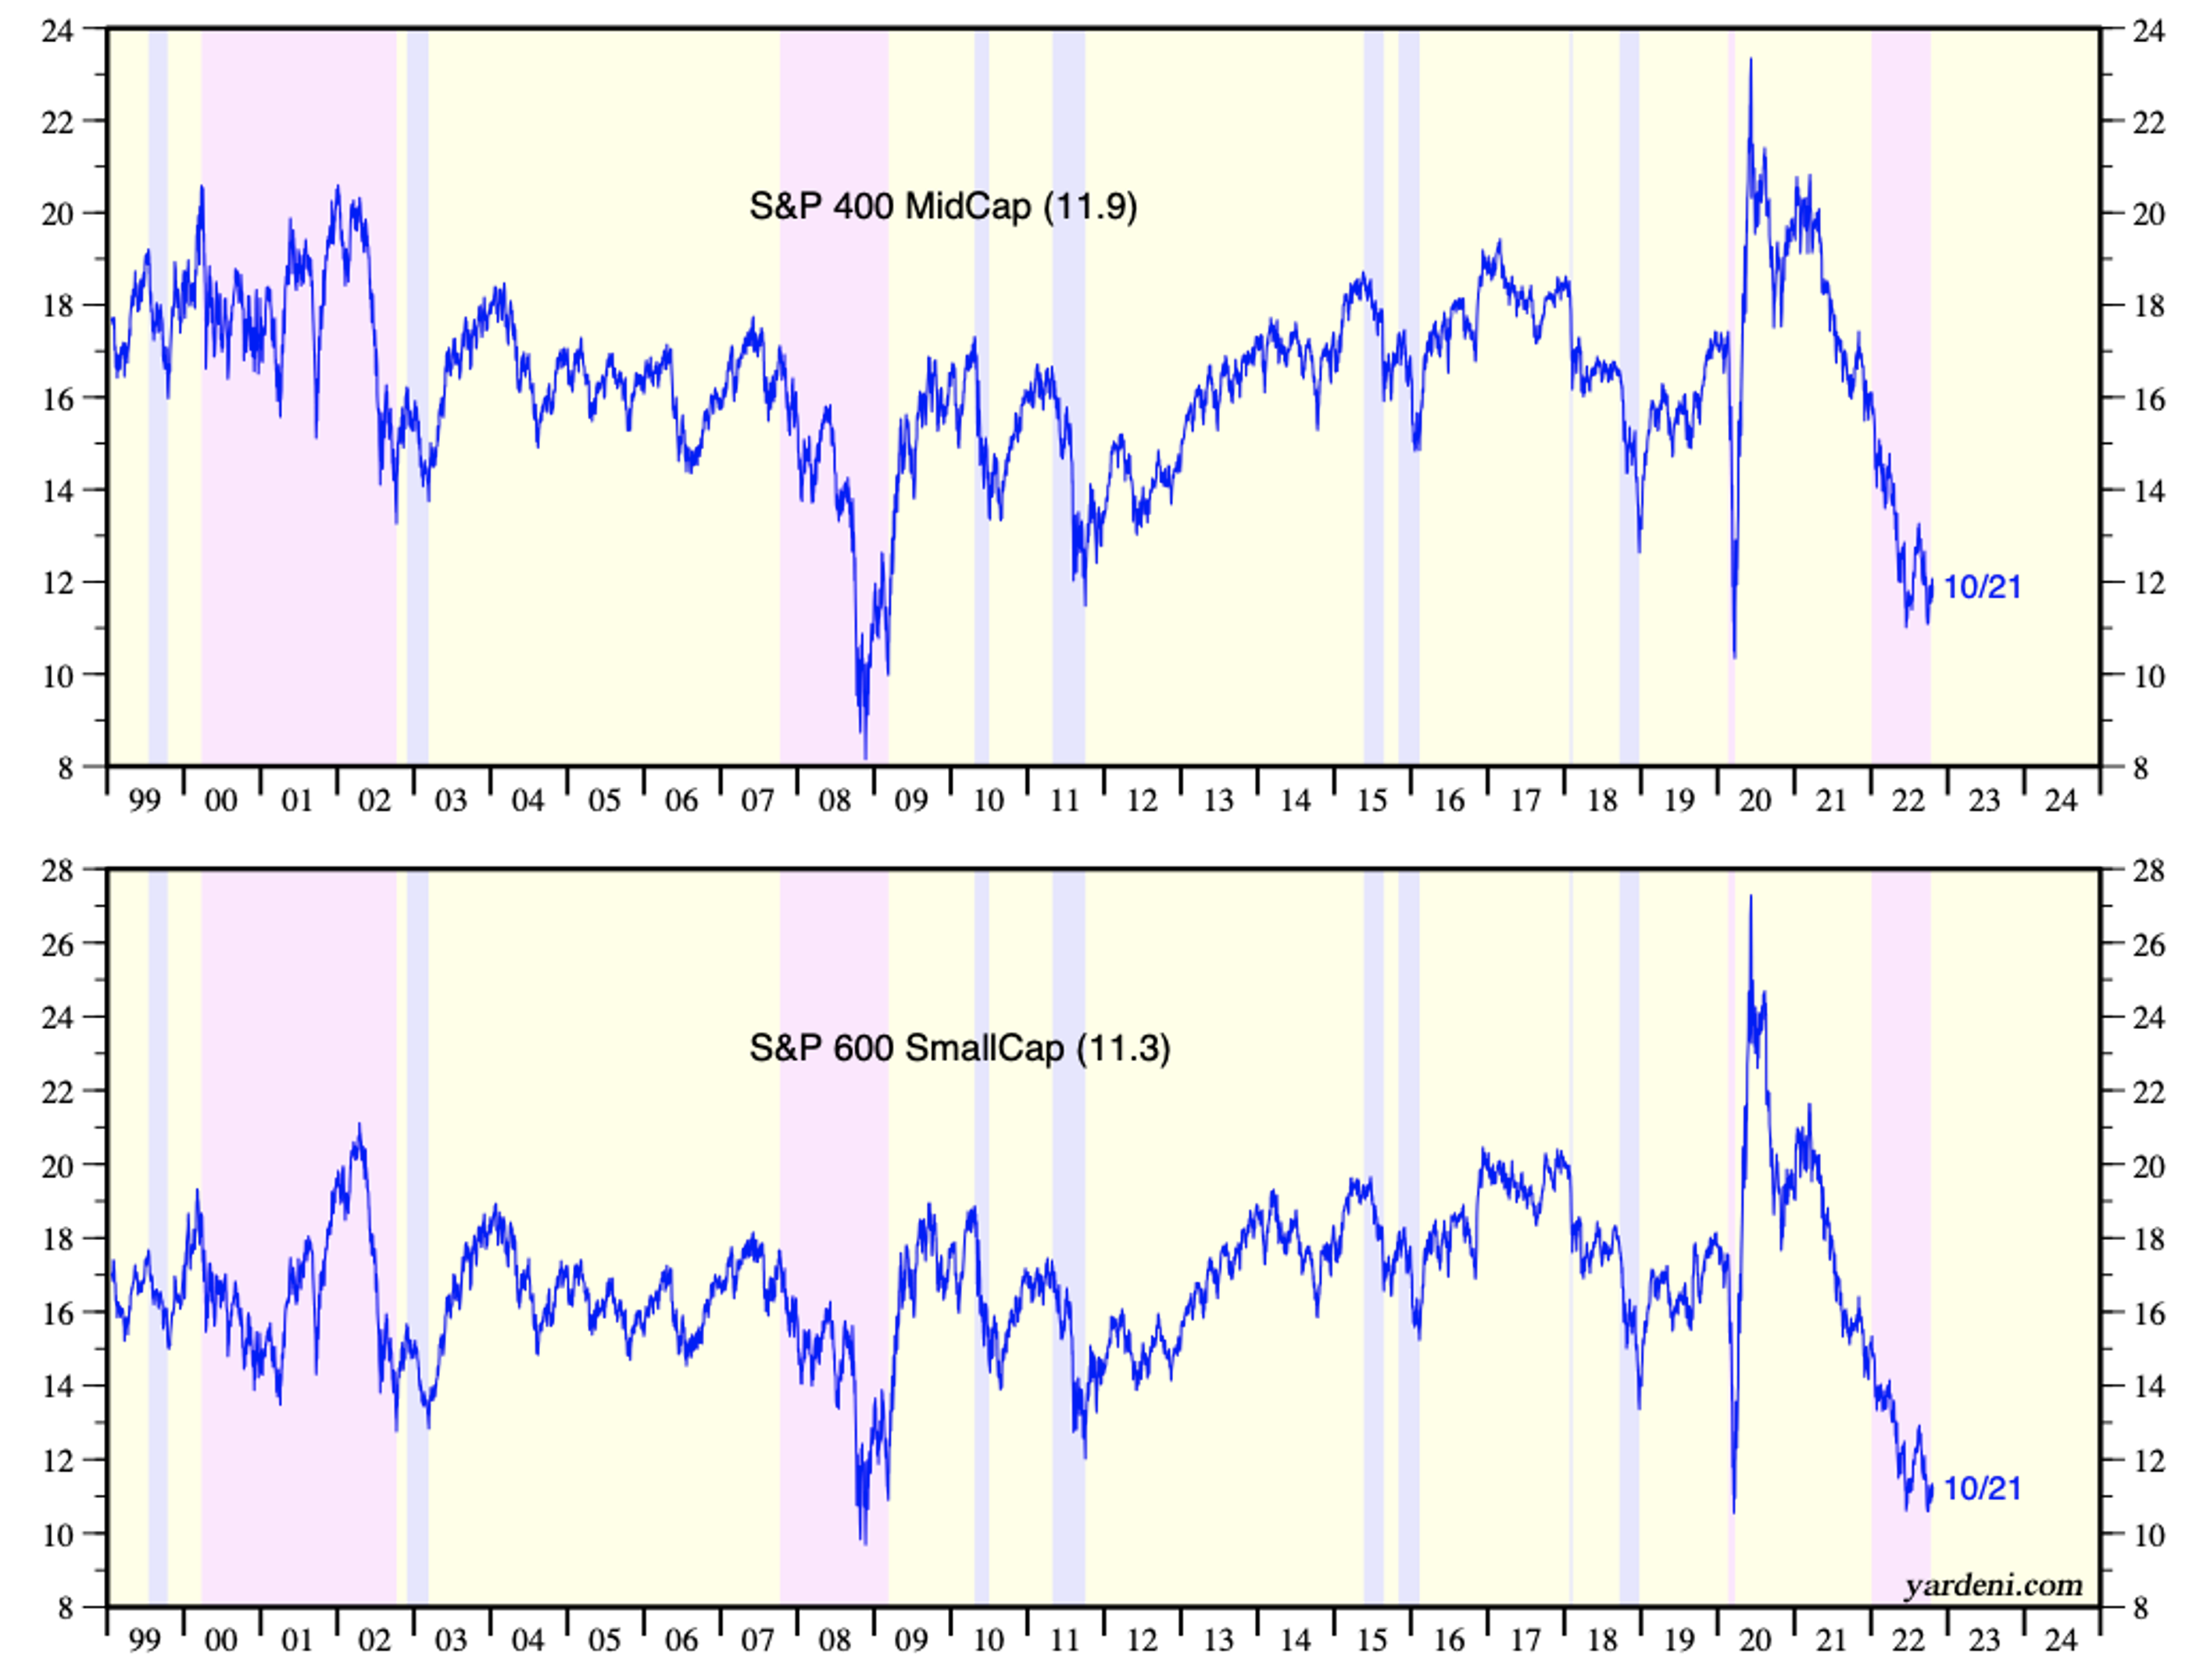
The idea that equities must fall simply because earnings estimates need to be revised lower fails to acknowledge that P/Es might rise. In other words, earnings could indeed fall, but if P/E ratios rise, share prices need not decline.
Consider this example, A stock on a P/E of 10 times $4.00 of earnings will trade at $40. If the earnings per share fall 10 per cent to $3.60, and the P/E rises to 11.1 times (perhaps because investors foresee a peak in rates for example), the result is the share price remains at $40. There is no ‘third leg lower’.
Figure 4. Normal distributions; 2022 on end of tail – extreme
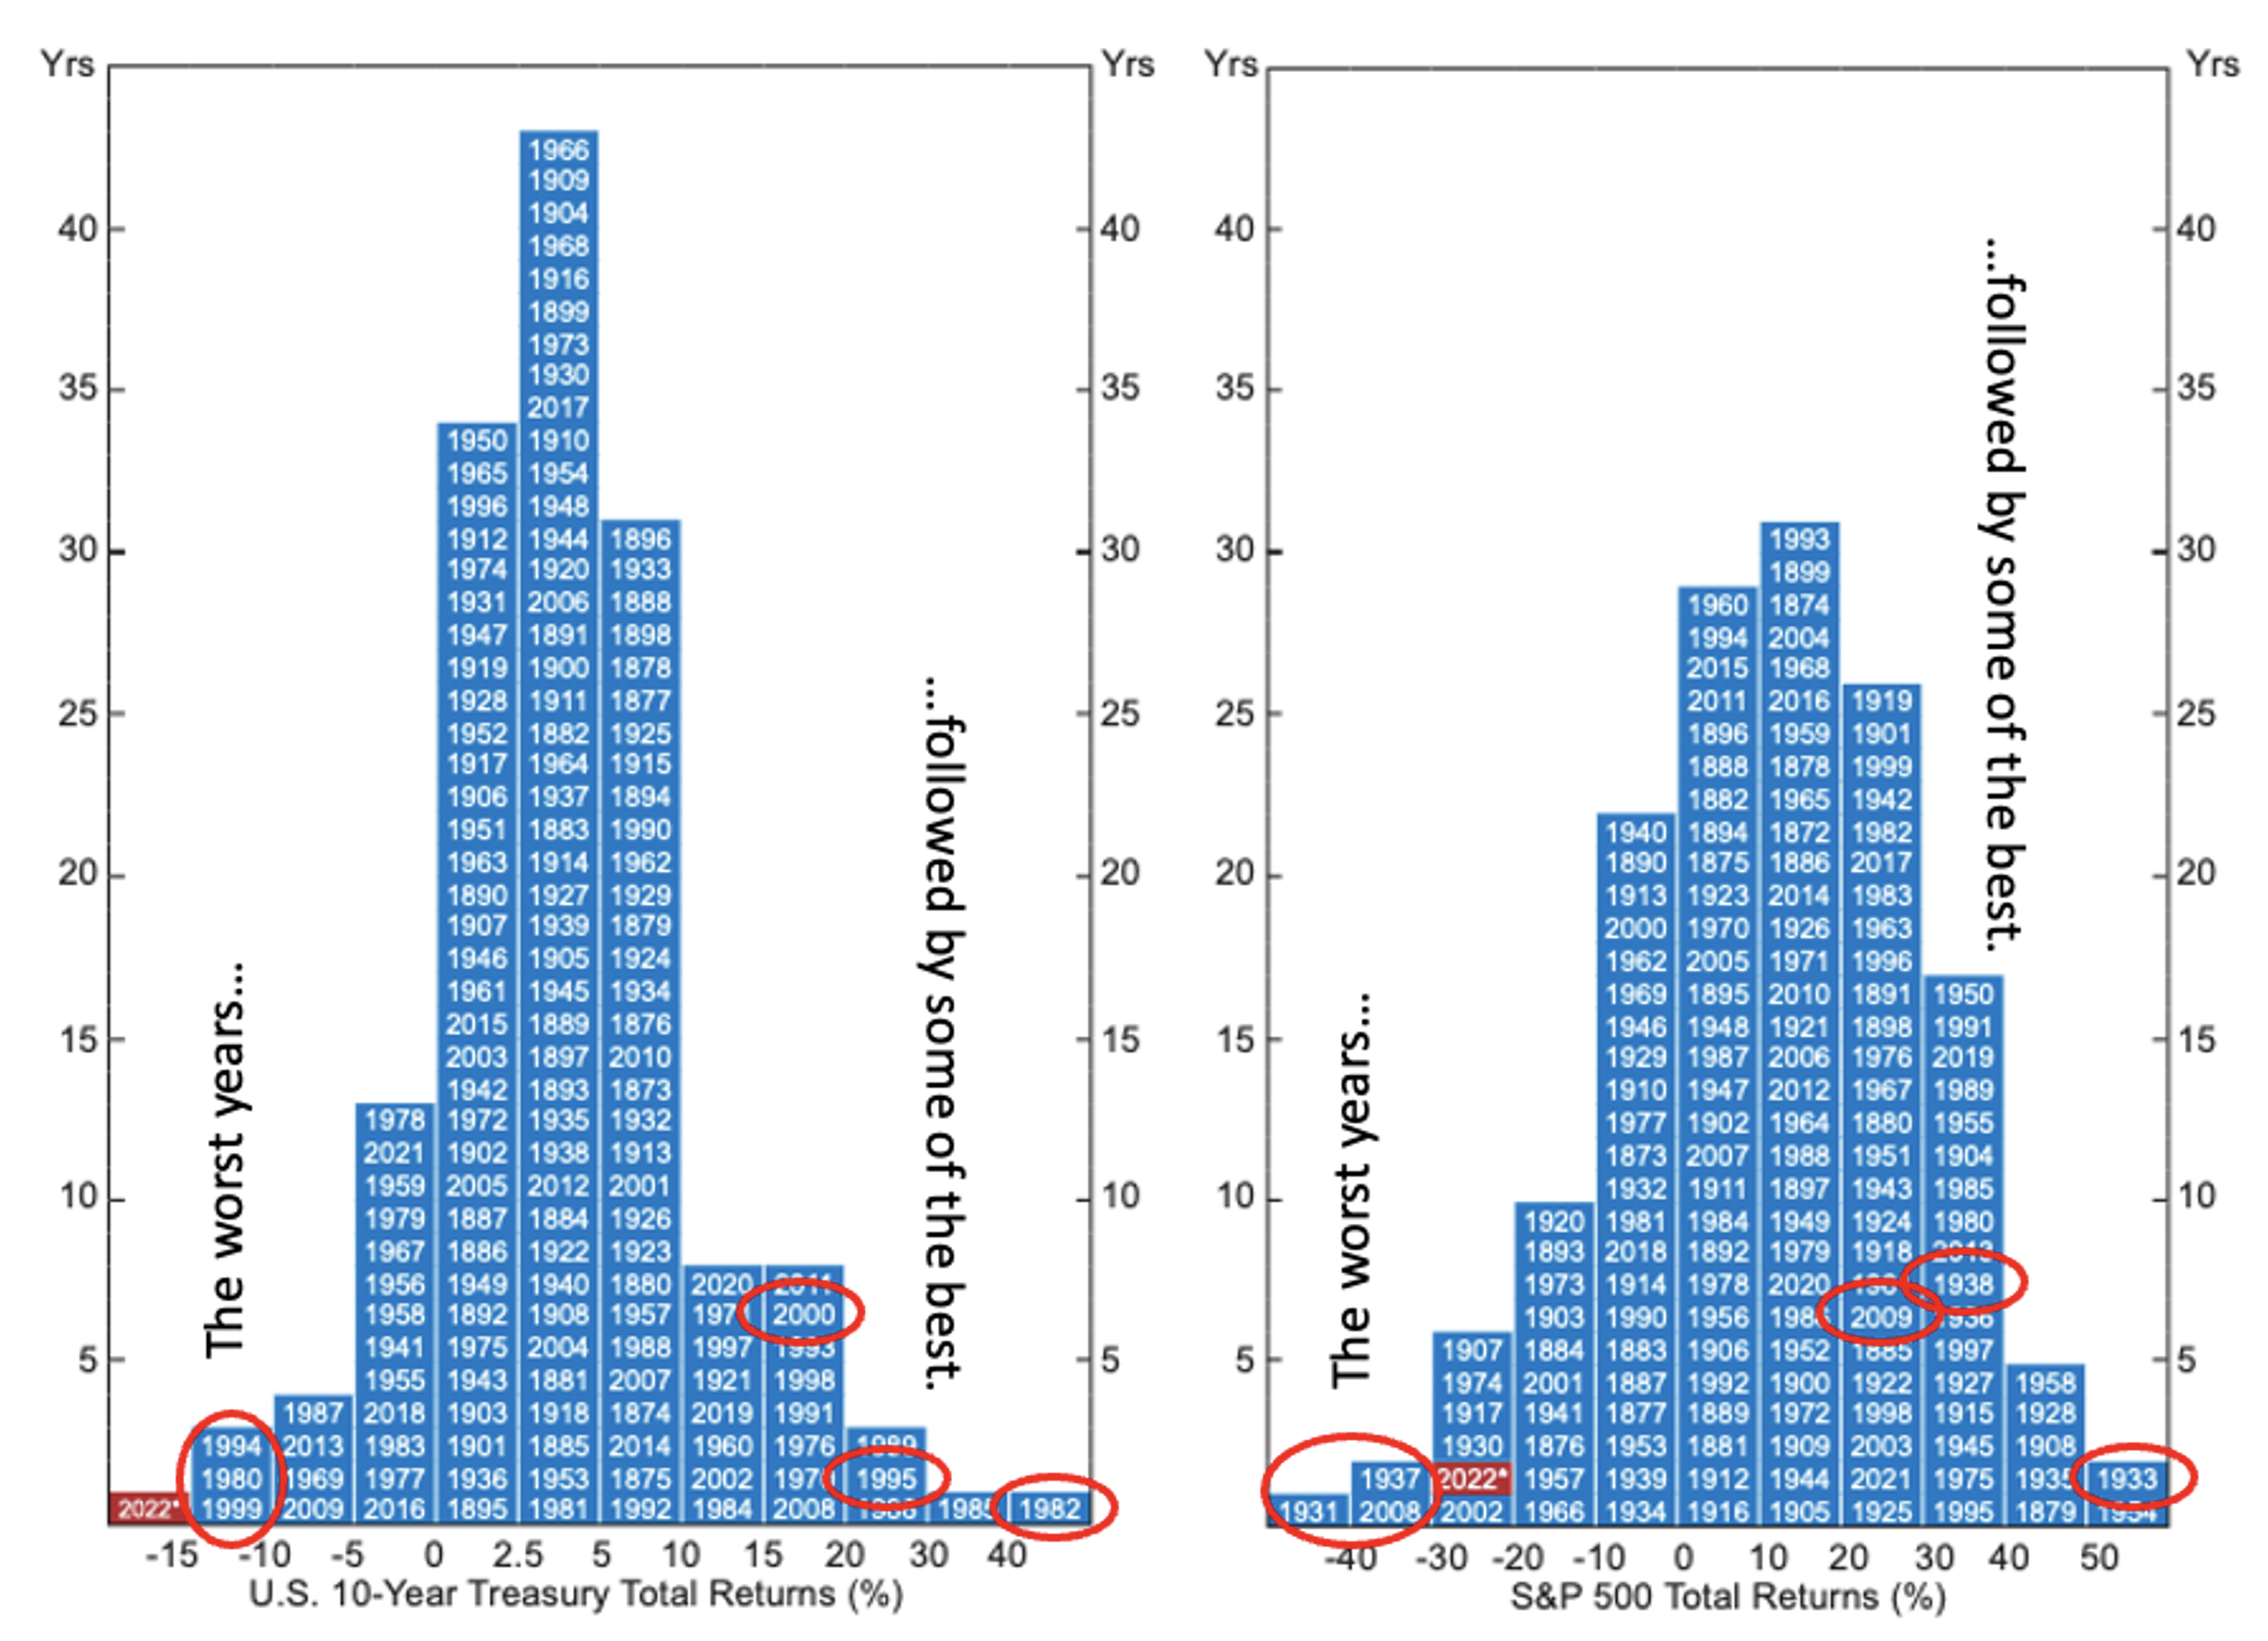
Source: Alpine Macro / Montgomery Investment Management
Further rate rises, particularly by the U.S. Federal Reserve, are another reason some commentators believe the equity market will fall further. But the rising rate scenario is now well flagged. It’s usually a shock of some description that causes serious market routs, not a progression in a known theme or event.
Some commentators also point to a phase of Quantitative Tightening (QT) as a further reason to expect a steep decline in equities. But if their predictions of falling earnings (associated with a recession) transpire, then, presumably, central banks will slow down on QT and may even commence a fresh round of QE.
Of course, nobody knows what events will transpire, and nobody knows how investors, and therefore the market, will react to them.
None of this suggests the market won’t decline. A third leg lower is not an event with zero probability, but if it does transpire, I don’t believe the above analysis explains the reason for it.
Roger Montgomery is the Founder and Chairman of Montgomery Investment Management. Roger has over three decades of experience in funds management and related activities, including equities analysis, equity and derivatives strategy, trading and stockbroking. Prior to establishing Montgomery, Roger held positions at Ord Minnett Jardine Fleming, BT (Australia) Limited and Merrill Lynch.
He is also author of best-selling investment guide-book for the stock market, Value.able – how to value the best stocks and buy them for less than they are worth.
Roger appears regularly on television and radio, and in the press, including ABC radio and TV, The Australian and Ausbiz. View upcoming media appearances.
This post was contributed by a representative of Montgomery Investment Management Pty Limited (AFSL No. 354564). The principal purpose of this post is to provide factual information and not provide financial product advice. Additionally, the information provided is not intended to provide any recommendation or opinion about any financial product. Any commentary and statements of opinion however may contain general advice only that is prepared without taking into account your personal objectives, financial circumstances or needs. Because of this, before acting on any of the information provided, you should always consider its appropriateness in light of your personal objectives, financial circumstances and needs and should consider seeking independent advice from a financial advisor if necessary before making any decisions. This post specifically excludes personal advice.
Nicely said.