
Are we there yet?
Investors would like to know if we are near the bottom. While, trying to time markets is a mugs game, the following three charts offers one interpretation of the prospects for the broader market.
Chart 1. S&P500 now down 18 per cent from recent all-time highs
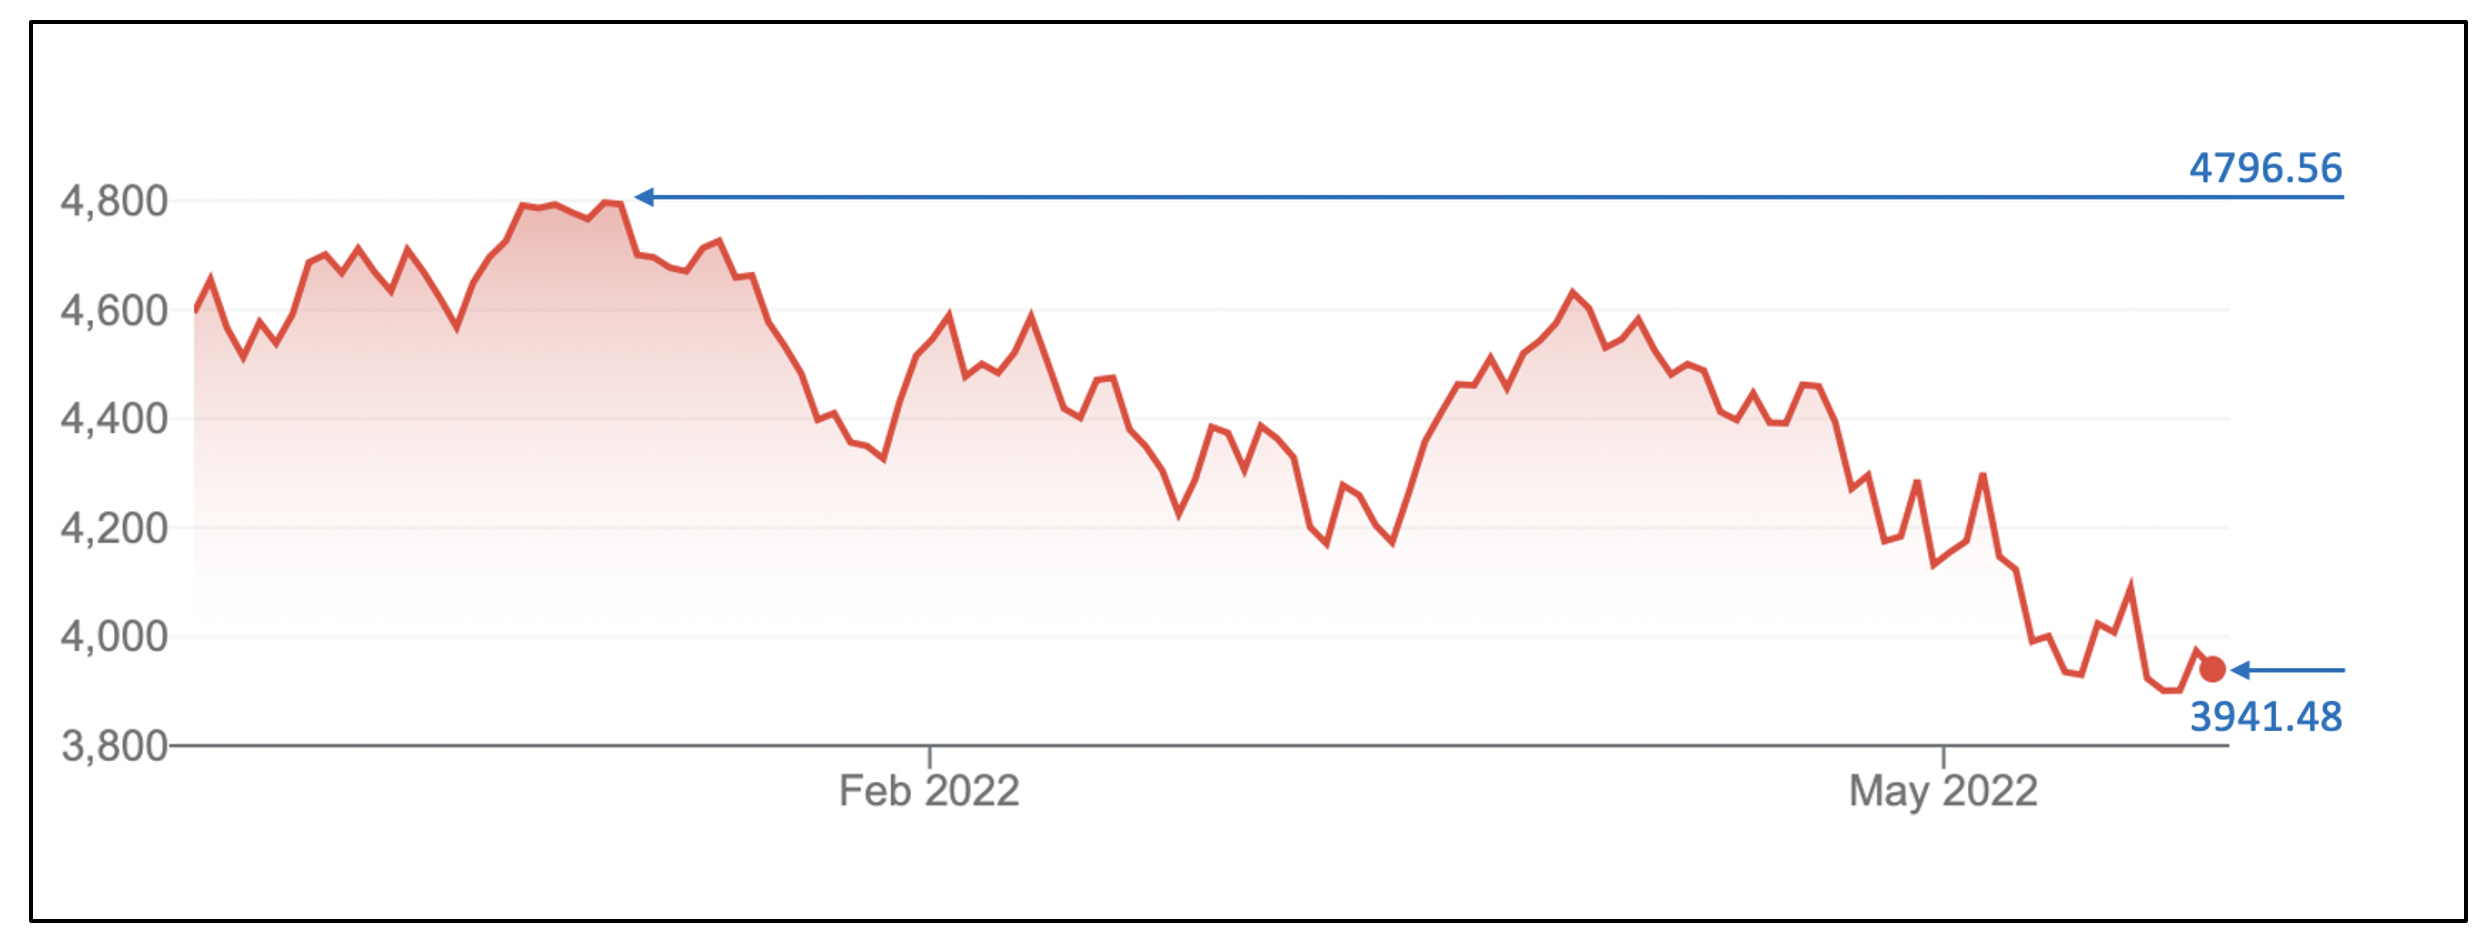
The stock market, as measured by the closing prices of US S&P500 index, has declined approximately 18 per cent since its recent all-time highs at the beginning of the year[1].
Chart 2. S&P500 12 million forward P/E ratios
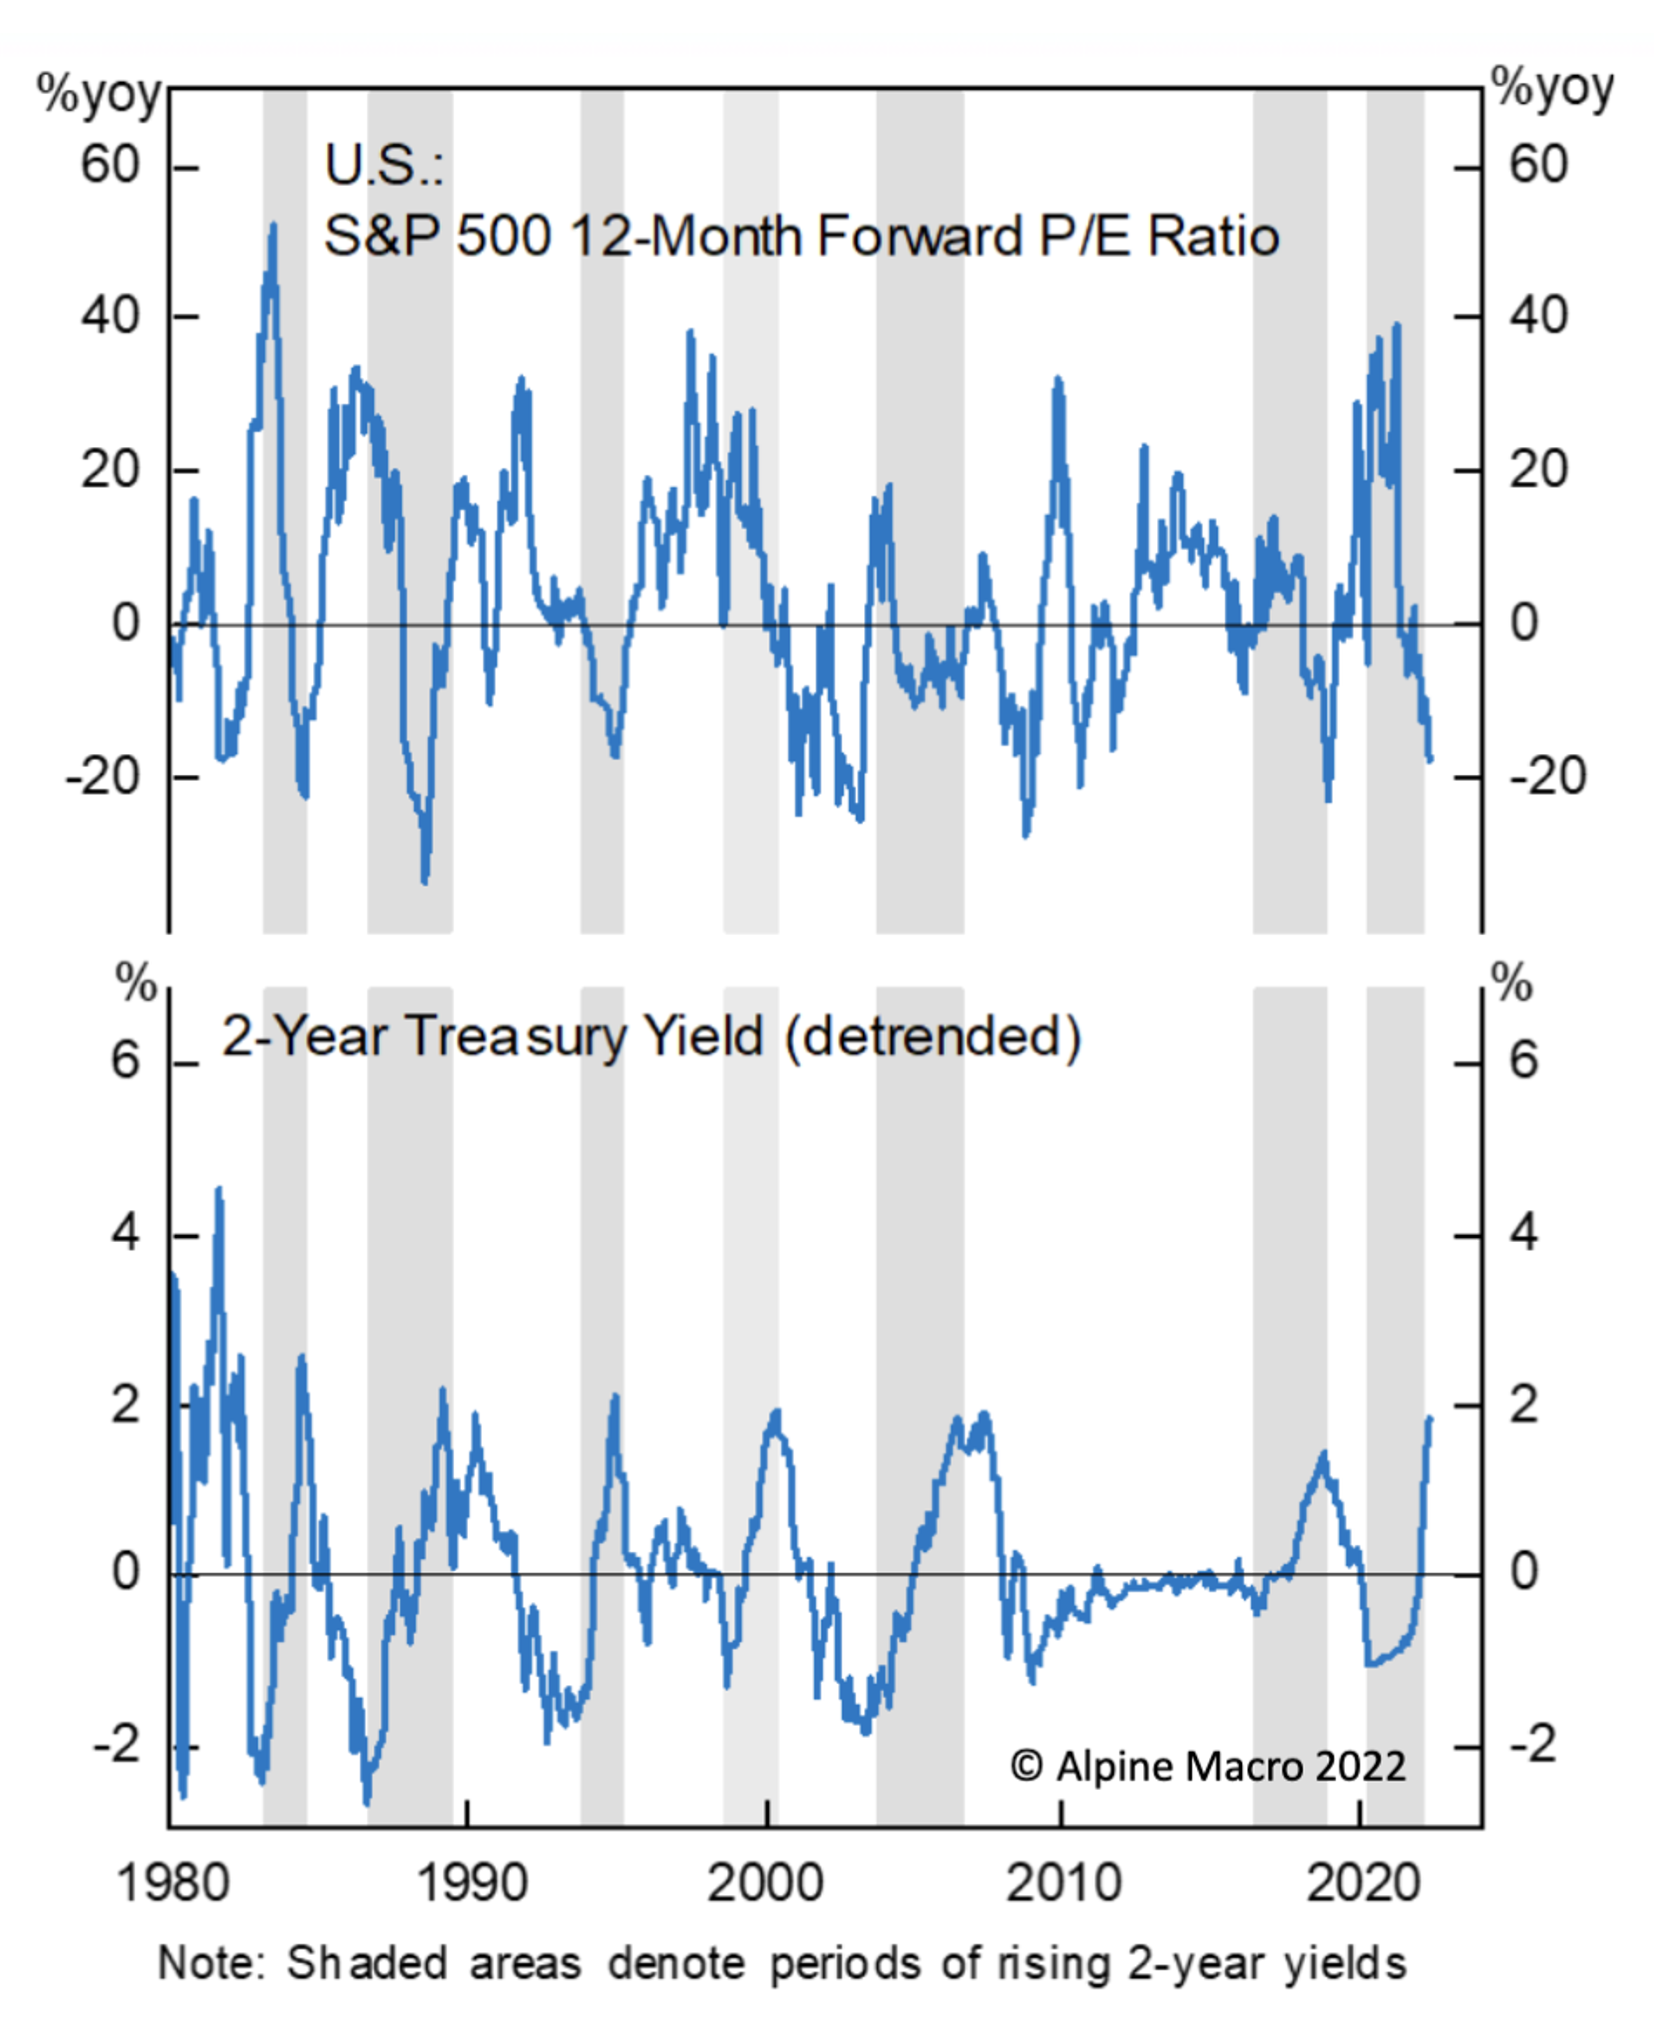
The year over year change in the S&P500’s PE ratio has now reached minus 20 per cent. While the time frames are different, some commentators point to the corresponding magnitude of the decline in both the S&P500 and the year-on-year 12-month forward P/E as indicative of the index’s decline being entirely attributable to P/E contraction. P/E contraction simply refers to a period when investors’ perceptions worsen, and as a result they are willing to pay less for a dollar’s worth of earnings.
According to Factset, as of 20 May 2022, the 12-month forward P/E ratio for the S&P 500 is 16.4. This is now below the 5-year average (18.6) and below the 10-year average (16.9).
Chart 3. S&P500 index versus change in 12month forward consensus EPS
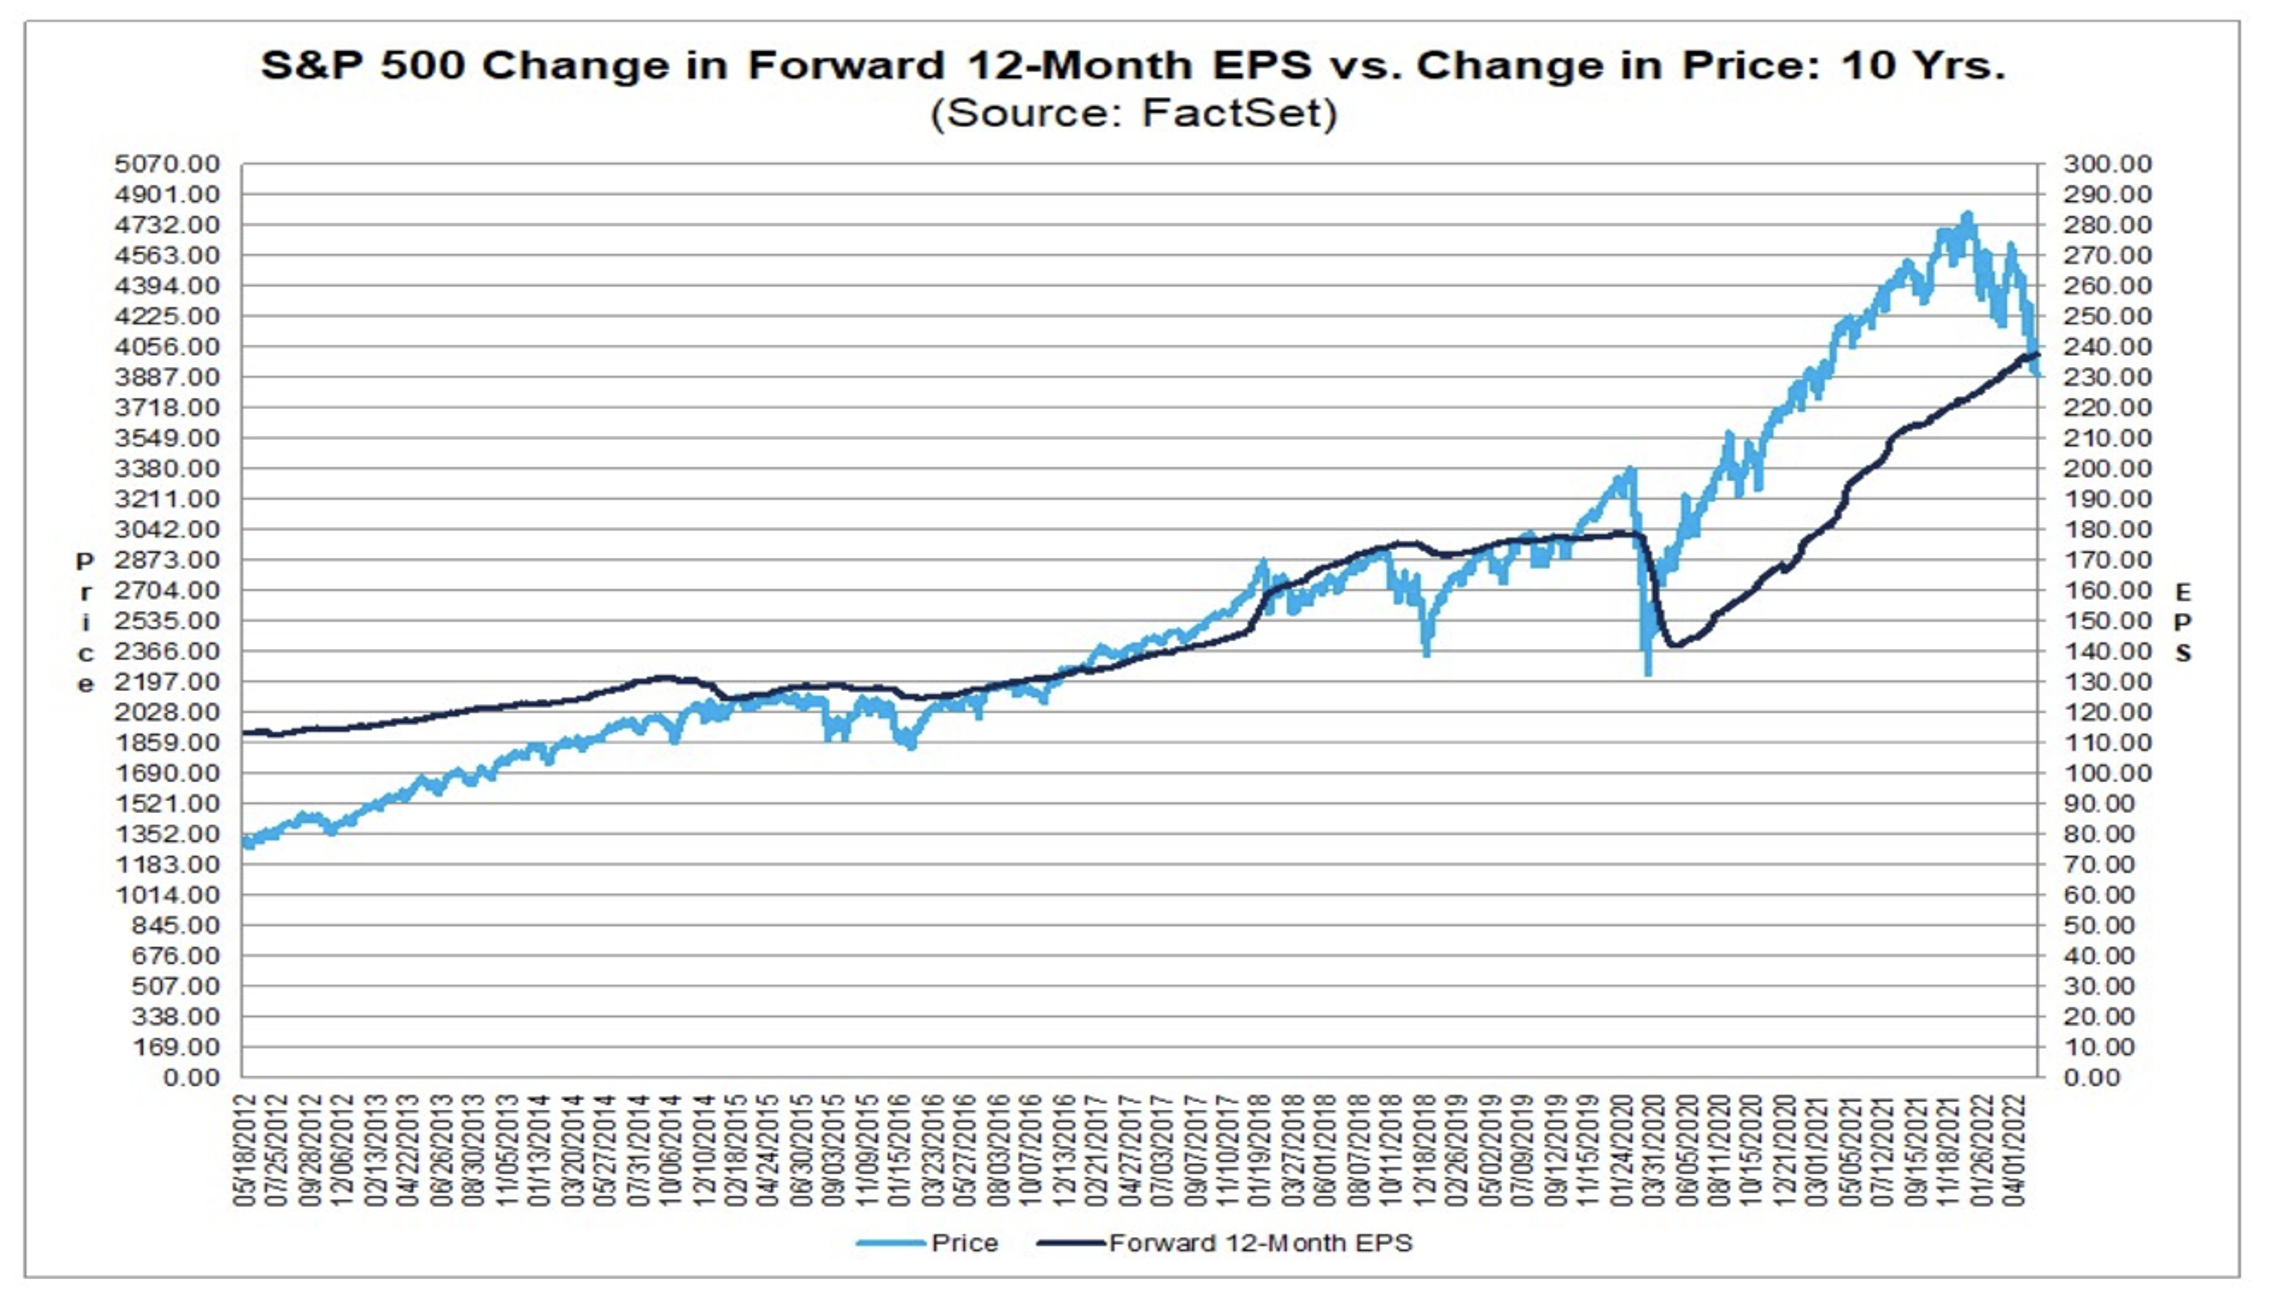
Source: Factset
Chart 3., reveals recent revisions to 12-month forward earnings estimates have been up.
As of 24 May 2022, according to IBES, consensus expects earnings for 2022 to grow 9.7 per cent to 228.84 followed by growth of 9.9 per cent in 2023 to 251.52. Buybacks will play a part in this growth.
According to Factset’s Earnings Insight Report from 20 May 2022, for the second quarter, 62 S&P 500 companies have issued negative EPS guidance and 26 S&P 500 companies have issued positive EPS guidance.
Yardeni Research reported on 24 May 2022, consensus revenue forecasts for 2022 continue to rise, while S&P500 Operating Profit Margin estimates have declined only slightly from the 2022 estimates made late last year. The net effect on estimates for 2022 earnings is for EPS to rise.
We do know the equity market is very efficient at adjusting equilibrium P/E ratios to changes in bond rates. The recent P/E compression must therefore at least reflect the increase in bond rates (assuming the Equity Risk Premium remains unchanged).
[1] The US S&P500 reached an intraday high of 4819 points on 4 January 2022
Roger Montgomery is the Founder and Chairman of Montgomery Investment Management. Roger has over three decades of experience in funds management and related activities, including equities analysis, equity and derivatives strategy, trading and stockbroking. Prior to establishing Montgomery, Roger held positions at Ord Minnett Jardine Fleming, BT (Australia) Limited and Merrill Lynch.
He is also author of best-selling investment guide-book for the stock market, Value.able – how to value the best stocks and buy them for less than they are worth.
Roger appears regularly on television and radio, and in the press, including ABC radio and TV, The Australian and Ausbiz. View upcoming media appearances.
This post was contributed by a representative of Montgomery Investment Management Pty Limited (AFSL No. 354564). The principal purpose of this post is to provide factual information and not provide financial product advice. Additionally, the information provided is not intended to provide any recommendation or opinion about any financial product. Any commentary and statements of opinion however may contain general advice only that is prepared without taking into account your personal objectives, financial circumstances or needs. Because of this, before acting on any of the information provided, you should always consider its appropriateness in light of your personal objectives, financial circumstances and needs and should consider seeking independent advice from a financial advisor if necessary before making any decisions. This post specifically excludes personal advice.