
Analysing US COVID-19 developments – NY tracking 6x worse than Italy
Investors are looking at the US COVID-19 data as a guide for when markets may settle down. Our view is that it’s going to be tough for markets to find a bottom until it becomes clear that the US understands the scale of its COVID-19 problem and is taking appropriate steps to mitigate.
We looked at State level testing and case progression data, the idea is to get some early insights on how this may drive the US level COVID-19 (C19) data releases the market is focused on. We didn’t get very far, we stopped at the New York data.
The recent ramp up in testing in the State of New York has started to identify the scale of the problem that exists there, and its not good. The data in New York is tracking approximately 6x worse than the data for Italy when it was at a similar stage in its C19 case evolution.
This is illustrated in the charts below. What you are looking at is cases per capita (y-axis) log scale plotted against days since caseload achieved 1 case /million in each location (x-axis). On 5 March New York recorded its 22nd known case of COVID-19, or 1.1 cases per million of population, Day 0. For Italy Day 0 was 23 February.
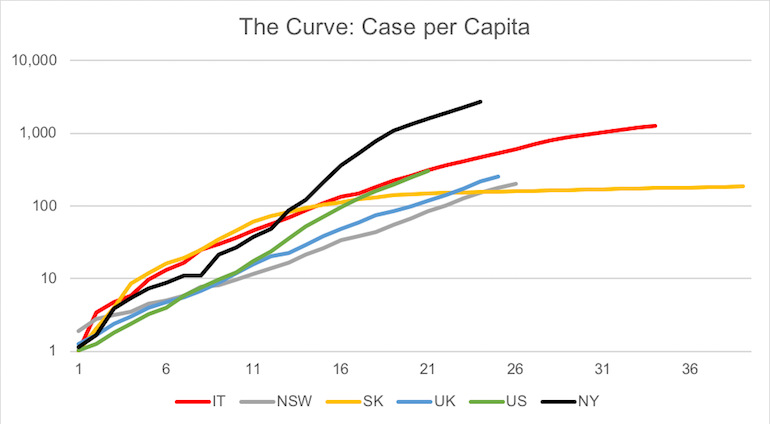
Source: Montgomery
Day 23 is 28 March for New York, and 17 March for Italy – New York is currently tracking at 5.8x the caseload per capita as Italy was at this stage of its C19 outbreak. That’s terrible.
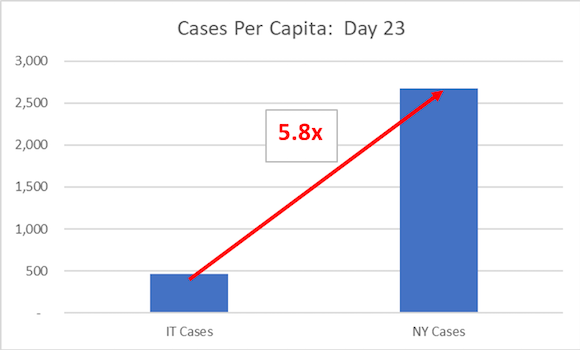
Source: Montgomery
Much of this acceleration in case reporting has been driven by testing. New York has rapidly ramped testing in the past 10 days – see chart below – and unfortunately it has discovered the scale of its problem, with detection rates regularly greater than 30 per cent. This is a very high detection level, and we take this as evidence of mass community transmission, we make this assessment knowing that the detection rate in South Korea, during its peak was in the range of 6-10 per cent and this was for just 6 days. New York has started its testing process too late, it was unprepared for C19.
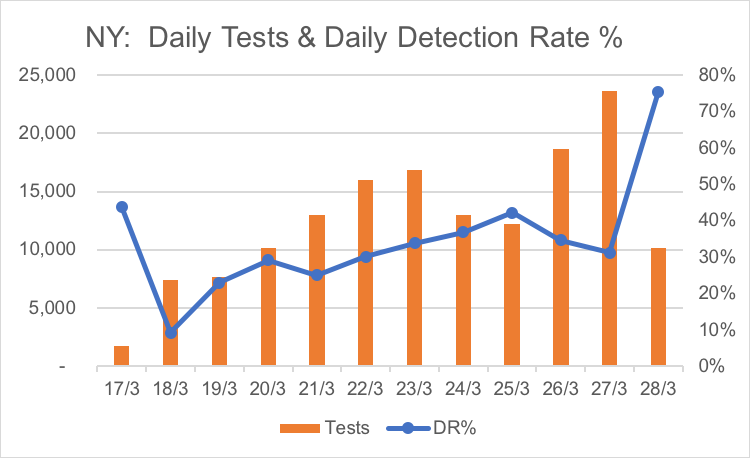
Source: The COVID Tracking Project, Montgomery
As we have written in our previous C19 articles the key to suppressing the transmission rate early enough – to avoid mass casualties – is to test early and hard alongside strong trace, contact and isolate doctrine. It appears now too late for this approach to work in New York. It is already likely to have experienced significant community transmission and now will be dealing with the cases and waiting for the effect of the shutdown (announced 20 March, effective Sunday 22 March 22) to have its impact on caseload progression. We observed in Italy that approximately 2 weeks post its shutdown its daily new caseloads appeared to show evidence of having peaked.
Until then we expect to see rising caseloads, with the expected corresponding impact on the New York health system with implications for the case fatality rate (CFR) as we have observed in Italy. Italy’s CFR was 10.8 per cent on 28 March and rising.
What about the rest of the US?
Given the extent of New York’s case growth, the data is currently driving the overall case volumes for the US. However the rest of the US is unlikely to be far behind, and although it will have benefitted from the warning from New York, its fair to say that those other states are likely unprepared too. This is probably best demonstrated by the testing per capita which we have compiled and is observed in the chart below.
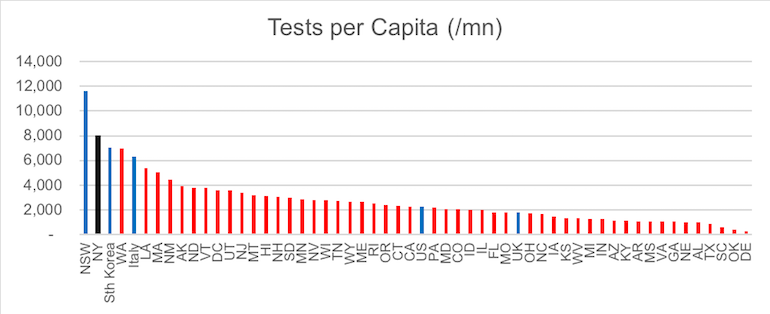
Source: The COVID Tracking Project, Montgomery
To provide some perspective we have embedded and highlighted the country level datasets we track in blue, New York is in black. The data suggests to us that there are very few US states that have tested at sufficient levels to understand the potential level of C19 transmission in their communities. (The UK is worrying too.)
There are some States that have to date tested at a reasonable cadence, but further investigation uncovers that most of these have case volumes that suggest community transmission has already occurred and therefore the scope for the test, trace and isolate doctrine to put pressure on the transmission rate may be limited;
- WA – Washington State has performed almost 60,000 tests, but has over 4,000 cases.
- LA – Louisiana – 25,000 tests, but over 3,300 cases, with New Orleans a reported hotspot
- MA – Massachusetts – over 35,000 tests, but over 4,000 positives
- New Mexico – Only 208 cases so far, but over 11,000 tests to date – test and trace viable here perhaps?
Today approximately 140 million US citizens are under stay at home type orders, with most having been in that condition for about a week. We hope that those actions were effected quickly enough to deny the virus the opportunity to spread. Although we expect to see rising new caseloads in the US for the next week to 10 days, maybe (probably) longer.
A quick word on Australia
The data for NSW continues to track better than elsewhere. We look like its possible with our testing cadence to be able to pursue the test, trace and isolate doctrine as a way to suppress community transmission. Known epidemiology are high (82 per cent last) and over half of known cases have arrived from overseas. So far so good.
Keep social distancing and stay healthy.
Gary Rollo is the Portfolio Manager of the Montgomery Small Companies Fund. Gary joined Montgomery in August 2019 after spending three years at MHOR Asset Management in Sydney as a Founder and Portfolio Manager. Prior to this, Gary was a Portfolio Manager at Renaissance Asset Manager in Sydney for six years. Before moving to Australia, Gary spent five years in London running Morgan Stanley’s Technology Sector Equity Research Team, as well as two years covering technology companies for JP Morgan.
This post was contributed by a representative of Montgomery Investment Management Pty Limited (AFSL No. 354564). The principal purpose of this post is to provide factual information and not provide financial product advice. Additionally, the information provided is not intended to provide any recommendation or opinion about any financial product. Any commentary and statements of opinion however may contain general advice only that is prepared without taking into account your personal objectives, financial circumstances or needs. Because of this, before acting on any of the information provided, you should always consider its appropriateness in light of your personal objectives, financial circumstances and needs and should consider seeking independent advice from a financial advisor if necessary before making any decisions. This post specifically excludes personal advice.
Gary, usually articles make for great reading and I’m an avid supporter (and investor) of Montgomery, however, this isn’t really a fair comparison. You’re comparing the US hot spot with an entire country/population. A fairer comparison would be the Lombardy region (or something to that effect) as it is the Italian hot spot exactly as NY is the US hot spot.
Samuel. Thanks for your post & I think that’s a fair comment. We aim to create a balanced picture with all the information and views we share. A couple of thoughts to add some further perspective. First; NYC is roughly 40% of the population of NY State, but it appears that most of the cases that are in NY state are in NYC, and that skews the ratios we published further lifting that 6x scale issue to potentially much more. However the testing dataset availability prevented us for making that direct compare NYC to Lombardy. Second; to understand if the position that we observed in NY would likely over the fullness of time be an outlier, we looked at testing levels in every US state on a per capita basis, looking for that evidence that testing was being used as a way to deny the virus the ability to propagate and we presented that content in the blog. Thanks for your contribution. Gary