
More bears join the chorus
As the list of bears publicly declaring the end of the stock market’s bull run grows, so does the wave of charts, indicators and correlations used to explain or justify the growing chorus of crash predictions.
The bear camp’s advocates now include, most vocally, Scott Galloway, Ray Dalio and Michael Burry, and perhaps more reservedly, Torsten Sløck. Others in the bear camp include Jim Rogers and Morgan Stanley’s Mike Wilson.
By way of a quick summary, Michael Burry is sounding the alarm over an excessive debt frenzy and venture-capital overconcentration in artificial intelligence (AI), comparing it to the dangerous tech-bubble excesses of the past. Mike Wilson has outlined bear-case scenarios in which escalating international tariffs and restrictive Federal Reserve policies could trigger a steep correction or recessionary drop in the S&P 500. Meanwhile, Jim Rogers is warning of a severe, potentially historic global financial crisis, citing excessive global debt and escalating geopolitical shocks. And finally, Scott Galloway notes that whenever new tech infrastructure spending exceeds 2-to 3 per cent of Gross Domestic Product (GDP), a massive market correction follows, just as it did after the railroad boom, early electrification, telecom buildout, and the 2000 dot-com bubble.
And then there’s Warren Buffett, who’s said little but has acted convincingly, selling down the equity portion of Berkshire Hathaway’s portfolio and building cash to almost US$400 billion.
On the periphery of these high-profile calls and moves, a conga line of analysts is pointing to a variety of indicators to support their bearish thesis. And while I am not inferring they are wrong or right, it’s important for investors look critically at one before deciding to adopt it as a basis for an investment decision.
Figure 1. Composite Valuation Indicator
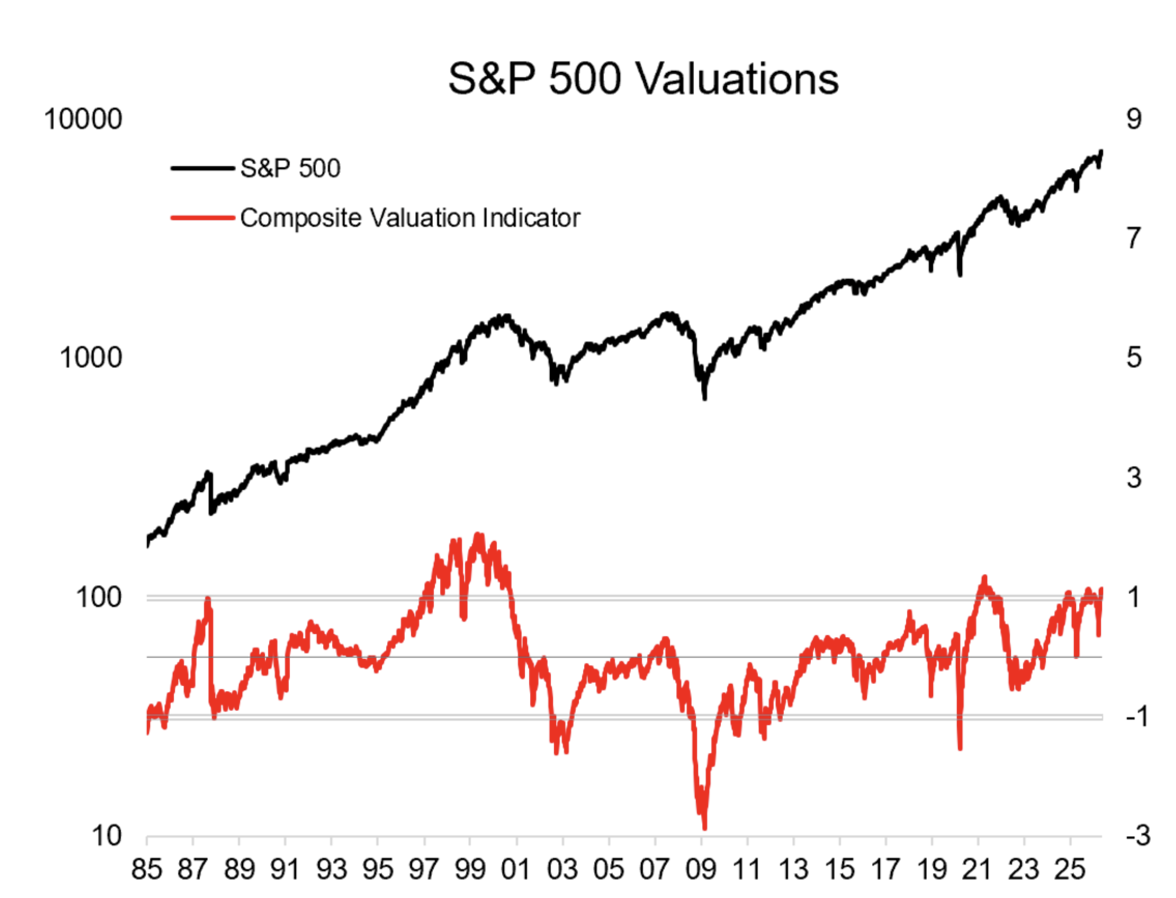 Source: TopDown Charts, LSEG, Callum Thomas
The chart in Figure 1., plots the S&P 500 against a proprietary indicator called the Composite Valuation Indicator. Upon first glance, the indicator appears to have reached an extreme overvaluation score of more than +1, and the indicator’s creator states, “valuation indicators are sounding a background warning tone.”
Because the line primarily oscillates between -1 and +1, it tells us the indicator is denominated in units of Standard Deviations from a historical mean. According to the empirical rule of a normal distribution, also known as the 68-95-99.7 rule says that about 68.3 per cent of all historical data points will naturally fall within +/- 1 standard deviation of the mean. Movements outside of this band represent statistical anomalies or tail events. For instance, the massive spike toward +3 during the year 2000 (the Dot-com bubble) is an outlier, an event with a theoretical probability of less than 0.3 per cent in a perfectly stationary distribution.
It all sounds reasonable and even insightful. That is, until we realise that there aren’t a sufficient number of occurrences (observations) above +1 over the last 41 years to say whether the signal is reliable. As there have only been five occurrences, there’s little option but to keep observing.
And practically, at what point after the line transitions above +1 should the investor be so sufficiently ‘warned’ that they should sell equities – if, presumably, that’s the point? The indicator rose above +1 in 1997 or 1998, and we know the stock market roared higher for another 2-3 years. It seems the indicator also exceeded +1 in 2021, and the market rallied that year.
Perhaps it’s just another indicator used to warn investors to be on the lookout for other warning indicators, indicating that investors have been warned. I am not sure.
Instead, it seems reasonable to conclude that rising bond rates, if they persist, will negatively affect asset valuations. They always have, and the relationship is mathematically irrefutable. That this comes at a time when another new general-purpose technology (GPT) has produced a hyper-exponential spending race to scale that technology and simultaneously produced an associated jump in valuations is also noteworthy.
While indicators can be a convenient visual representation of market conditions, they can also be used by investors as a shortcut for ill-considered decisions. By all means, watch the graphs, but don’t forget the fundamentals that drive markets and investor sentiment.
Roger Montgomery is the Founder and Chairman of Montgomery Investment Management. Roger has over three decades of experience in funds management and related activities, including equities analysis, equity and derivatives strategy, trading and stockbroking. Prior to establishing Montgomery, Roger held positions at Ord Minnett Jardine Fleming, BT (Australia) Limited and Merrill Lynch.
He is also author of best-selling investment guide-book for the stock market, Value.able – how to value the best stocks and buy them for less than they are worth.
Roger appears regularly on television and radio, and in the press, including ABC radio and TV, The Australian and Ausbiz. View upcoming media appearances.
This post was contributed by a representative of Montgomery Investment Management Pty Limited (AFSL No. 354564). The principal purpose of this post is to provide factual information and not provide financial product advice. Additionally, the information provided is not intended to provide any recommendation or opinion about any financial product. Any commentary and statements of opinion however may contain general advice only that is prepared without taking into account your personal objectives, financial circumstances or needs. Because of this, before acting on any of the information provided, you should always consider its appropriateness in light of your personal objectives, financial circumstances and needs and should consider seeking independent advice from a financial advisor if necessary before making any decisions. This post specifically excludes personal advice.