Our top picks in the mining services space
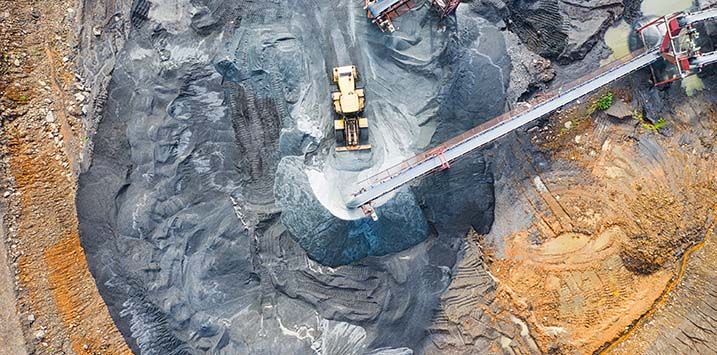
Surging commodity prices and a deep infrastructure pipeline support a positive medium-term outlook for contractors, a sector which has broadly lagged the market recovery. Here, we share our preferred businesses – we favour players with strong management teams, scaled business with ability to take market share as the cycle strengthens.
Better than expected vaccine news has driven a strong response from global equity markets, setting a clearer path towards a potential broad-based macroeconomic recovery scenario. Commodity prices have rallied accordingly, particularly copper – a bellwether for global growth – which is up 12 per cent over the past month to five-year highs on anticipated improving fundamentals.
Leveraged to this thematic, we still see value in a select group of mining services companies which are effectively derivatives of underlying mining activity. Despite mining activity remaining relatively robust throughout the pandemic, the mining services sector has generally lagged the broader equity market over the past year (down 11 per cent Vs Small Ordinaries up 6 per cent) and continues to trade at a meaningful discount to the market (7x FY1 EV/EBIT Vs Small Ordinaries on 19x).
Dominic Rose is the Portfolio Manager of the Montgomery Small Companies Fund. Dominic joined Montgomery in August 2019 after spending thirteen years specialising in smaller companies in portfolio management and equities research. Most recently, Dominic was a Portfolio Manager and Senior Research Analyst at MHOR Asset Management in Sydney for three years. Prior to this, he ran Deutsche Bank’s Small Caps Equity Research Team in Sydney for six years. He was also previously Head of Research at Foster Stockbroking.
This post was contributed by a representative of Montgomery Investment Management Pty Limited (AFSL No. 354564). The principal purpose of this post is to provide factual information and not provide financial product advice. Additionally, the information provided is not intended to provide any recommendation or opinion about any financial product. Any commentary and statements of opinion however may contain general advice only that is prepared without taking into account your personal objectives, financial circumstances or needs. Because of this, before acting on any of the information provided, you should always consider its appropriateness in light of your personal objectives, financial circumstances and needs and should consider seeking independent advice from a financial advisor if necessary before making any decisions. This post specifically excludes personal advice.
Interested in your view on Imdex financials. In 1H21 and before it appears FCFE implied from the cash flow statement is a lot higher than that implied by P&L mainly because cash receipts are higher than revenue and capex is lower than D&A. In your discussions with mgmt have they provided any insight into why this disparity persists?
Hi Ryan, thanks for your question. Yes, I have spoken to management about this. Operating cashflow benefited from a working capital improvement which doesn’t show up in the EBITDA calc. This improvement (c.$8m) reflects FX impacts (AUD appreciated against USD and IMD reports balance sheet items in AUD), lower inventory (South Africa, South America and S.E. Asia were all slower to recover and are all higher fluid sales regions – so less stock requirements) and some tax timing benefits. On the capex vs D&A question, you need to unpack D&A and look at the core depreciation component which has been running in line with capex over the past few years and did during 1H21. Annual D&A comprises around $20m for core depreciation, $6m leases and around $4m acquisition amortization. So the $10.7m capex figure reported in 1H21 broadly matches core deprecation ($20m annualized or $10m per half). Hope this helps. Cheers, Dominic.