
The screen
On Friday morning, the local share market reacted negatively to overseas developments. I took this as an opportunity to screen the market in search of industry groups that offer attractive relative valuations, in order to focus on a few ideas for our research team to investigate.
In a typical screen, we first calculate each company’s enterprise valuation (EV) – otherwise known as their market capitalisation – or number of shares on issue multiplied by the prevailing share price, plus their net indebtedness. The EV is then divided by the denominator; earnings before interest, tax, depreciation and amortisation (EBITDA). EBITDA is an earnings measure that effectively strips out ‘accounting’ adjustments, particularly at the depreciation and amortisation level. It’s a simple way of comparing apples with apples. Like the overused P/E multiple, it’s a measure at a point in time: it does not take growth, cost of growth, or capital hunger into consideration.
After eliminating very small businesses because of lack of liquidity, I also eliminate those companies who produce a negative EBITDA in their latest full year result. In addition, those companies’ consensus EBITDA forecasts must also be positive over each of the next two years. Sectors like banks and insurances are also excluded, as I feel they cannot be compared reasonably on this relative basis screen approach.
Once I’ve boiled-down the list, which currently stands at 373 companies, I then derive each company’s EV/EBITDA multiple. A mouthful perhaps, but it is this multiple that allows a ‘relative’ valuation screen to divide our universe into 21 industry groups for comparison purposes.
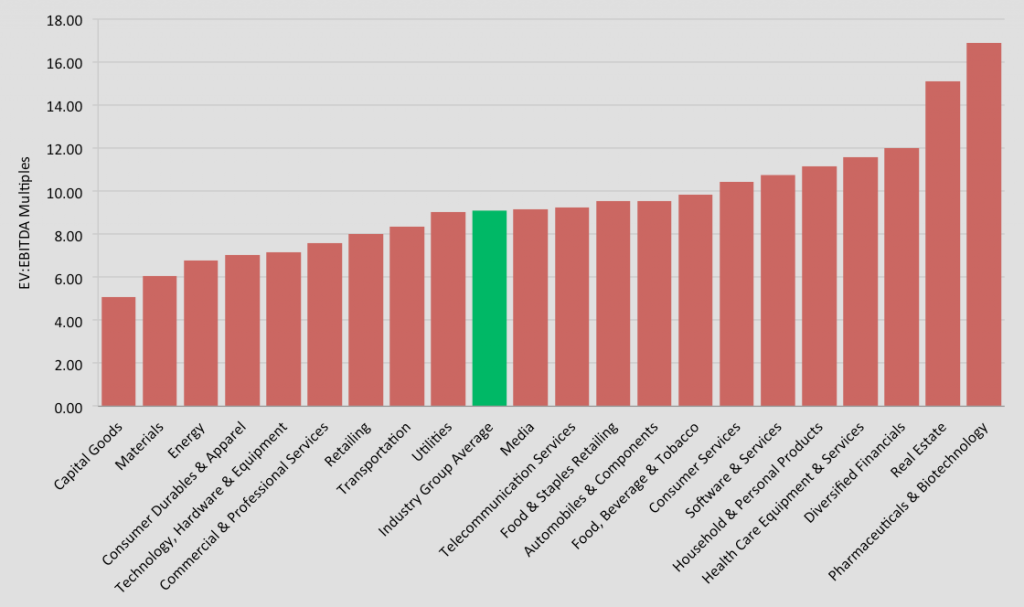
One key issue with this simple relative valuation screen, is that it’s easy to focus on the ‘cheapest’ sectors. For example, the industry group Capital Goods (on the very left of the graph) clearly fits this bill.
Our screen estimates that on average the Capital Goods industry group has a forecast 2016 EV/EBITDA multiple of just 5.1 times, which compares to the market average of 9.1 times. On the surface, this 80 per cent relative discount appears to be highly attractive.
However, this is where simple screening can sometimes do more harm than good. While I can quickly ascertain whether a particular sector looks cheap, the key consideration within the investment process is whether the sector in question has bright prospects. In short, cheap sectors with lousy prospects deserve to be cheap.
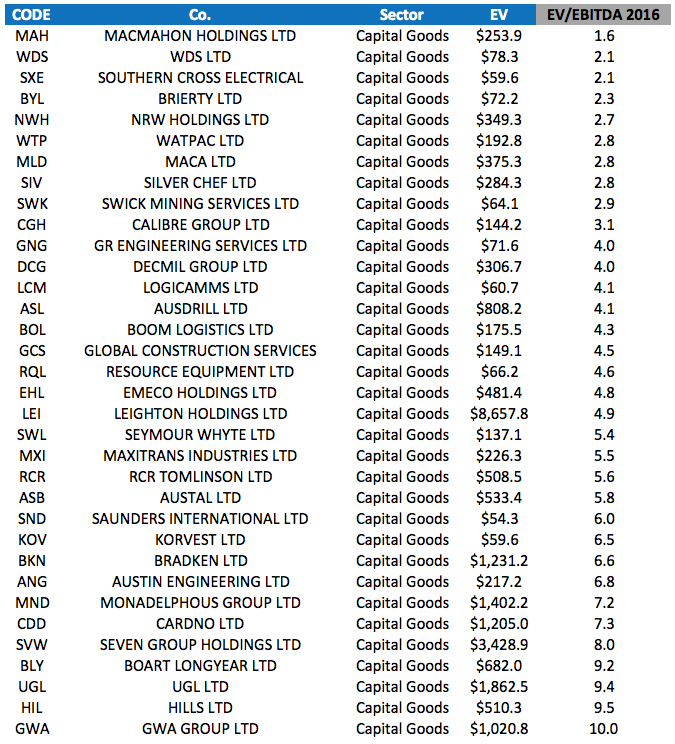
When I look at the constituents of the Capital Goods industry group, many companies within (MAH, SXE, BYL, NWH, MLD, SWK, CGH, GNG, DCG, LCM, ASL etc) can all loosely be described as ‘mining services’ companies. The success or failure of these businesses is largely tied to the mining and energy capital expenditure cycle, and this is expected to be in decline for some time.
Not all is wasted, and there are 20 other industry groups to scour through. As I move from left to right, such as screen may lead to discussion, debate and finally, some in-depth research.
In that regard, one interesting idea resulted from Friday’s screen, and has been allocated to a member of the research team’s in-depth analysis. This research will commence by asking the question: does this relatively cheap company also have good prospects over the medium-term?
This post was contributed by a representative of Montgomery Investment Management Pty Limited (AFSL No. 354564). The principal purpose of this post is to provide factual information and not provide financial product advice. Additionally, the information provided is not intended to provide any recommendation or opinion about any financial product. Any commentary and statements of opinion however may contain general advice only that is prepared without taking into account your personal objectives, financial circumstances or needs. Because of this, before acting on any of the information provided, you should always consider its appropriateness in light of your personal objectives, financial circumstances and needs and should consider seeking independent advice from a financial advisor if necessary before making any decisions. This post specifically excludes personal advice.
INVEST WITH MONTGOMERY
I am becoming more familiar with the industrials sector (of which capital goods forms a part) through a training program i am doing with my uni’s investment society. Have to say, there is not much in there personally that seems interesting to me at present, some of the other sub-categories have a few more that seem like they have promise.
Mining, as you say, has seen a tremendous decline in capex which will hurt a great number of these businesses. This appears to be the trend as well which does not bode well.
Can i ask a question Russell, with the industry EV/EBITDA multiples, were they median or average? For the purposes of coming up with various industry specific results from a data set involving individual companies i am trying to decide which one is the best to use for a generic view of the overall industry.
Hi Andrew,
They are the average.
I removed a few outliers such as Freelancer for example which trades on 160x EV/EBITDA.
So if you didn’t want to do that, clean the data, than the median would work for you.
Hi Russell, The one I like from your list is about 40 to 60 million dollars over it’s market cap than I would normally like to pay. If I had just a touch more info an update or something I would pay the extra. It’s moving the right way today ( cheaper. )
Even though industrial stocks have more risk thats also why I like Industrial type of investments ( If you get it right ) they move fast.
Thanks Russell
May I ask why you chose EBITDA estimates for 2016 and not recent figures with more reliability attached?
Cheers
Hi Sam,
I always look 2-3 years out when forecasting financial results. The use of consensus is a quick way to ‘screen’ for ideas using what the market currently expects over the same period.
Cheers Russell