
Would you like P/Es with that?
Recently I penned a post proposing the importance of investing in quality companies with solid growth prospects. The suggestion is based simply on rather basic arithmetic; buy and sell shares on the same (now compressed Price to Earnings Ratio) and the investors Internal Rate of Return (IRR) will equal the Earnings Per Share (EPS) growth rate the company achieves.
For example, acquire the shares of a business, whose EPS is growing at 20 per cent per annum, on a Price Earnings (P/E) multiple of 10 times earnings, and sell them on the same multiple of 10 times, and the investor’s Internal Rate of Return (IRR) will equal the Earnings Per Share (EPS) growth rate, assuming all profits are reinvested by the company rather than paying a dividend.
Price to Earnings Multiples have compressed significantly. Google any long-term chart of P/E multiples and you will discover something, hopefully, quite useful about the behaviour of markets. What I trust you will immediately see is that the P/E ratio swings about quite noticeably. Price is a reflection of popularity and is therefore much more fickle than intrinsic value, which moves far more slowly. As stocks become more or less popular the P/E ratio changes to reflect the shift in sentiment. All else being equal when stocks become more popular the P/E increases. When stocks become less popular, the P/E declines.
As Ben Graham and Warren Buffet observed, in the short run the market is a voting machine, and there is not an IQ test required to vote. Consequently, the shift in sentiment is frequent and can be extreme.
Before a brief examination of the arithmetic that makes the current market sell-off just a little off mouthwatering I want to show US 10 Year Treasury bond rates through the ages.
Figure 1. 60 years of US 10-year Treasury bond yields
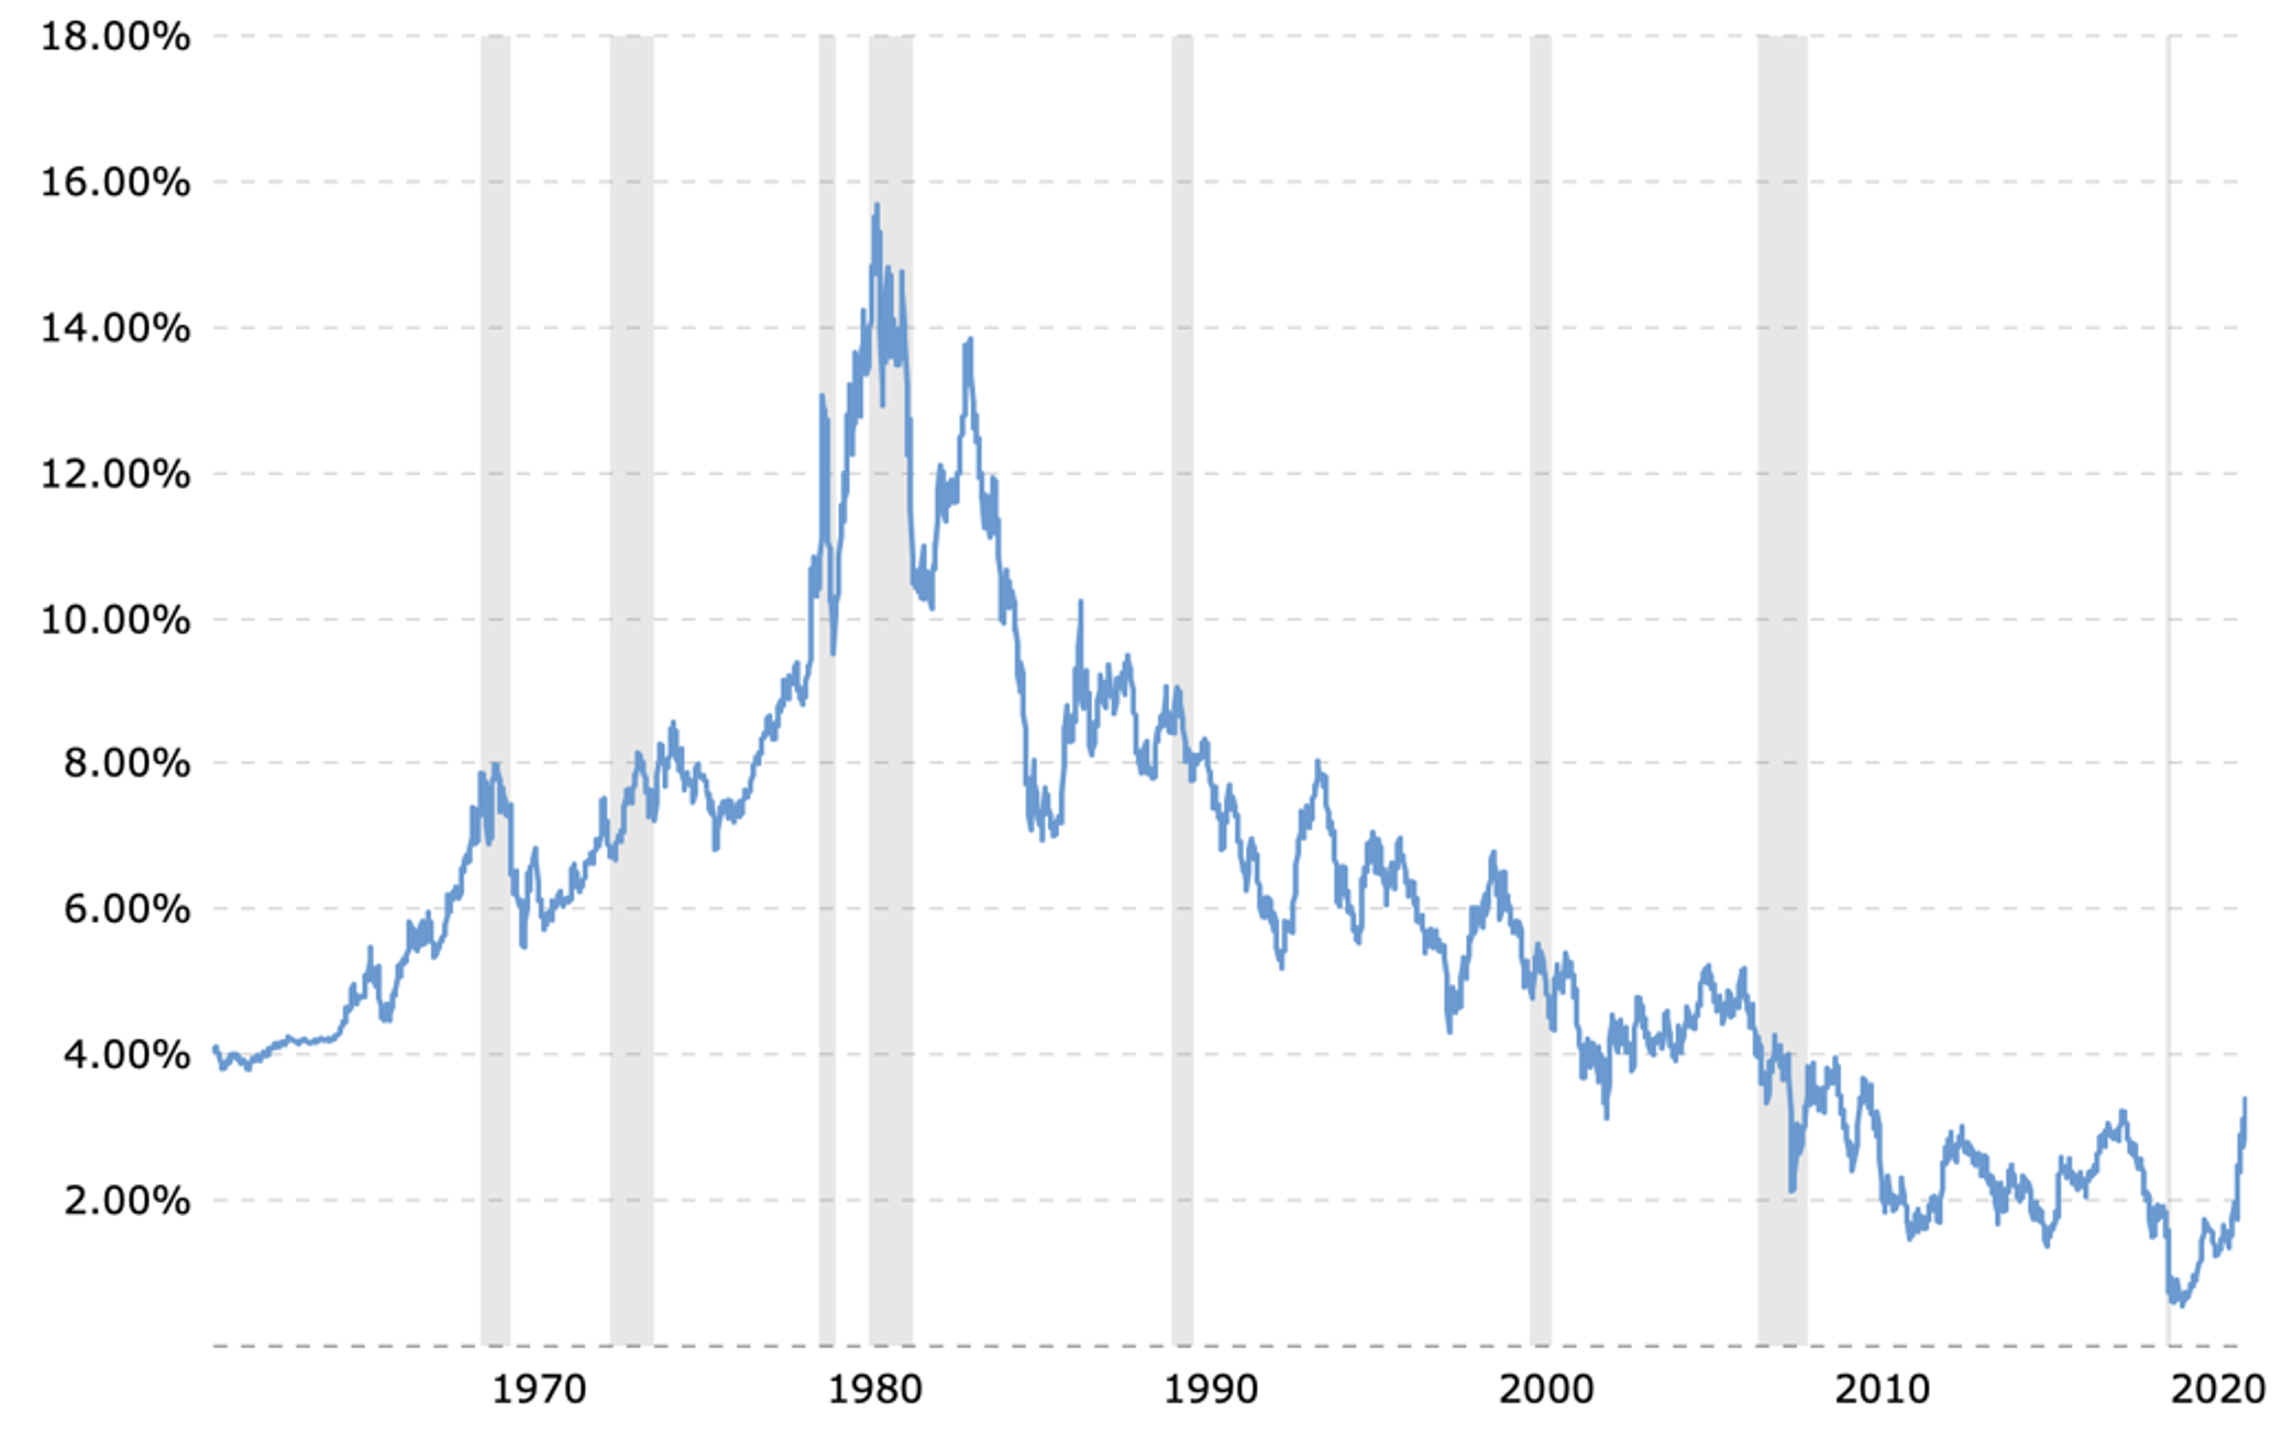
From 1981 to 2020, US 10-year bond rates steadily and consistently declined. For 39 years yields declined from a peak of 15.7 per cent to 0.60 per cent. And now bond rates are rising again.
Because bond rates and stock earnings yields (the inverse of the P/E ratio) are inextricably linked, it is worth examining what happened to P/E ratios during the period US 10-year Treasury yields rose.
From 1962 to 1981, bond rates almost quadrupled, from about four per cent to 15.7 per cent.
Figure 2. S&P500 PE chart 1962-1981 (trailing 12 months, log scale)
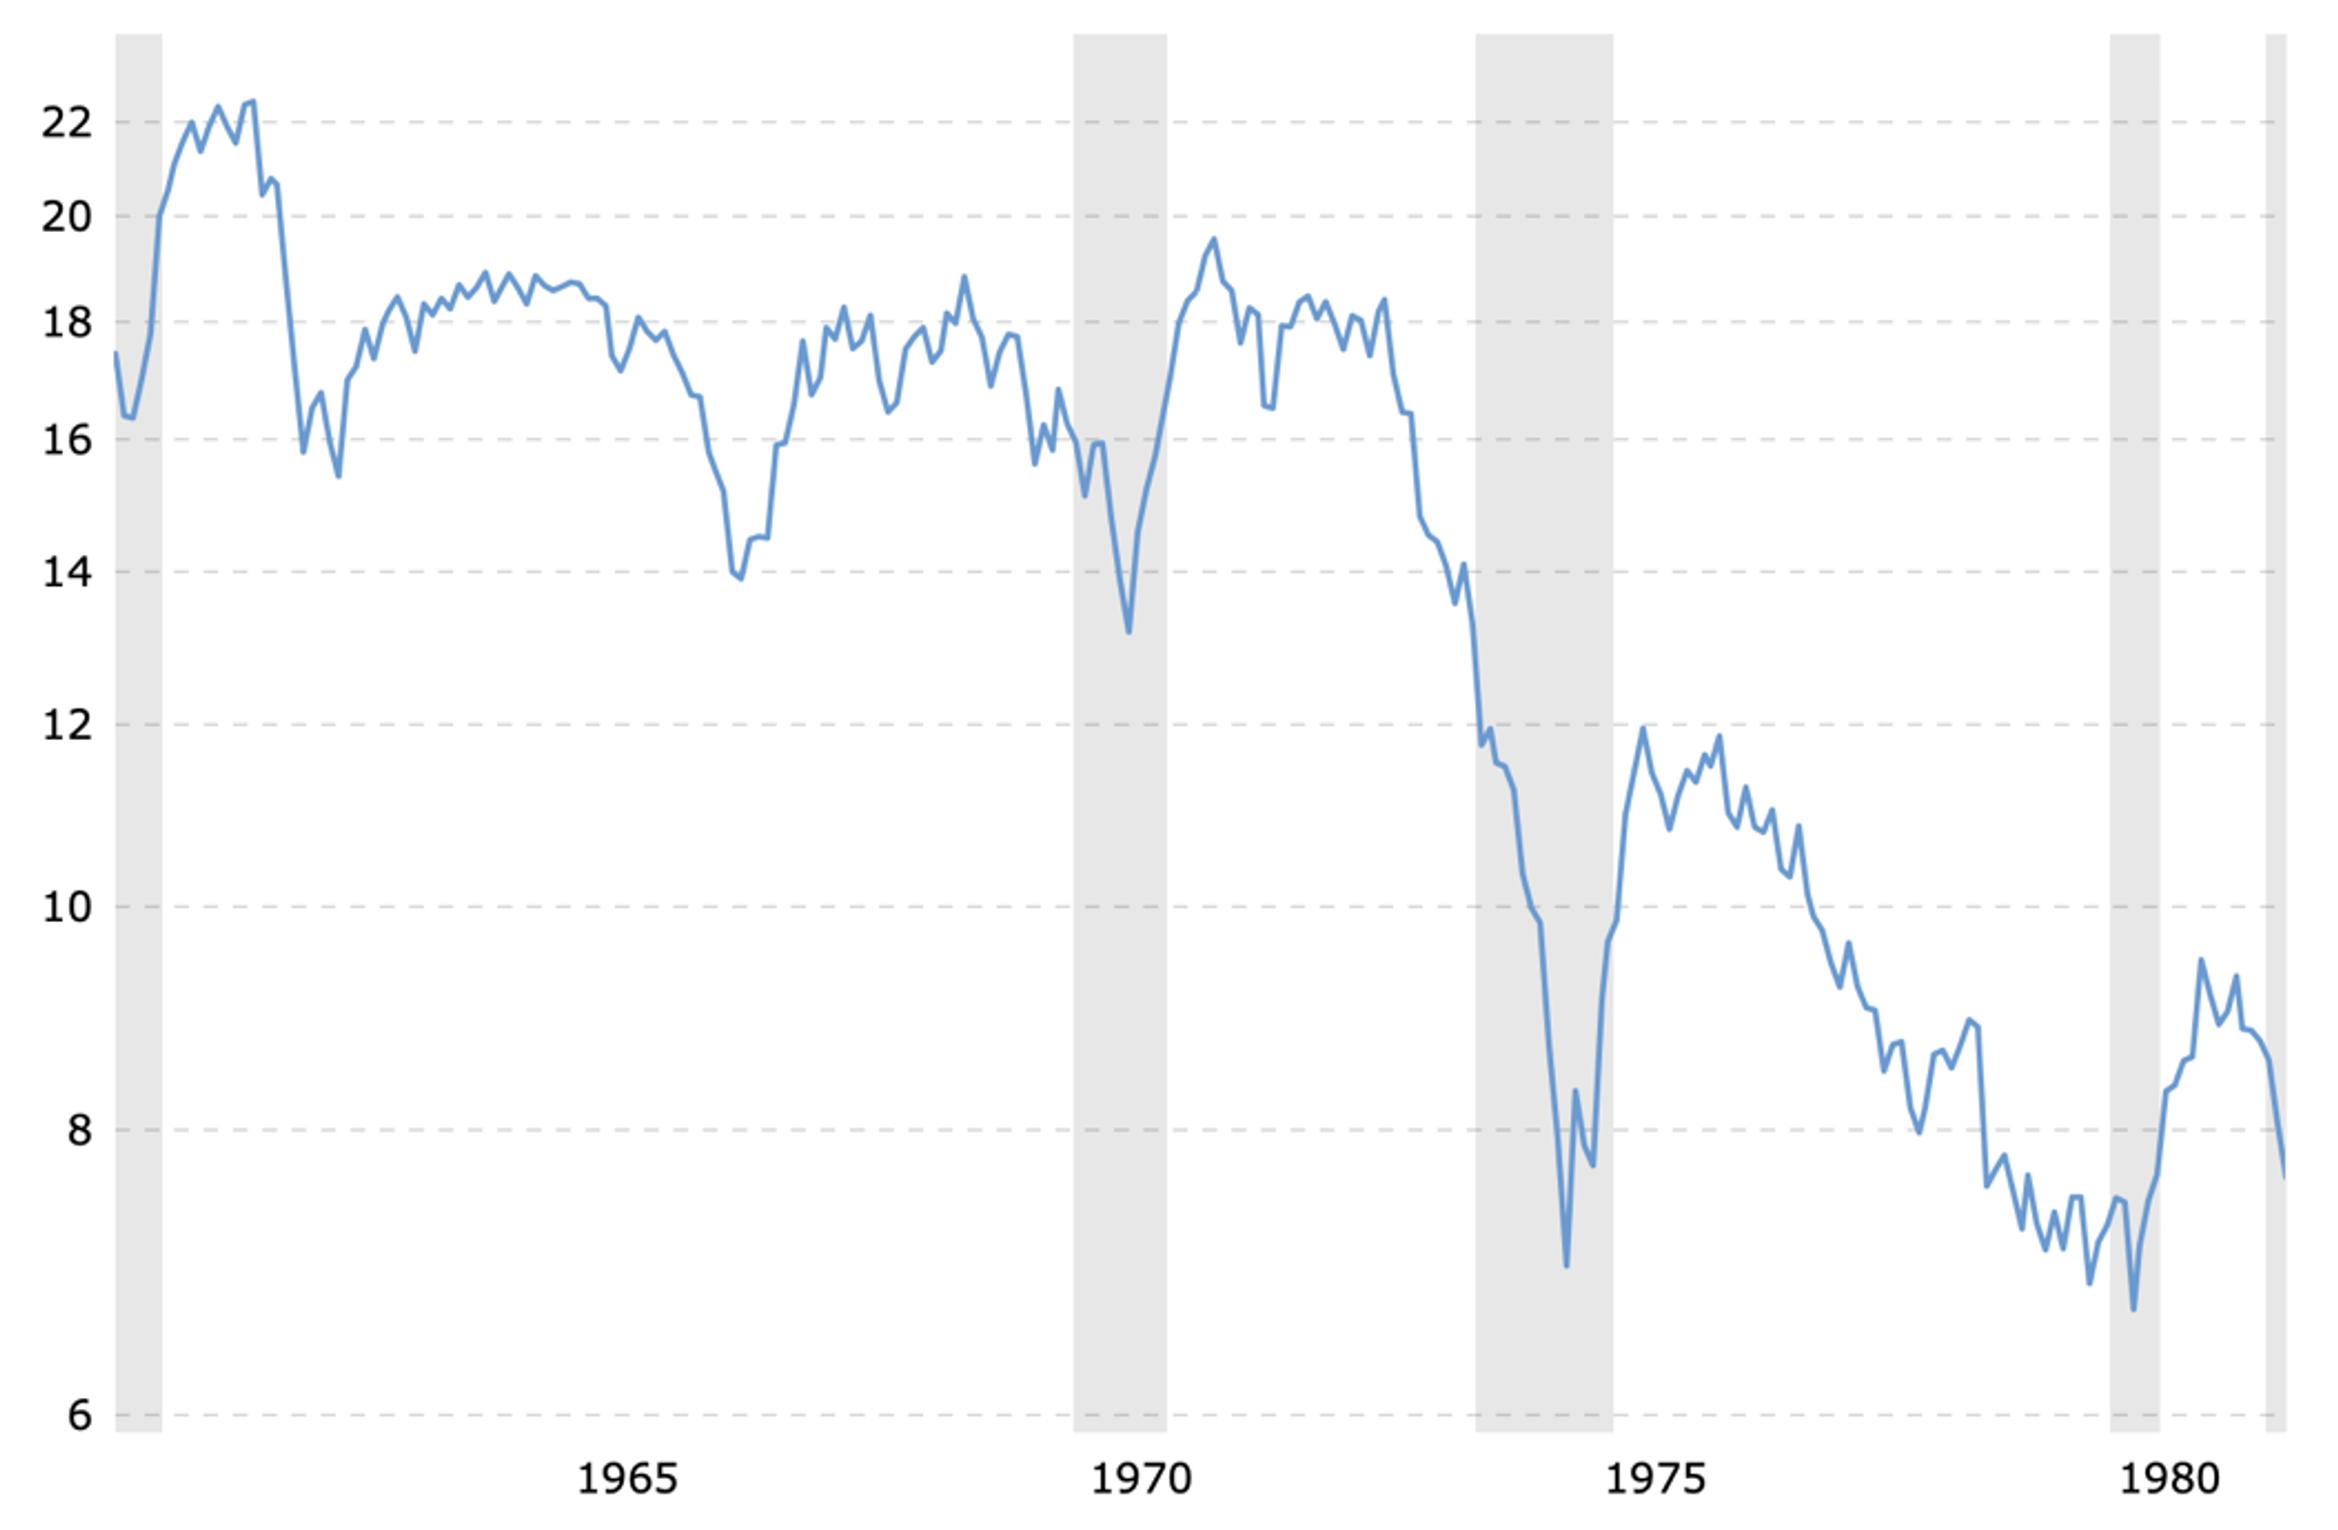
Figure 2. illustrates the trailing 12-month P/E ratio for the S&P500 index, during the same period the bond yield quadrupled, between 1962 and 1981. Over that 19-year period bond yields quadrupled, P/E ratios declined. But not all that decline can be attributed to a loss of popularity for equities. The P/E ratio is part Price and part Earnings.
Figure 3. S&P500 and earnings 1962-1981
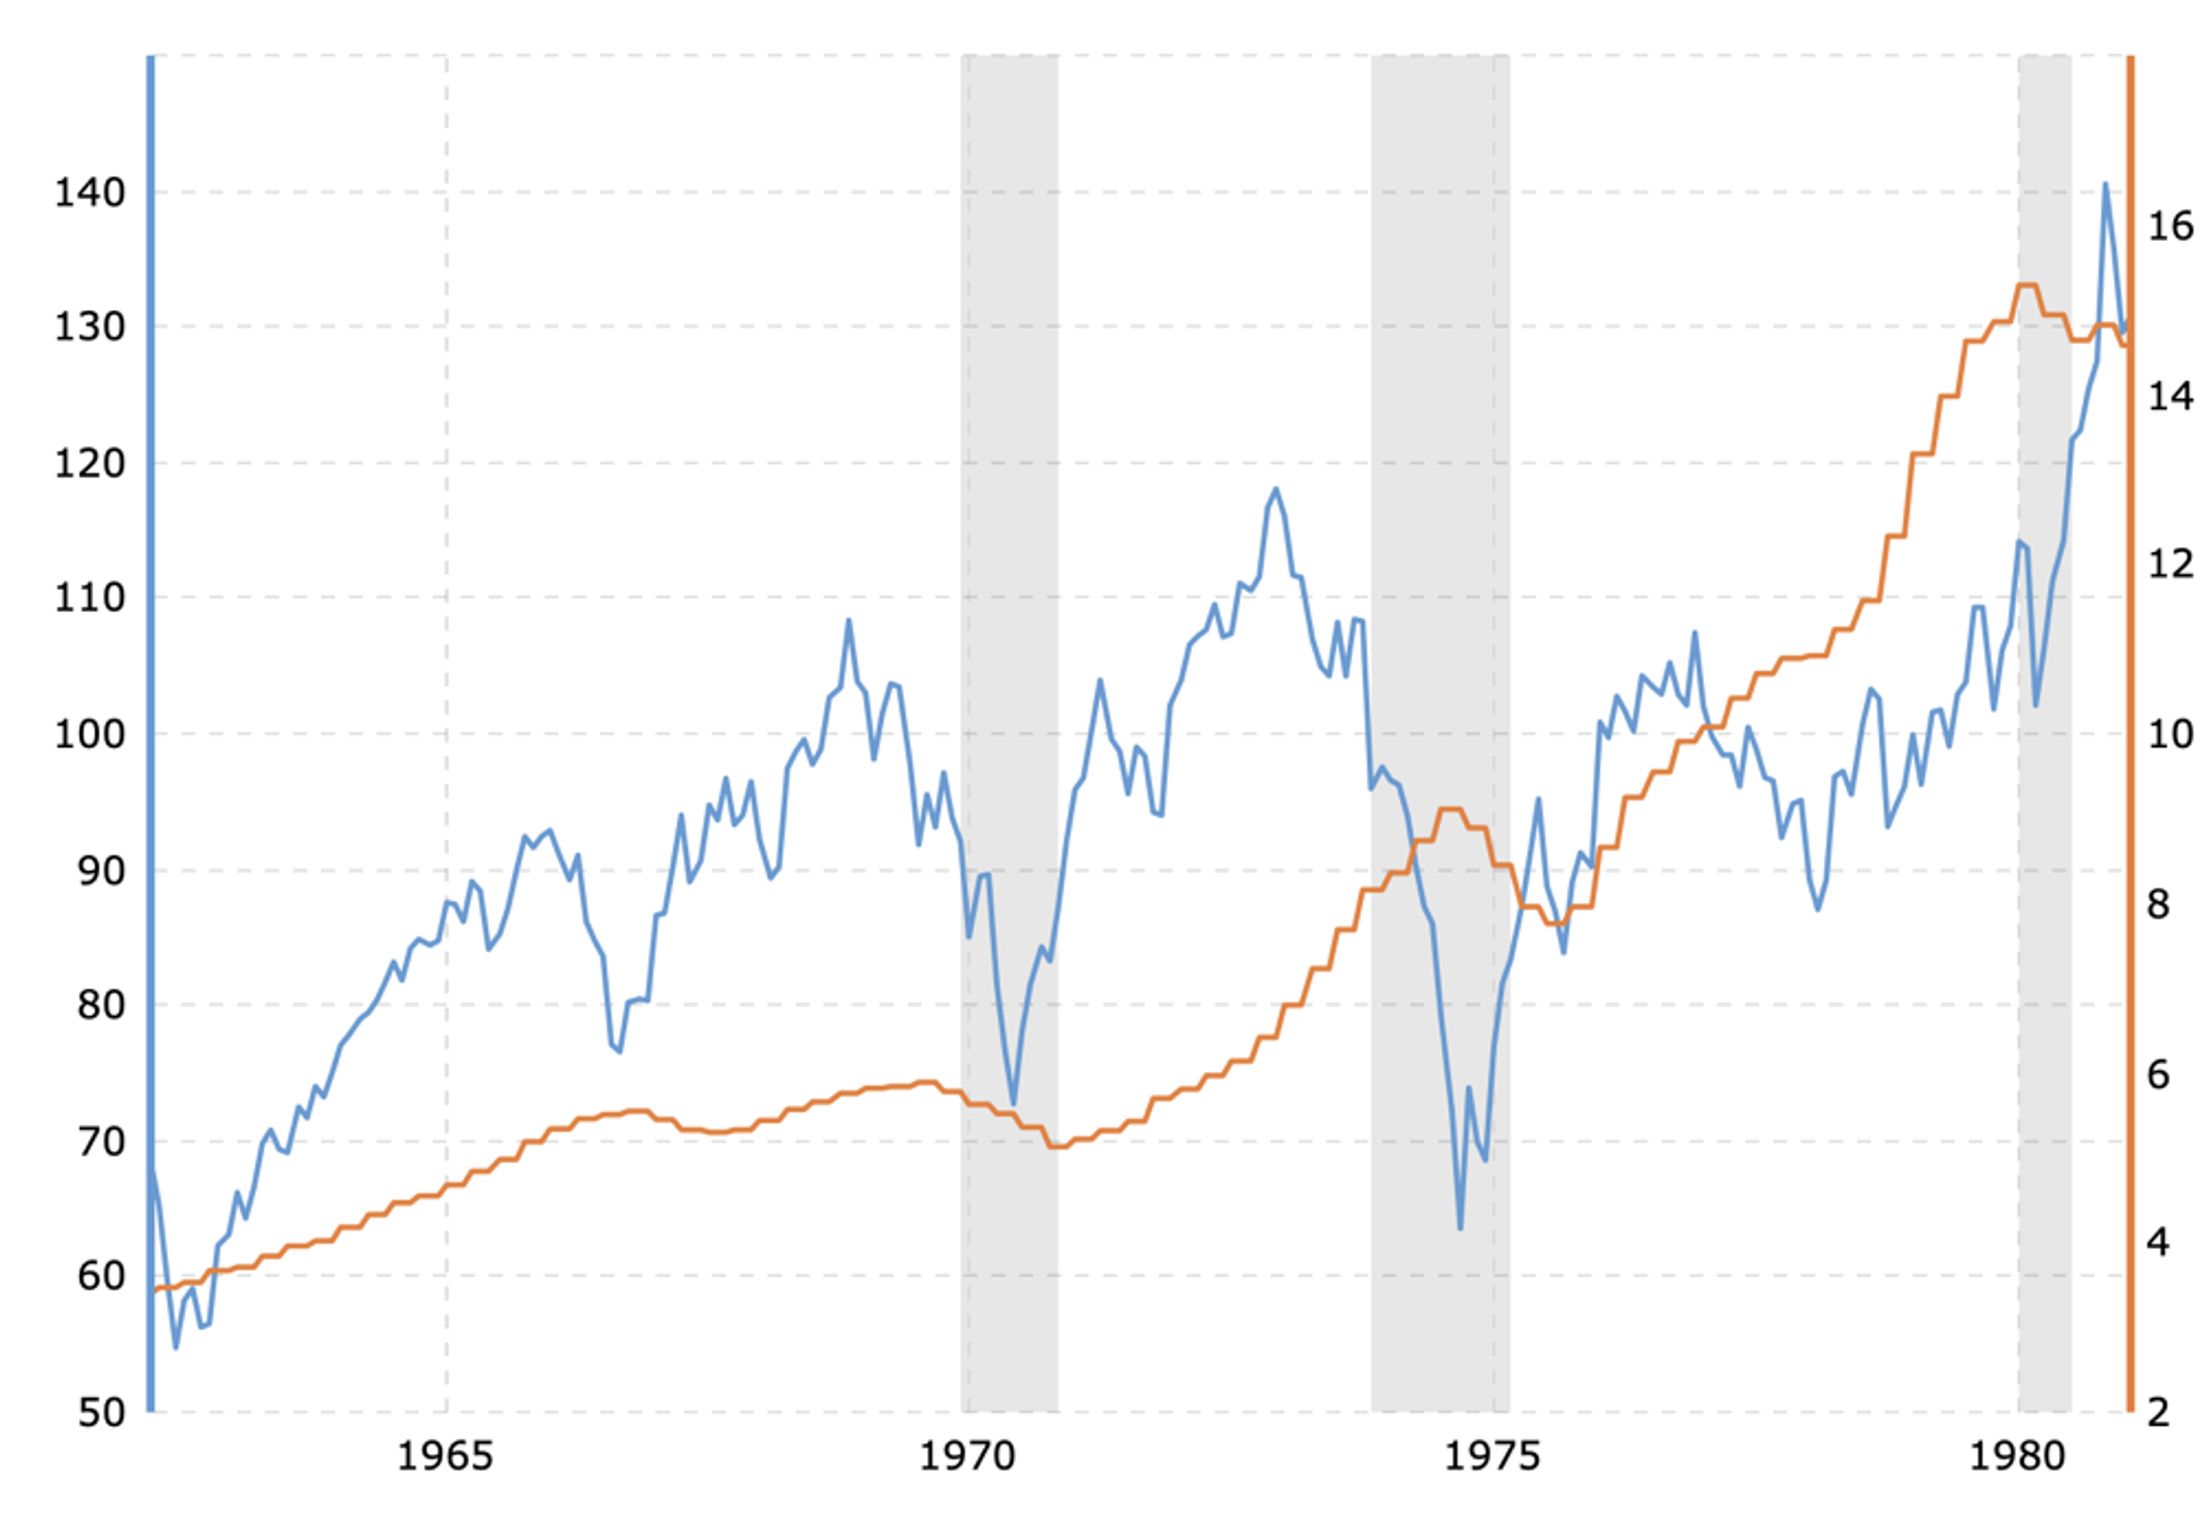
Over the period in question, as bond yields rose materially, earnings for S&P500 companies grew fourfold, while the index merely doubled.
The first observation to make is earnings growth is part of the reason for the P/E compression. Earnings (the ‘E’ in the P/E) grew but prices (The ‘P’ in the P/E) didn’t grow by as much. Consequently, the P/E fell. Part of the decline in P/Es was waning popularity and the other part was rising earnings.
The P/E compression over the period can also be seen as the reason the S&P500 did not grow at the same rate as earnings. A doubling of one’s funds over 19 years is equivalent to just 3.7 per cent per annum. Historically, equity returns are lower, without exception, during periods of rising bond rates and the S&P500’s 3.7 per cent annual return over 19 years reflects, if not reinforces, that finding.
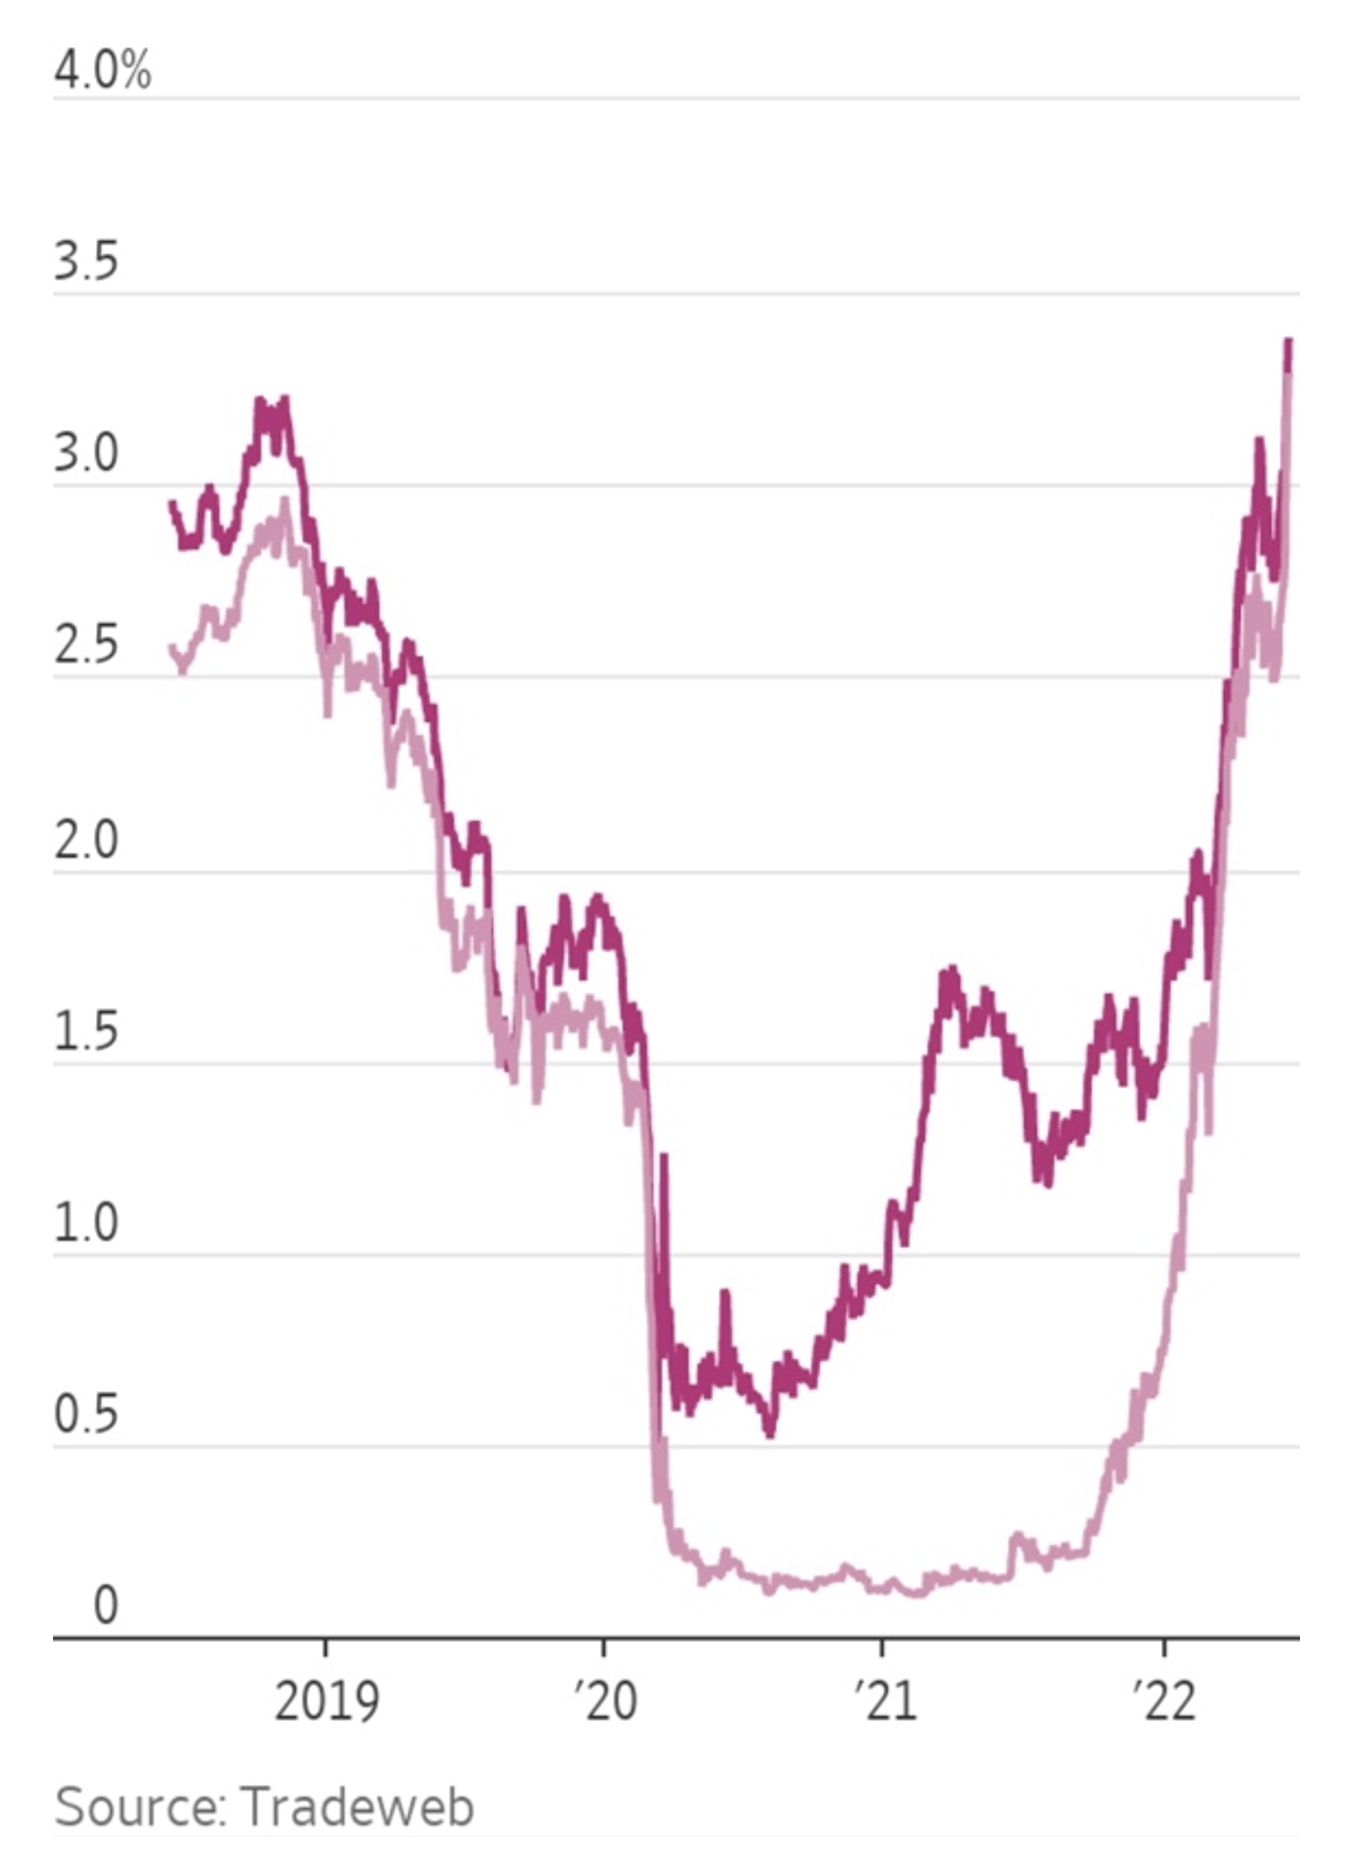
I cannot say whether bond rates will continue rising over the next 19 years, but it is important to acknowledge US 10-year Treasury bond rates have already sextupled since their 2020 lows (Figure 4.) That is the steepest rise in yields since the 1980s.
Figure 4. Recent US Two-year and 10-year bond yields
Tying all of these threads together, we find P/E ratios have compressed meaningfully thanks to the very steep increase in bond yields recently. We also know buying and selling a stock on the same P/E will produce a return equivalent to the earnings growth rate, if the underlying company’s dividend payout ratio is zero. And finally, we know during periods of rising bond yields, equity index returns should be lower than the earnings growth rate, which suggests the identification of company with faster growing earnings becomes primary.
With all that in mind, our global investment partner Polen Capital’s matrix (Table 1.), comparing P/E compression and expansion to five-year earnings growth becomes a potentially essential framework for equity investors to navigate the next year or two.
The table here is illustrating the investor’s returns for a variety of scenarios including a further compression in P/E ratios, an expansion of P/E ratios, and the EPS growth rates required to produced acceptable, and even attractive, rates of return.
Table 1. Annualised return scenarios
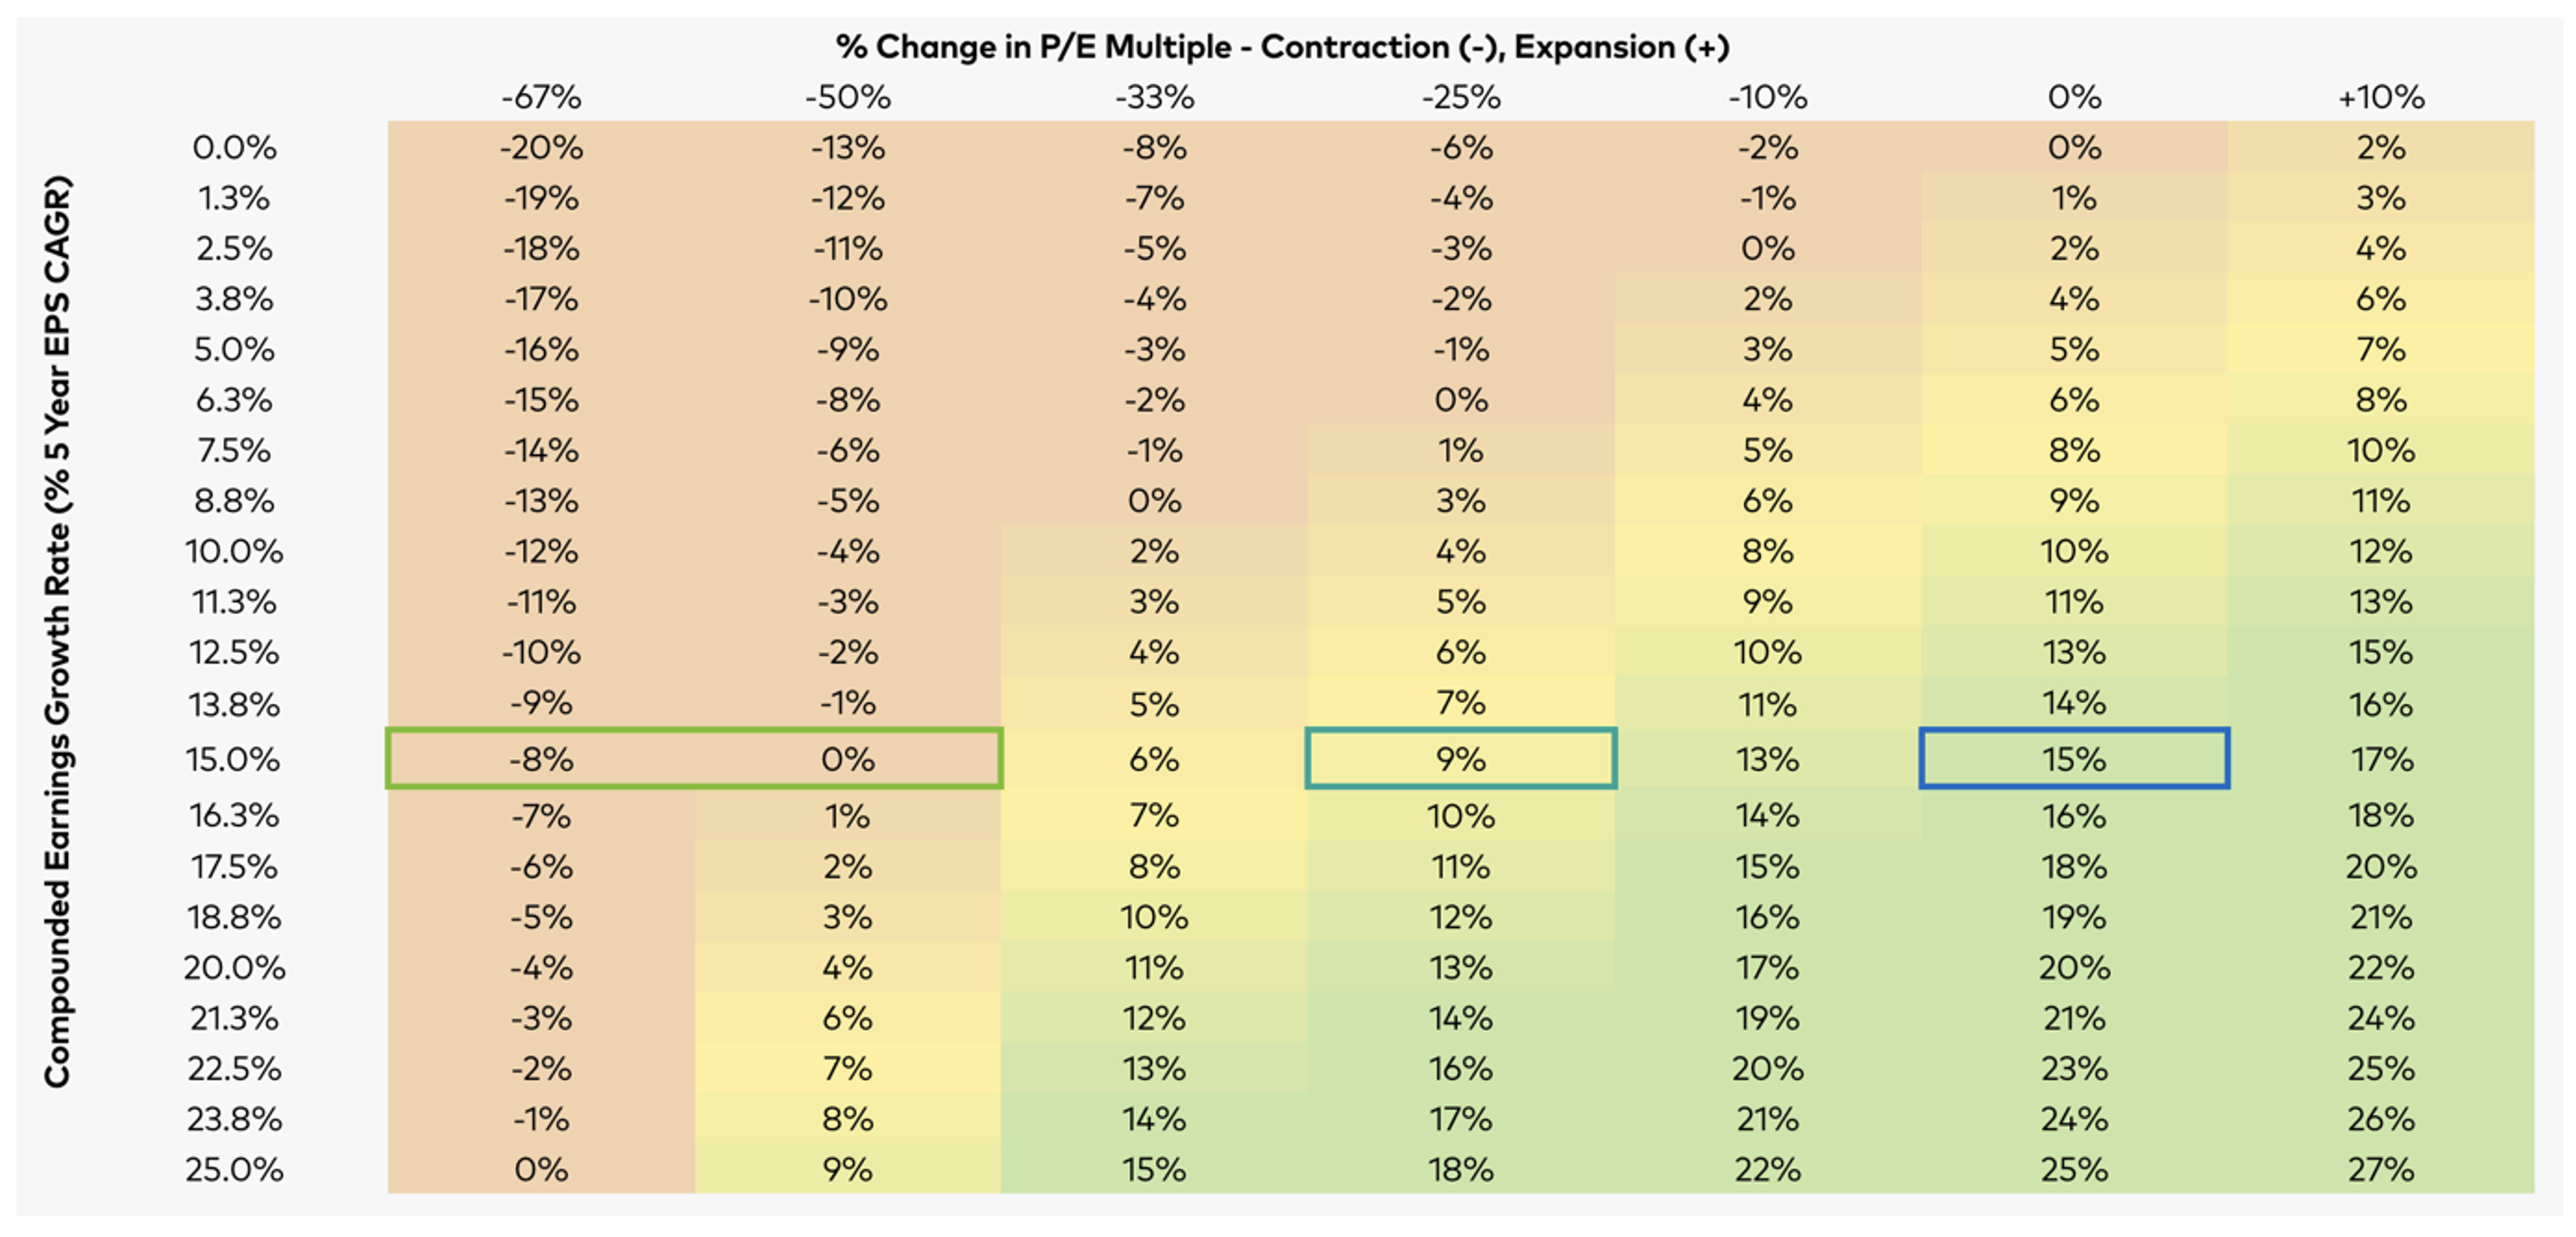
Table 1. Demonstrates, for example, the return for a hypothetical company generating 15 per cent compounded EPS growth over five years (left hand axis with 15 per cent row highlighted). If there is no change in the P/E ratio (0 per cent column), the expected return matches the EPS growth rate, and the investor receives 15 per cent per annum (assuming a zero percent dividend payout policy).
If a company with the same 15 per cent growth rate is selected but over the investment period of five years, the P/E contracts by 25 per cent (-25 per cent column), the investor will receive a nine per cent return.
And finally, if the same 15 per cent earnings growth company is selected and the P/E ratio falls by 50 per cent during the period, only then will the investor receive no return.
Of course, if the P/E ratio compresses by fifty per cent early and stays there, the investor will need to hold the company’s shares for the period to ensure the earnings growth offsets the P/E decline and produces a zero return. This however is an unlikely scenario as we have already seen P/E ratios swing frequently to reflect the bipolar nature of sentiment. Over five years, it is possible, if not likely, the P/E ratio will recover somewhat.
As Table 1. attests, even in an environment of rising bond yields, if investors can select companies whose earnings are likely to grow over the next five years at least by 20 per cent (and there are plenty of companies we believe can achieve that here in Australia and globally), they can still generate double digit returns, even if P/E ratios compress by another third. Of course, if P/Es expand again, which history says they eventually will, investors can enjoy even higher returns.
Investors are wise to be concerned about the effects on P/E ratios from rising bond yields, but even amid such conditions, investing in quality growth companies offers the potential to generate attractive returns. And given we have already seen a sextupling of yields, it is possible a high degree of the P/E compression has occurred. Ultimately however, as we have demonstrated, it all comes back to investing in quality companies generating profitable growth.
Roger Montgomery is the Founder and Chairman of Montgomery Investment Management. Roger has over three decades of experience in funds management and related activities, including equities analysis, equity and derivatives strategy, trading and stockbroking. Prior to establishing Montgomery, Roger held positions at Ord Minnett Jardine Fleming, BT (Australia) Limited and Merrill Lynch.
He is also author of best-selling investment guide-book for the stock market, Value.able – how to value the best stocks and buy them for less than they are worth.
Roger appears regularly on television and radio, and in the press, including ABC radio and TV, The Australian and Ausbiz. View upcoming media appearances.
This post was contributed by a representative of Montgomery Investment Management Pty Limited (AFSL No. 354564). The principal purpose of this post is to provide factual information and not provide financial product advice. Additionally, the information provided is not intended to provide any recommendation or opinion about any financial product. Any commentary and statements of opinion however may contain general advice only that is prepared without taking into account your personal objectives, financial circumstances or needs. Because of this, before acting on any of the information provided, you should always consider its appropriateness in light of your personal objectives, financial circumstances and needs and should consider seeking independent advice from a financial advisor if necessary before making any decisions. This post specifically excludes personal advice.