Why rising interest rates have sent the Dow south
Over the last six months, the US Dow Jones Industrial Average has soared 20 per cent to 26,500. But over the past week it has shed over 2,000 points or 8 per cent. The reason: a surge in yields on US Ten Year Government Treasury Bonds, which hit a four-year high of 2.86 per cent. With interest rates climbing, it’s time for investors to tread more warily.
The aggressive quantitative easing policies continue to be pursued by the European Central Bank (Ten Year Bonds in Germany: 0.76 per cent, France: 1.01 per cent, Spain: 1.46 per cent, Portugal 1.99 per cent and Italy 2.04 per cent) and the Bank of Japan (Ten Year Bonds in Japan: 0.08 per cent) and this has corrupted investors’ appreciation of risk.
The dilemma we have is associated with synchronised global growth and US corporate tax cuts, meaning markets are facing a tricky balancing act with rising inflationary expectations.
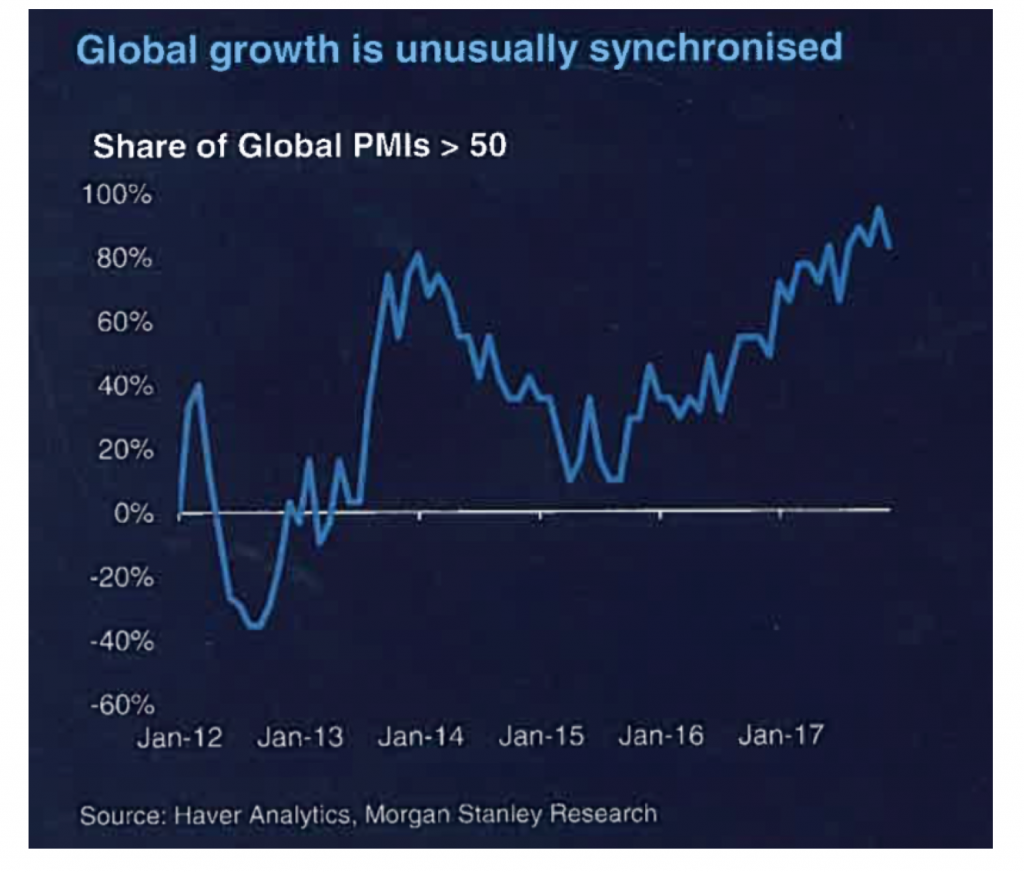
The Purchasing Managers Index (PMI), for example, is an indicator of the economic health of the manufacturing sector. It is based on five series – new orders, inventory levels, production, supplier deliveries and the employment environment. A PMI of more than 50 represents expansion of the manufacturing sector, when compared to the previous month. A PMI reading under 50 represents contraction. According to Morgan Stanley, the share of Global PMIs greater than 50 approximates 90 per cent, which is a post GFC high.
I would now like to try and explain why the 1.5 per cent increase in US Ten Year Government Treasury Bonds from 1.36 per cent to 2.86 per cent over the past eighteen months is detrimental to valuations. Let’s assume I invest $250 in a high quality corporate bond, where I receive $10 per annum in interest and my principal back in ten years (corresponding to an annual yield of 4.0 per cent).
To compare investments with cashflows spread over time, it is normal to discount the cashflows back to a current value to account for the “time-value of money” effect. Changing risk-free interest rates (which we assume US Government interest rates represents) changes the current value of a determined set of cashflows as cash received long into the future is worth less if discounted back to today at a higher interest rate.
The table below looks at the Net Present Value of the ten X $10 coupon payments and assumes a $250 principal repayment at the end of ten years.
Assuming risk-free interest rates of 1.36 per cent, the net present value of the $100.00 of total coupon payments is $92.91. However, assuming risk-free interest rates rise to 2.86 per cent, the Net Present Value of the $100.00 of total coupon payments declines by $6.99 or 7.5 per cent from $92.91 to $85.91. Further, the Net Present Value of the $250 principal repayment has declined by $29.84 or 13.7 per cent from $218.41 (at 1.36 per cent) to $188.57 (at 2.86 per cent).
The current value of the coupon payments ($100) plus the principal repayment ($250) has declined by $36.83 or 11.8 per cent from $311.32 to $274.48 due to the increase in the risk-free interest rate. In other words, the high quality corporate bond yielding 4.0 per cent per annum for ten years is now worth about 11.8 per cent less than it was before interest rates rose by 1.5 per cent.
In theory, the same calculation is applicable to share prices but for simplicity I have used a corporate bond example as the cashflows and life-length of a bond are pre-determined, whereas dividends (and earnings) are much more variable and harder to predict.
| NPV of High Quality Corporate Bond with the 1.5% increase in Ten Year Bonds | |||||
| Year | Coupon | NPV at 1.36% | NPV at 2.86% | Change (%) | Change ($) |
| 1 | 10 | 9.87 | 9.72 | -1.5% | |
| 2 | 10 | 9.73 | 9.45 | -2.9% | |
| 3 | 10 | 9.60 | 9.19 | -4.3% | |
| 4 | 10 | 9.47 | 8.93 | -5.7% | |
| 5 | 10 | 9.35 | 8.68 | -7.1% | |
| 6 | 10 | 9.22 | 8.44 | -8.4% | |
| 7 | 10 | 9.10 | 8.21 | -9.8% | |
| 8 | 10 | 8.98 | 7.98 | -11.1% | |
| 9 | 10 | 8.86 | 7.76 | -12.4% | |
| 10 | 10 | 8.74 | 7.54 | -13.7% | |
| Coupon | $100.00 | 92.91 | 85.91 | -7.5% | 6.99 |
| (at 4% p.a.) | |||||
| Principal | $250.00 | 218.41 | 188.57 | -13.7% | 29.84 |
| Total | $350.00 | 311.32 | 274.49 | -11.8% | 36.83 |
From a sharemarket perspective, the question is – relative to expectations – has earnings growth picked up enough to counteract the negative ramifications of rising interest rates? Hence, the tricky balancing act!
Over the last six months, the US Dow Jones Industrial Average has soared 20% to 26,500. But over the past week it has shed over 2,000 points or 8%. What is the reason? Share on X
What do you think to the analysis of John Adams and his seven signs we are all headed for Armageddon ? He mentions the yield curve and all the usual favourites (household debt, falling savings and low interest rates).
Hi Chris, I actually hadn’t heard of John Adams, however its hard to argue with his “signs” – record household debt, falling Australian household savings; continued low Australian interest rates; growing Australian housing bubble; continued increase in household debt; major international asset bubbles keep growing; increasing inflation; tightening monetary policy and rising global interest rates. The first five signs have been around for some years, and the final three are now more prevalent. With elevated asset valuations, I feel the markets will likely experience much greater volatility in 2018.
You’re too modest David, so I’ll do it for you.
Well done on your 19 December article “Keep an eye on US ten-year bond yields in 2018”.
Thanks Phil. However, there are a number of experts, who believe US ten year bonds will rally (decline in yield) to sub 2.0 per cent (Morgan Stanley) later in 2018, while Albert Edwards, Global Strategist of Societe Generale is calling them to sub-zero!
The market is a great adjudicator. In less than 11 months we’ll know what happened in 2018.
Hi David, Why do they think the yields will decline to sub zero?
Hi Michael, Albert Edwards believes the US is in another “unsustainable credit bubble” that will inevitably blow up with rooky Fed Chairman (Jerome Powell) in place. When the bubbles in both corporate and housing debt break, the US and Europe would “flip” over into outright deflation and Edwards argues the US ten year bond yield will converge with Japan and Germany – and they were both negative in yield terms in mid-2017.
good explanation, thanks