
Where to find growth in 2022
With the first reporting season for the year now upon us, investors should have a good idea of what to expect in 2022. With the worst of the pandemic (hopefully) behind us, the end of lockdowns and border closures, one thing we are likely to see this year is a changing of the guard on the ASX. That’s certainly reflected in the estimated earnings per share growth for each sector, released by JP Morgan.
If you look back at the ASX200 earnings revisions for the last five years, shown in the chart below, you can see a very sharp and steep downturn when the pandemic first kicked in during March 2020. This followed a sustained 11 month period of upgrades when various stimulus packages kicked in and it became obvious that the market had taken an overly bearish view of the actual impact on corporate profitability. When the Delta variant started spreading in NSW and VIC and later Omicron which led to further lockdowns and various logistics issues like rapidly increasing freight rates, we again started to see downgrades to estimates for a couple of months. Recently, we have again seen some upgrades as it has become clear that the Omicron variant is less damaging than expected.
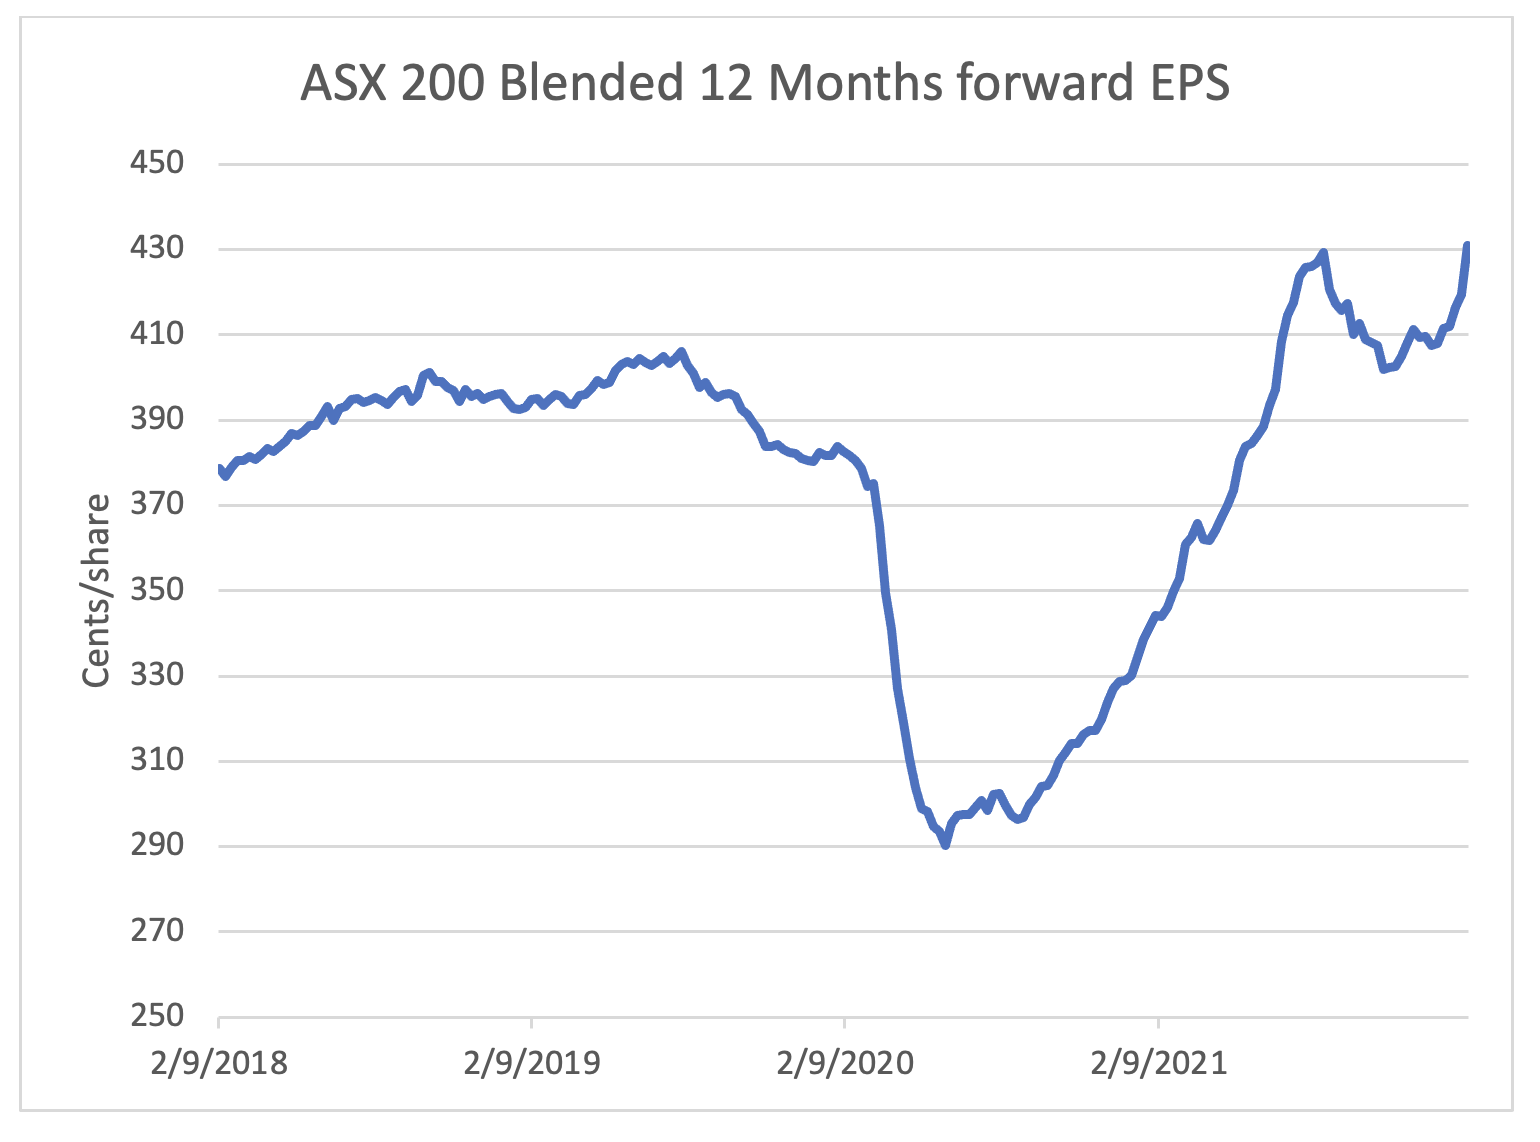
In total, this has resulted in the 12 months forward EPS estimate, after having initially been cut by close to 30 per cent, now having more than recovered and sitting at about 5 per cent above the pre-pandemic peak from late 2019:
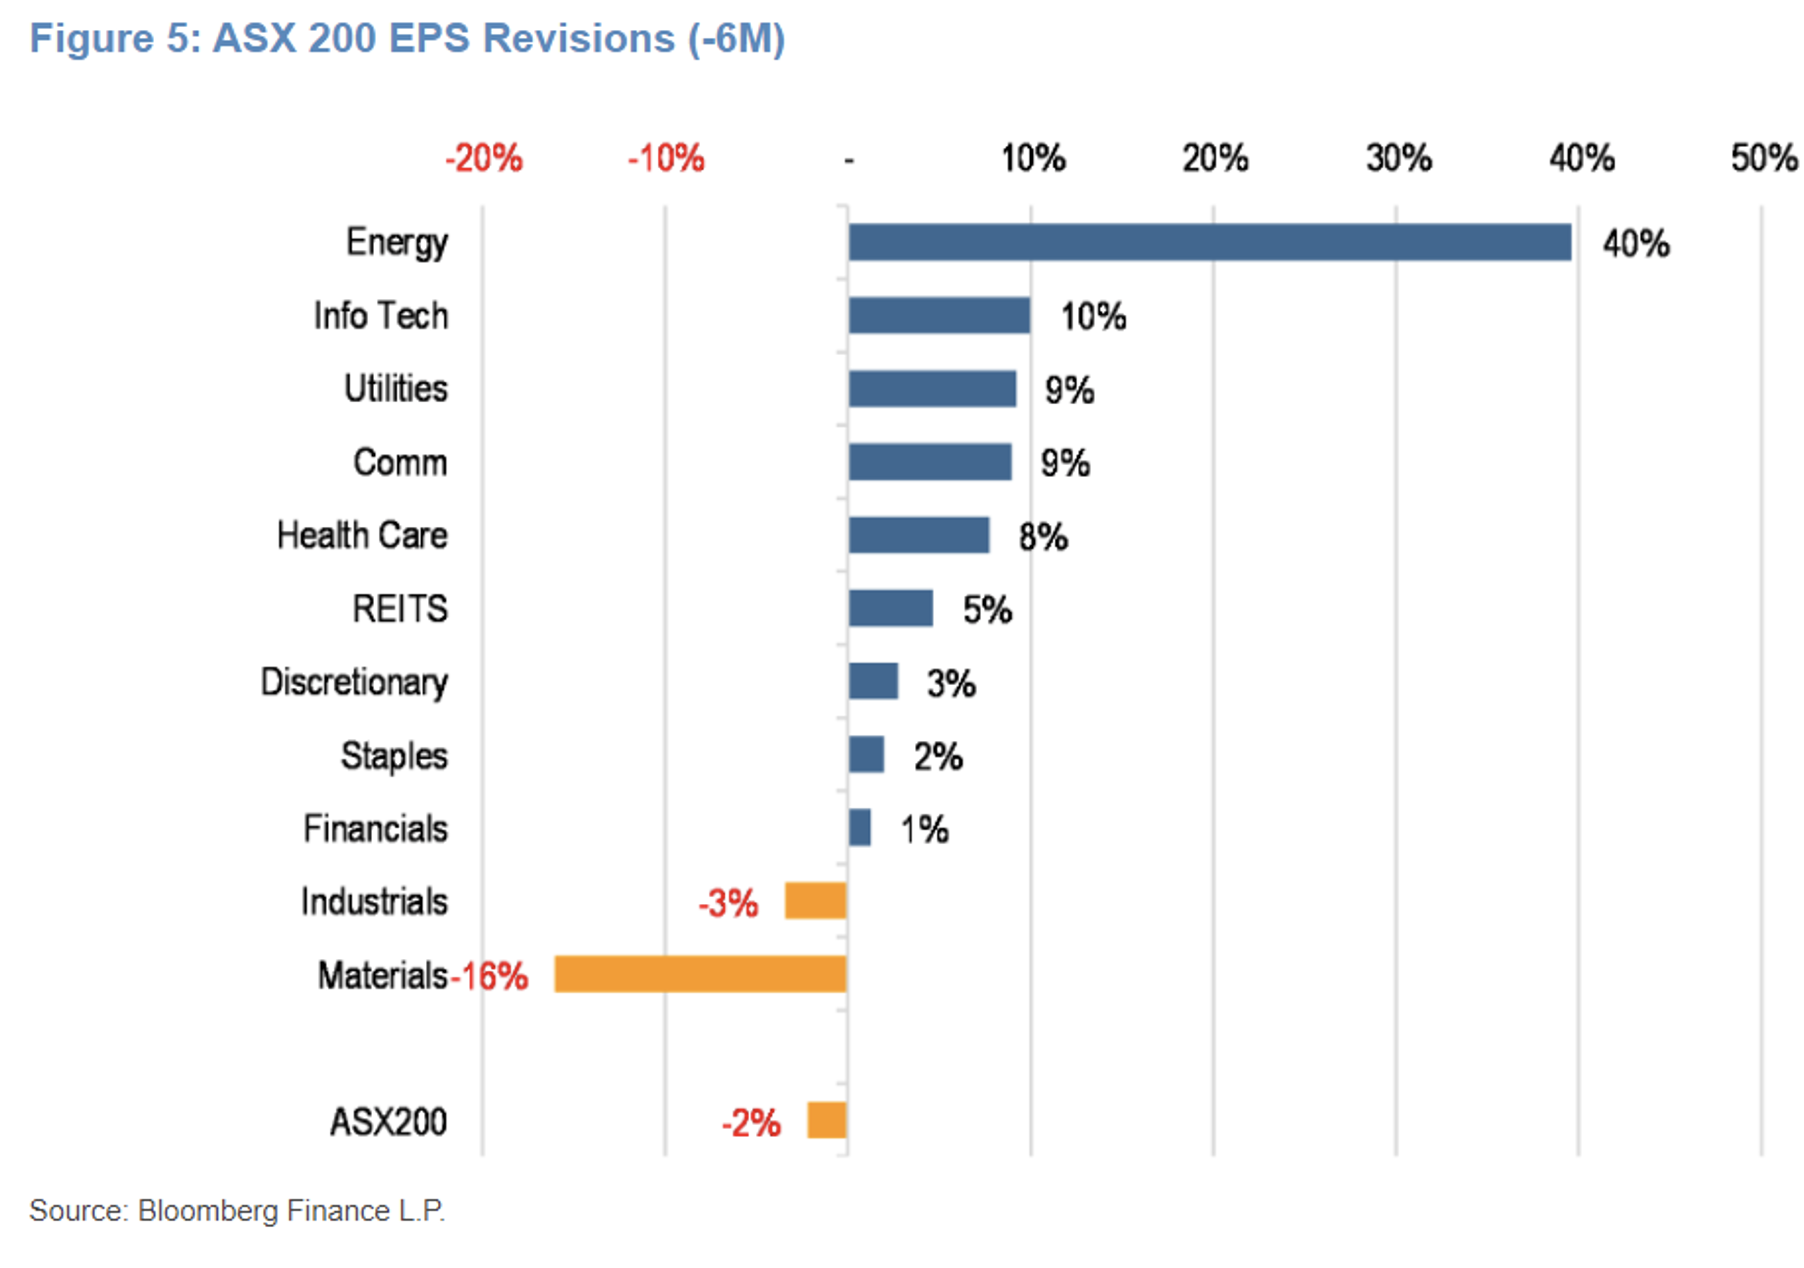
If we look at what sectors have been driving the changes in forward estimates during the last six months, we can see two massive outliers in Energy, which has seen very big upgrades on back of the rising oil and gas prices worldwide, and large downgrades for the Materials sector where the falling Iron Ore price has overshadowed rising or stable prices in most other commodities:
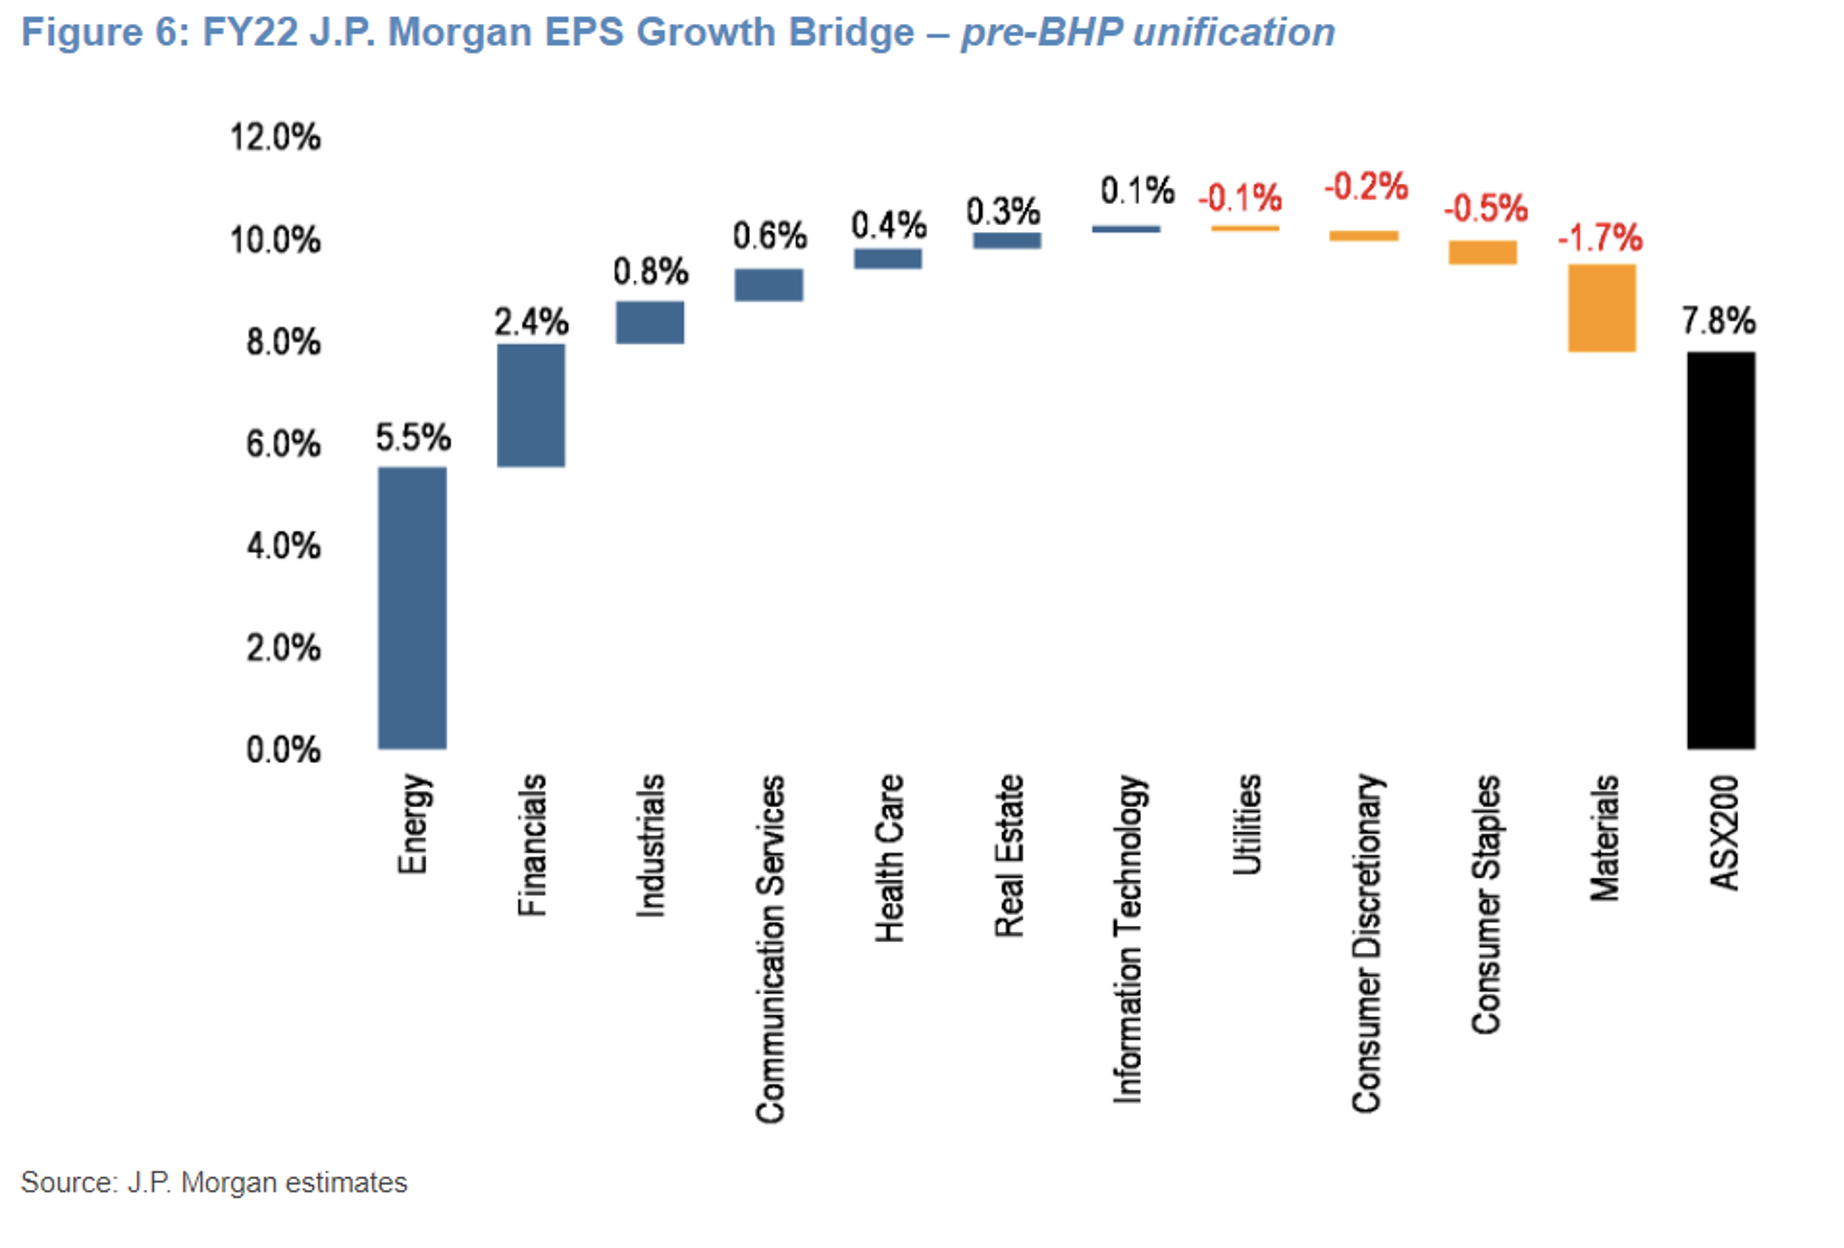
Unfortunately, Bloomberg and other data sources are not good at tracking half year estimates so in the charts below, which I have borrowed from JP Morgan, we are looking at projected earnings growth for the full year 2022 (end of June).
If we look at the total projected EPS growth on a steady index weight basis, it is 7.8 per cent which is a decent number given where interest rates are:
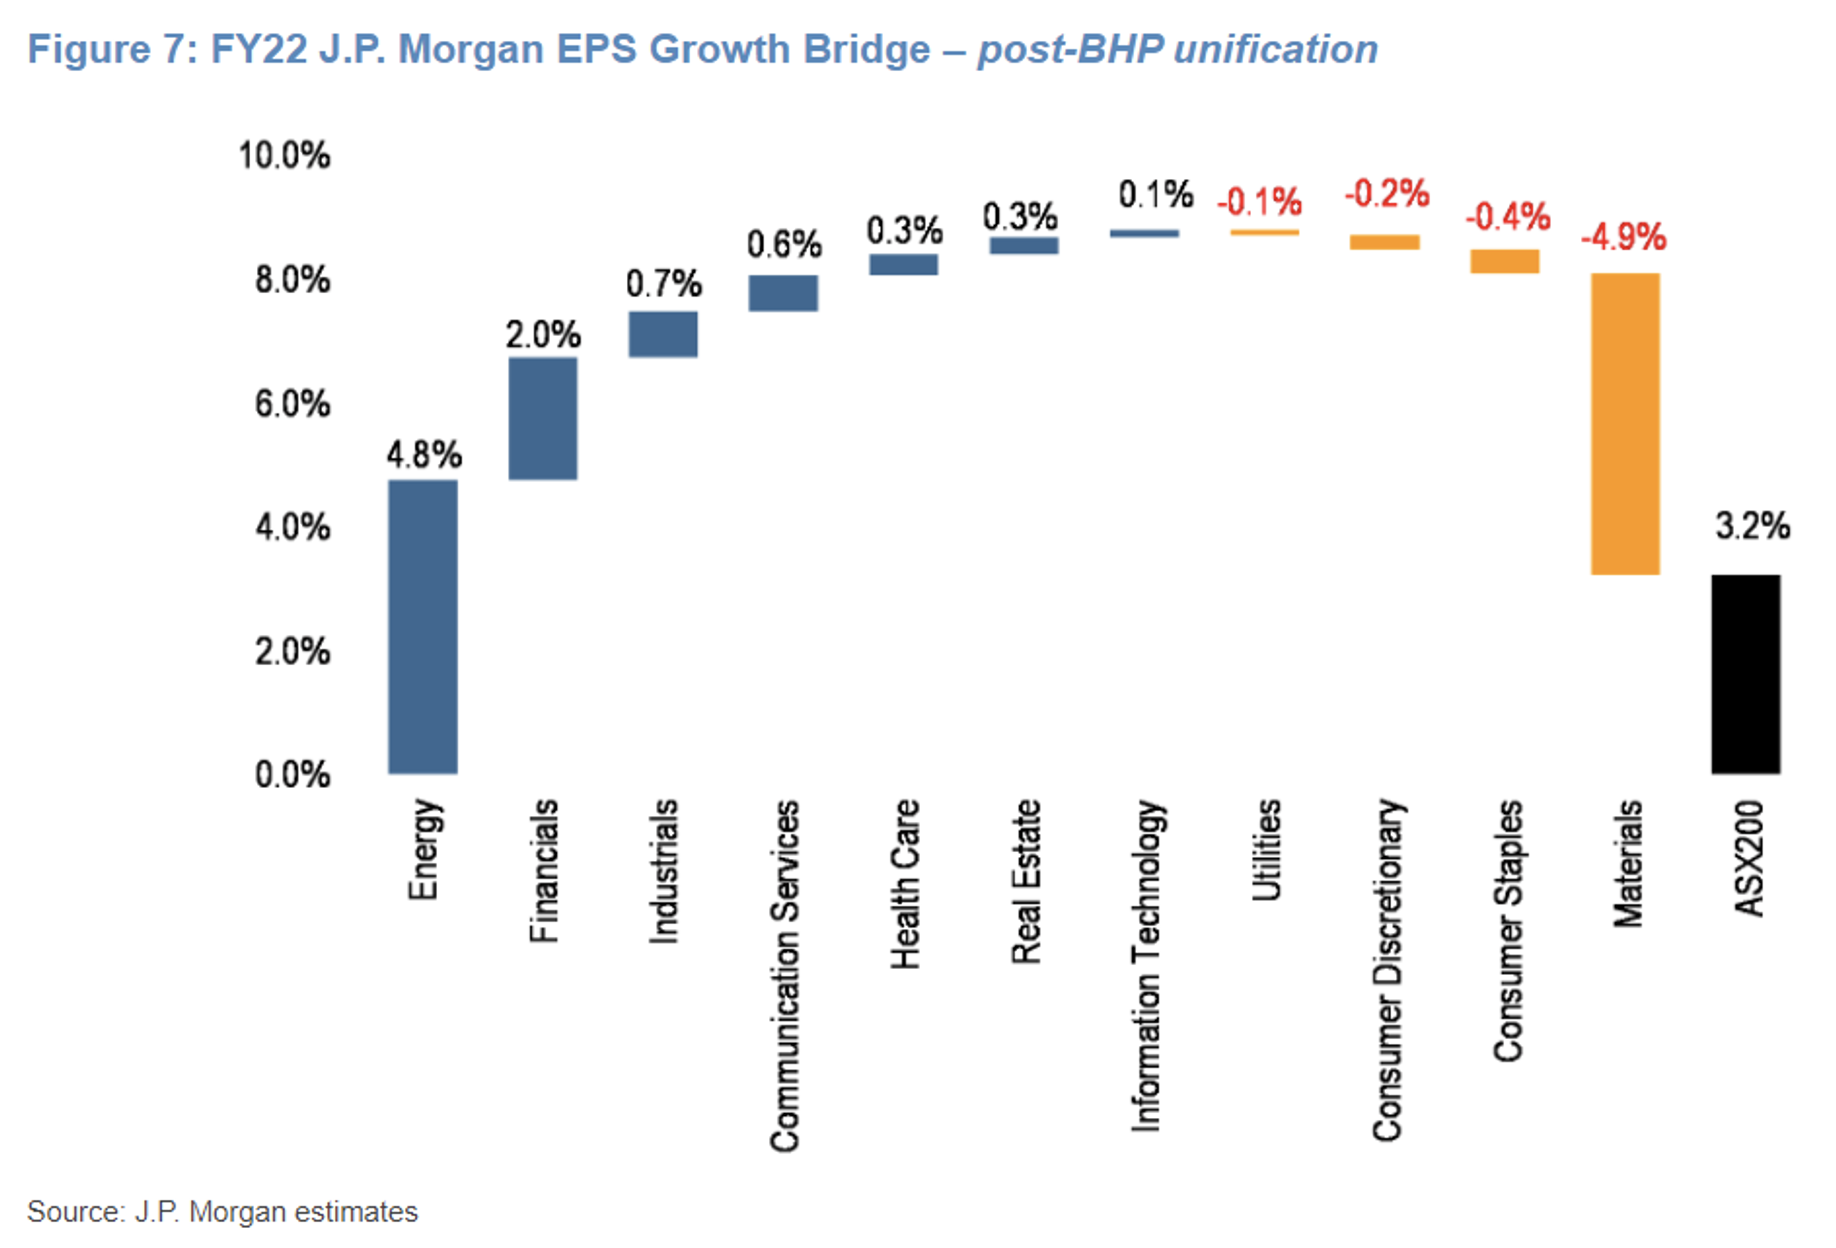
We need to take into account one of the biggest corporate events in ASX history which is the BHP reunification where the dual corporate structure will be collapsed and BHP’s weighting in the ASX300 index goes from about 7 per cent to over 11 per cent. Given that earnings for BHP will most likely go backwards compared to the bumper FY21, we should probably expect EPS growth of only about 3 per cent and we instead get this EPS bridge:
We can see the market is anticipating outside Energy and Materials the sectors that benefitted from COVID, like goods consumption, are projected to see reversed fortunes, while sectors that were adversely impacted by COVID, like Health Care (fewer elective surgeries etc.), Telecommunications (lack of international roaming revenues) and Industrials (impacted by production disturbances and higher logistic costs) are projected to improve earnings power compared to last year as conditions normalise.
The Montgomery Fund has generally a tilt in this direction and we will keep a close eye on the upcoming half year results to confirm that things are going in this direction. We do not have any significant exposure to either the Materials or the Energy sectors as we do not consider we have an edge in calling commodity prices and in general consider the companies in these sectors as being of lower quality than we want exposure to.
This post was contributed by a representative of Montgomery Investment Management Pty Limited (AFSL No. 354564). The principal purpose of this post is to provide factual information and not provide financial product advice. Additionally, the information provided is not intended to provide any recommendation or opinion about any financial product. Any commentary and statements of opinion however may contain general advice only that is prepared without taking into account your personal objectives, financial circumstances or needs. Because of this, before acting on any of the information provided, you should always consider its appropriateness in light of your personal objectives, financial circumstances and needs and should consider seeking independent advice from a financial advisor if necessary before making any decisions. This post specifically excludes personal advice.
INVEST WITH MONTGOMERY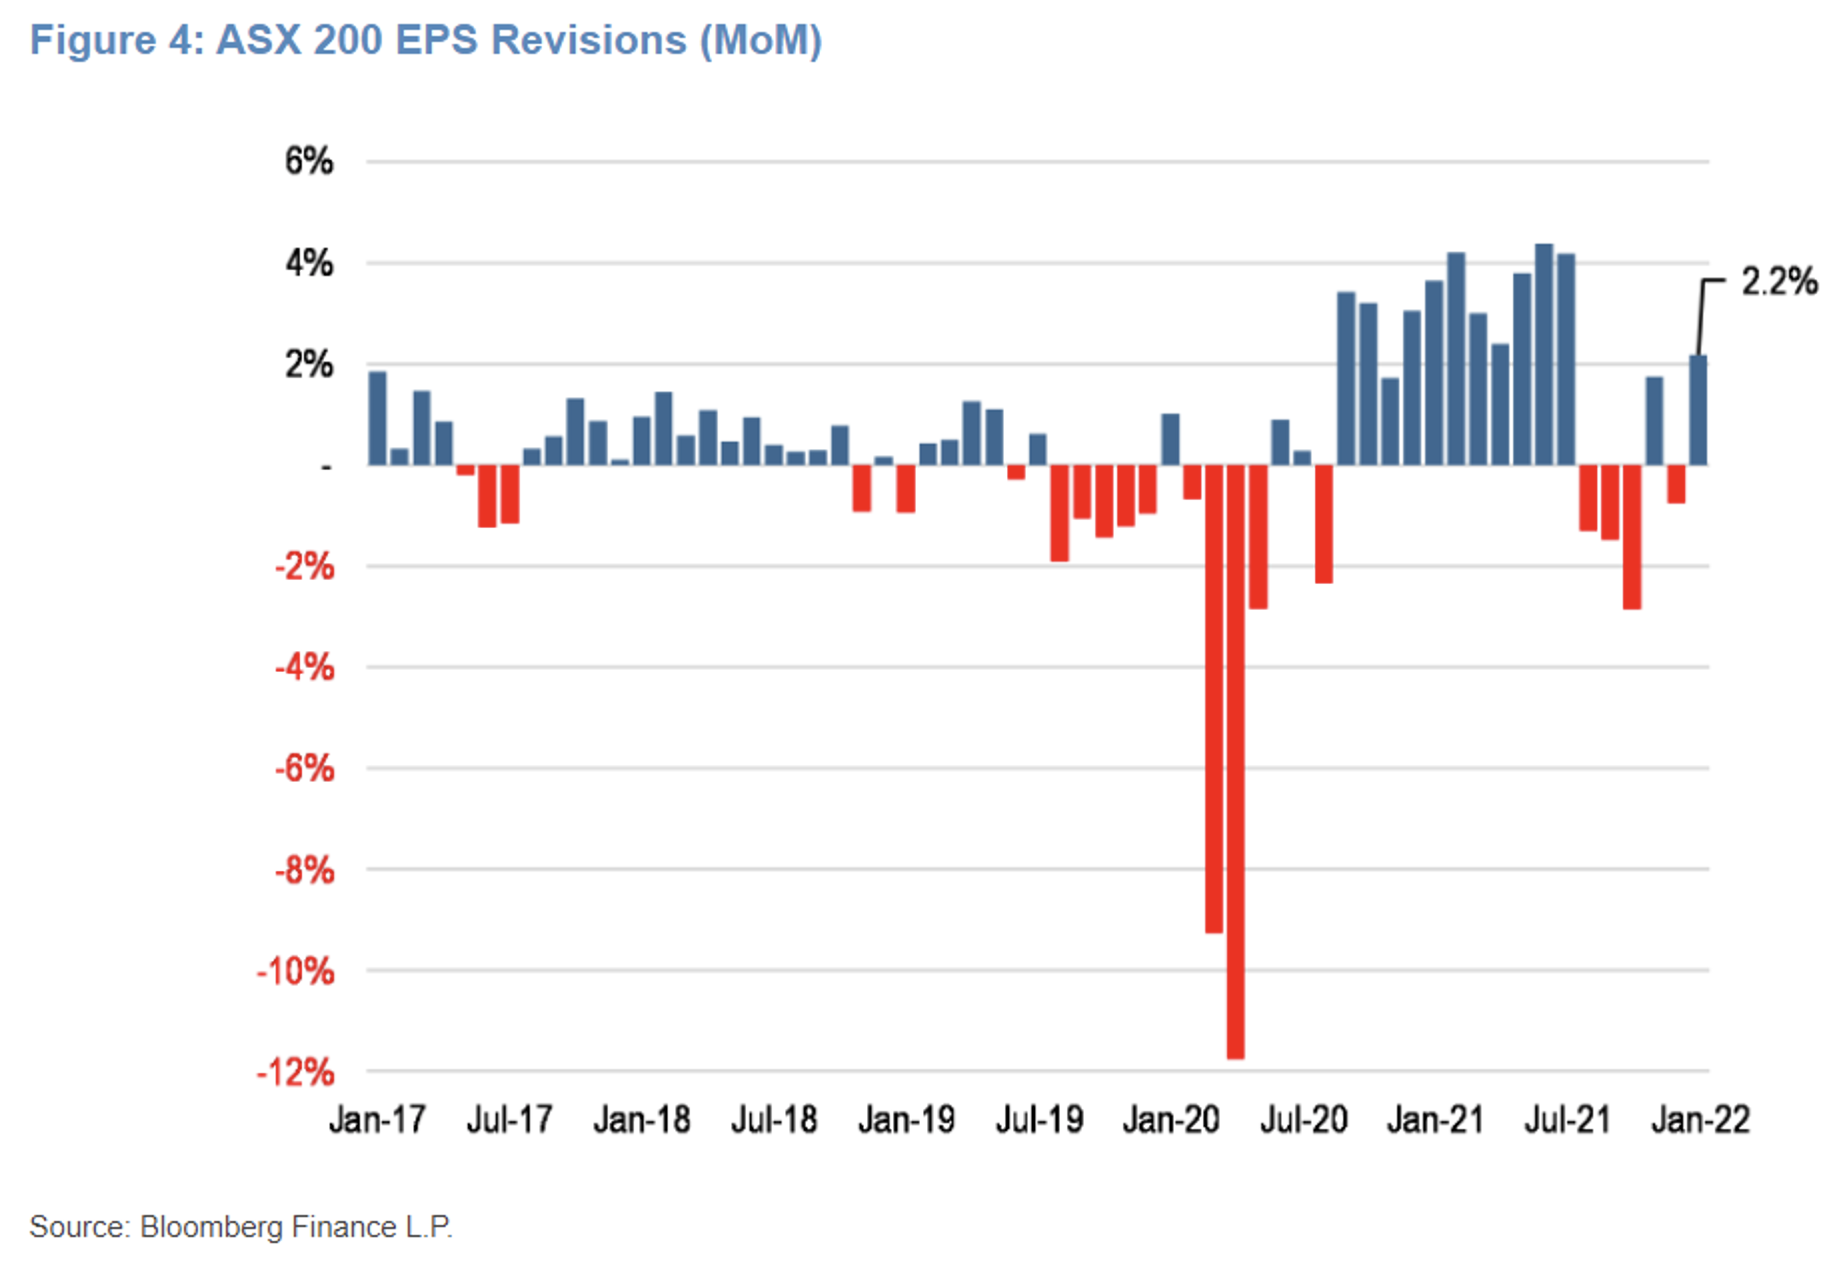
Just asking this for a friend, if a person were to invest in the Montgomery Fund with the minimum amount an wanted all income to be compounded is that possible and how much are the setup costs are the ongoing fees
Hello Barbara, there are no set-up costs – you only pay an annual management fee, by way of example for $50,000 invested per annum would be around $700, and if we achieve out-performance, a performance fee. Please be sure to download the Product Disclosure Statement and section 6 covers the fees in more detail: https://montinvest.com/tmf