What is going on underneath Nasdaq?
After hitting a record high in mid-November, the tech-heavy Nasdaq index in the US has encountered some volatility, as the combination of Jerome Powell’s reappointment as head of the US Reserve, an increasingly hawkish Fed and Omicron concerns has led to some selling.
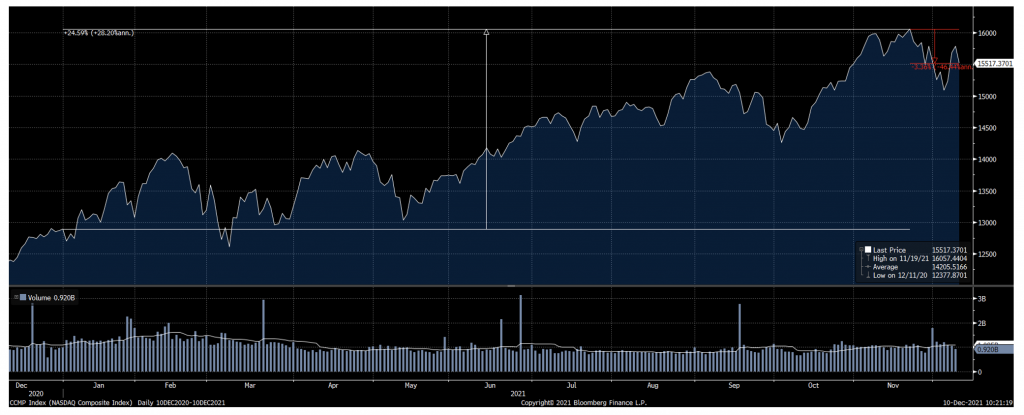
As of last Thursday, the 3.4 per cent pullback appears very mild especially in the context of an index that had posted an approximate 25 per cent gain to mid November. This is shown in Figure 1 below:
Figure 1: Nasdaq Composite index CY21 chart
Source: Bloomberg
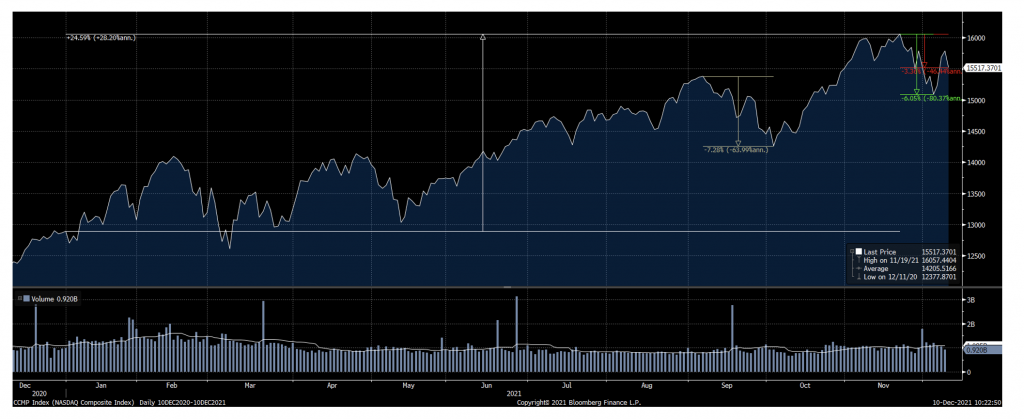
Extending this further, even at its recent bottom the pullback represented only at most a 6.1 per cent decline (albeit this is flattered somewhat given the late flurry of buying on the 3rd December). Putting the move in context, this is less than the 7.3 per cent fall over September to early October, when similar tapering and Evergrande headlines dominated (albeit with no Omicron). For most people, things always feel worse when prices are falling – even if the index is back to where it was just 30 days ago!
Figure 2: Nasdaq Composite index CY21 chart – recent pullback in context
Source: Bloomberg
However, the underlying composition of moves paints an entirely different story.
While the broader Nasdaq index is off just 3.5 per cent, this is almost entirely due to the large companies in the index posting moderate declines. This reflects the fact that the seven largest companies in the Nasdaq (Apple, Microsoft, Google, Amazon, Facebook, Tesla and Nvidia) represent over 40 per cent of the index by market cap (i.e. unadjusted for free-float).
Of these seven companies, the steepest decline relative to its 52-week high registered is Tesla at 20 per cent, followed by Facebook at 14 per cent. Apple, Microsoft and Google – the 3 largest companies by market cap – are down a very mild 1.2 per cent, 4.7 per cent and 2.2 per cent respectively.
Underneath this calm surface there are significant ructions.
Of the remaining circa 3550 companies in the Nasdaq, as of close on 9 December, relative to their 52-week high share price:
- Almost 50 per cent have registered a decline of over 35 per cent;
- Over 35 per cent have registered a decline of over 50 per cent; and
- 18 per cent have registered a decline of over 70 per cent.
This “phenomenon” is known as poor market breadth.
Whether this is a broader re-pricing of risk, concerns over faster tapering and rate increases in 2022 or the Omicron variant – or a combination of all three – is uncertain, but the devil is always in the detail.
The Polen Capital Global Growth Fund owns shares in Microsoft, Google, Amazon, Facebook. This article was prepared 10 December 2021 with the information we have today, and our view may change. It does not constitute formal advice or professional investment advice. If you wish to trade these companies you should seek financial advice.
This post was contributed by a representative of Montgomery Investment Management Pty Limited (AFSL No. 354564). The principal purpose of this post is to provide factual information and not provide financial product advice. Additionally, the information provided is not intended to provide any recommendation or opinion about any financial product. Any commentary and statements of opinion however may contain general advice only that is prepared without taking into account your personal objectives, financial circumstances or needs. Because of this, before acting on any of the information provided, you should always consider its appropriateness in light of your personal objectives, financial circumstances and needs and should consider seeking independent advice from a financial advisor if necessary before making any decisions. This post specifically excludes personal advice.
INVEST WITH MONTGOMERY

