
What impacts Sydney Airport’s cash-flow and dividends?
This part of the deep dive analysis into Sydney Airport (ASX:SYD) will look at SYD’s capital expenditure and capital structure and how this impacts the all-important free cash-flow and dividend profile of the company.
Capital expenditure profile
As discussed in Part 2 of my blog, SYD earns a return on any aeronautical and commercial infrastructure investments to accommodate increased passenger movements through aeronautical service charges, as well as higher retail and property revenues (including car-parking).
Expansion capex for core aeronautical services is staged and underpinned by forecast demand, in commercial agreement with airlines. Expected returns are approximately 10 per cent pre-tax on a weighted average cost of capital basis (i.e. including a component of debt leverage).
Commercial investments include car-parking, additional space for retail, and property development (including hotels). SYD’s targeted hurdle rates of return for commercial development is estimated to be more than 15 per cent.
SYD funds its growth capital expenditure program through debt such that the company is constantly re-gearing the asset for the expected additional earnings power. This is facilitated by the fact that additional investment is largely underpinned by demand (as discussed above) and inflation-linked revenues. As a key infrastructure asset, the company has a generally stable demand profile, which enables higher financial leverage ratios given the predictability of the cash-flow stream.
Sydney capex and debt profile
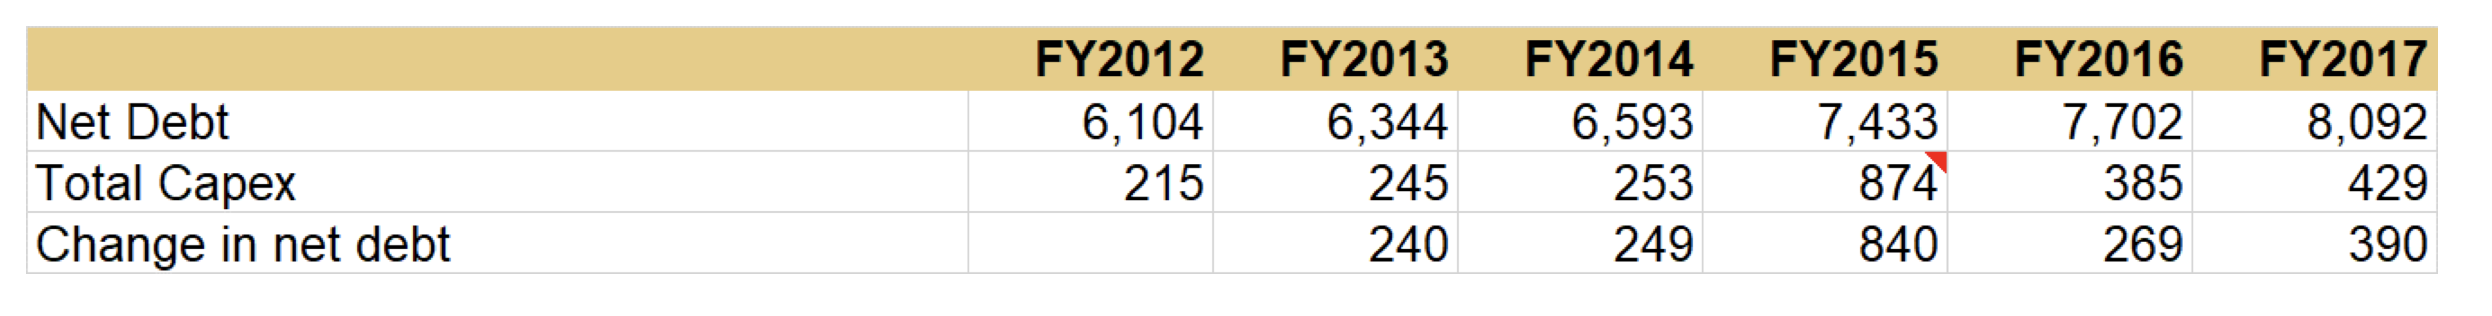
Source: Montgomery
The table above demonstrates this fact, with Sydney’s net debt rising at a rate commensurate with its capex spending. Note the uptick in FY2015 capex represents cash / debt used for the early acquisition of the Qantas T3 leases for $535 million.
Under long-term CEO Kerrie Mather, SYD management consistently demonstrated capital discipline with a return on tangible assets of more than 17 per cent pre-tax, despite the lower contribution from aeronautical services at around 10-11% per cent. This capital discipline was also demonstrated in the company’s unwillingness to exercise its first right of refusal to develop Western Sydney Airport (negotiated as part of its privatisation agreement with the Australian Government), citing dilution to its returns profile.
Sydney Airport rate of return on tangible non-current assets for Aeronautical and total airport services
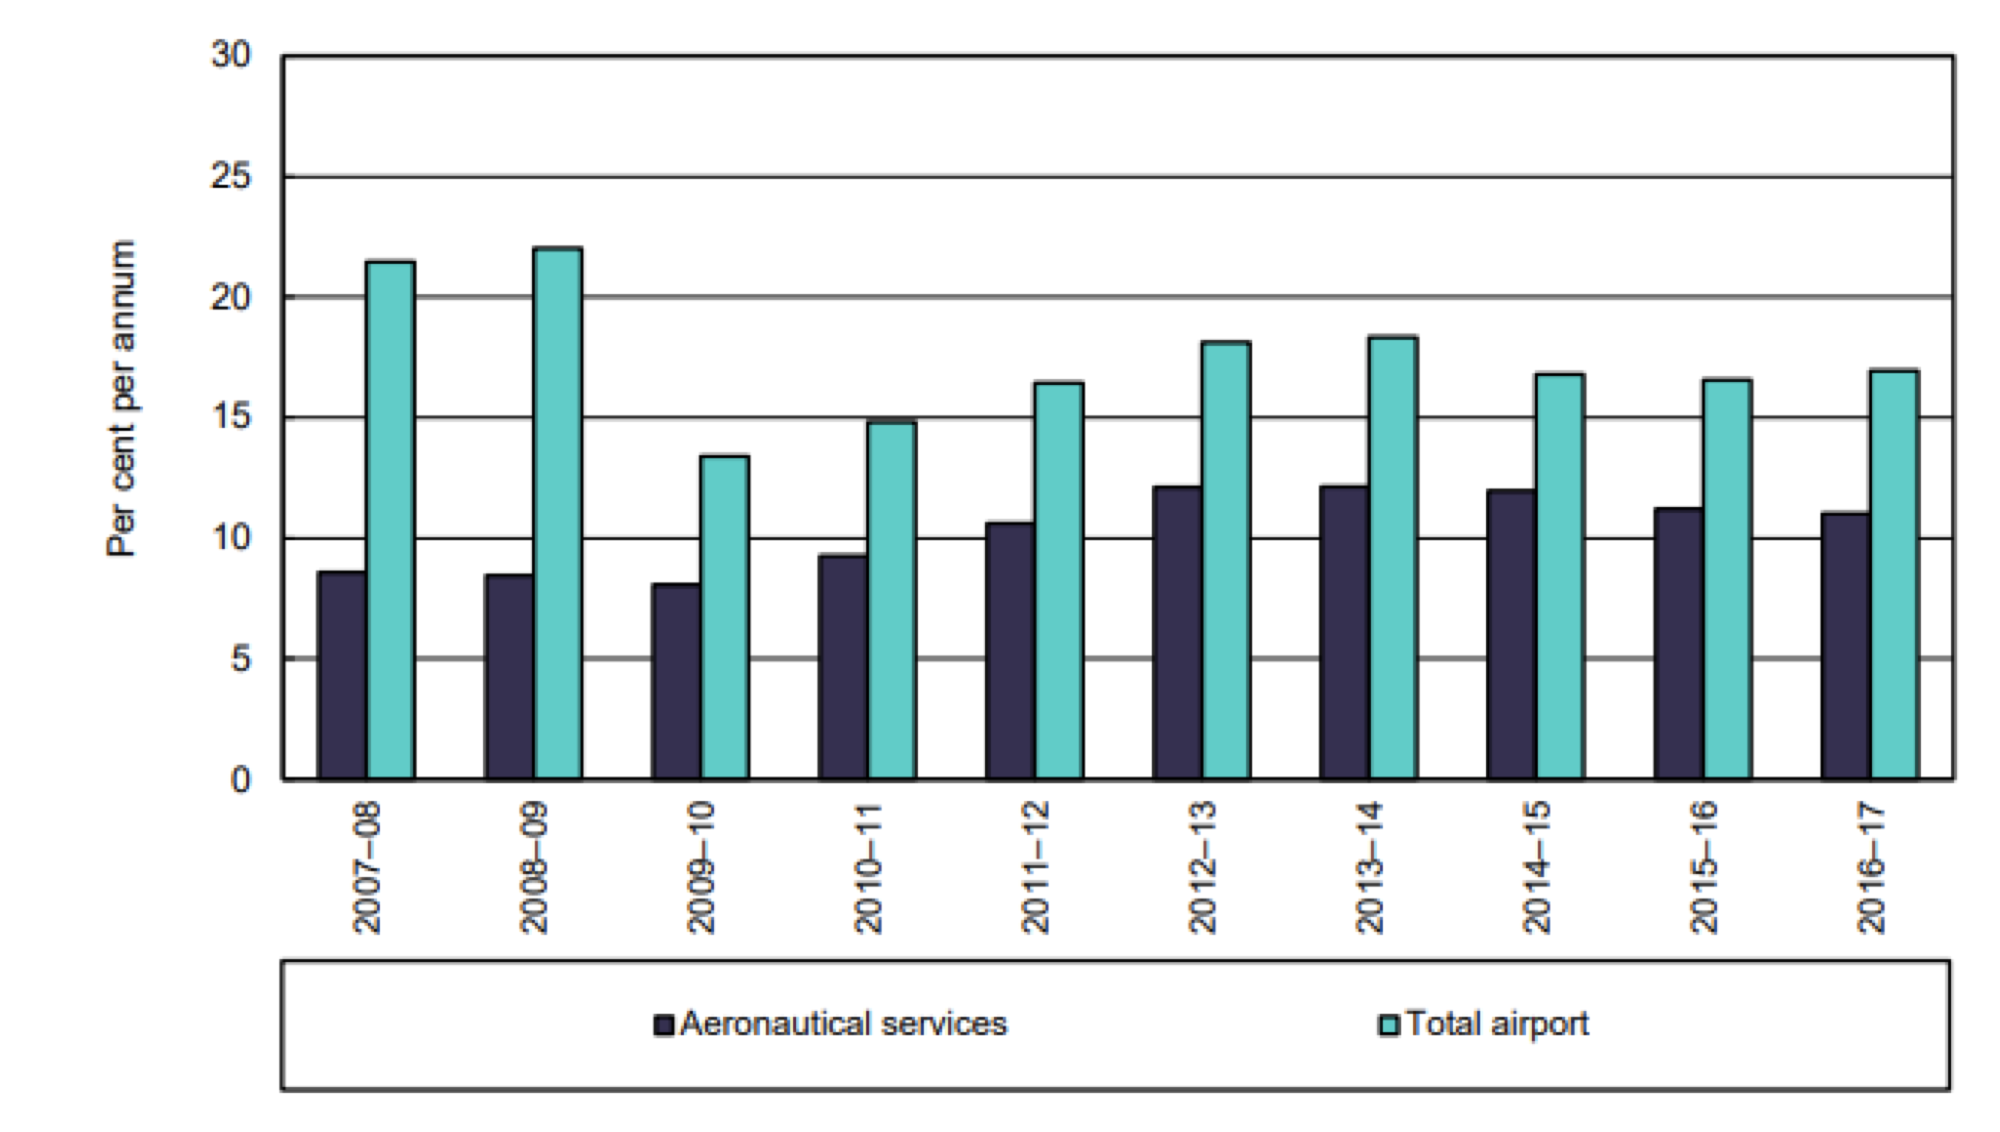
Source: ACCC
Capital structure
SYD has significant debt on balance sheet, a function of its policy to fund capex using debt to maintain its leverage ratios (i.e. interest coverage (CFCR), but more importantly net debt / EBITDA). Maturities of its total $8.4 billion debt are spread over the next 30 years, with an average maturity of 2025 and average cash rate of 4.8 per cent as of December 2018. This is shown in the charts and table below.
SYD debt maturity profile
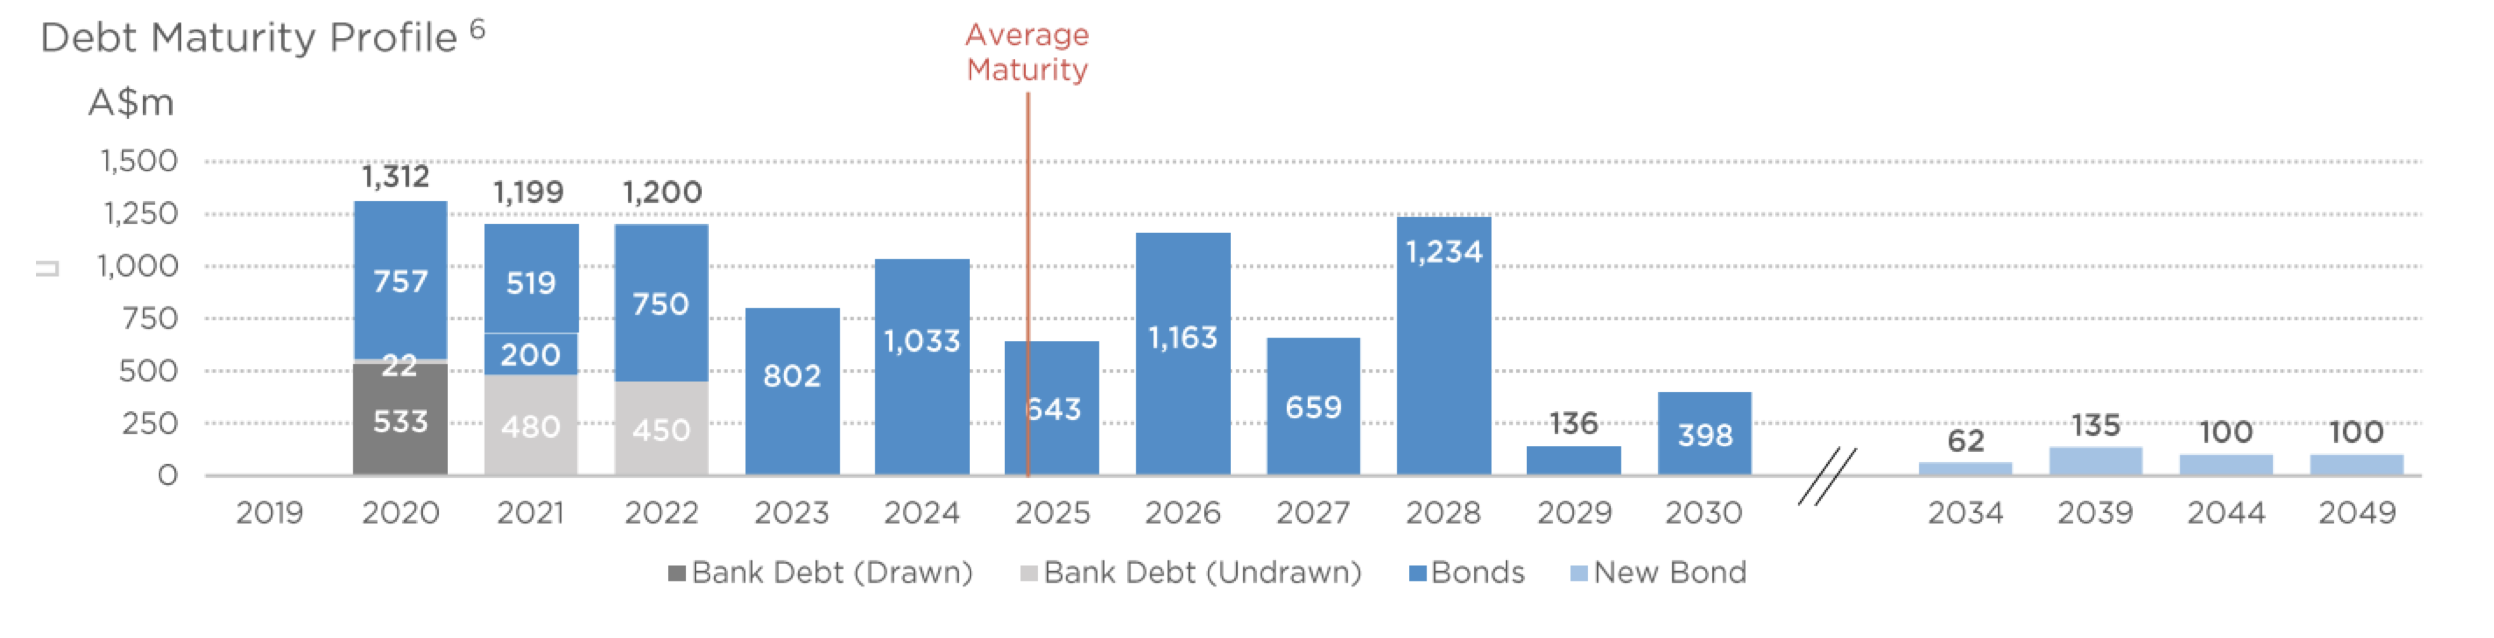
Source: Sydney Airport 2018 Presentation
SYD debt key metrics
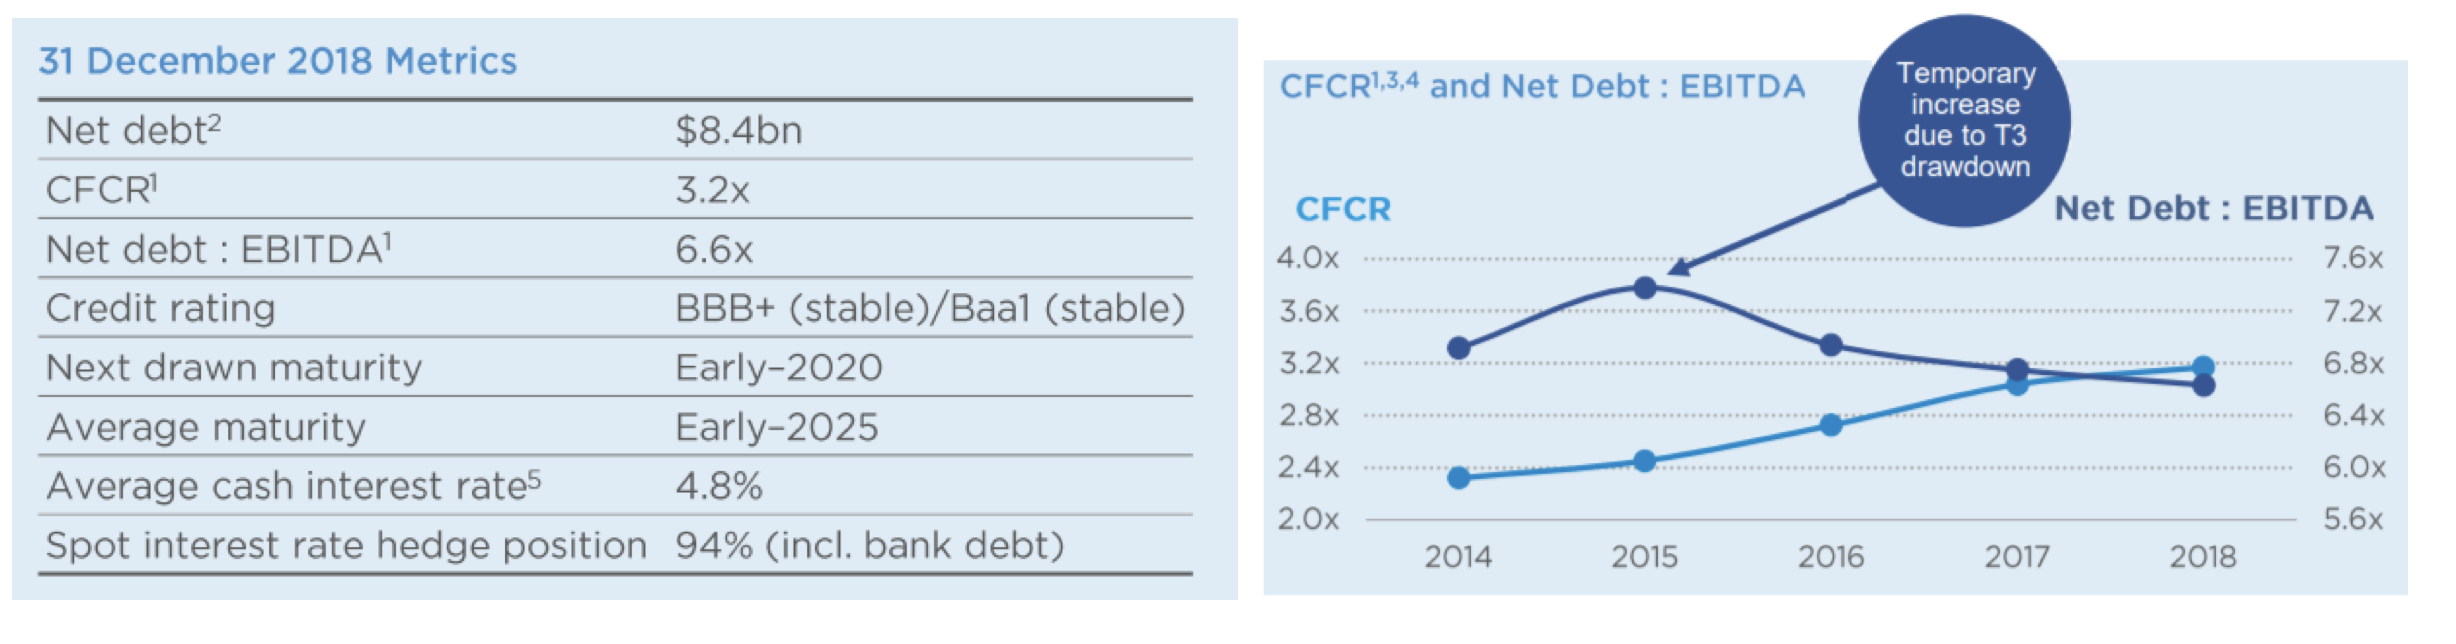
Source: FY17 presentation
Despite a relatively flat net debt / EBITDA ratio, SYD’s funding costs have declined with global rates and now sits at 4.8 per cent vs 6.4 per cent in 2013. While rising rates may pose a problem for interest costs in the future given its high levels of absolute debt, SYD has minimal spot interest exposure with 94 per cent hedging. This helps to minimise variance in its cash interest expense, which leads to a more predictable distribution profile.
SYD interest rate hedging policy
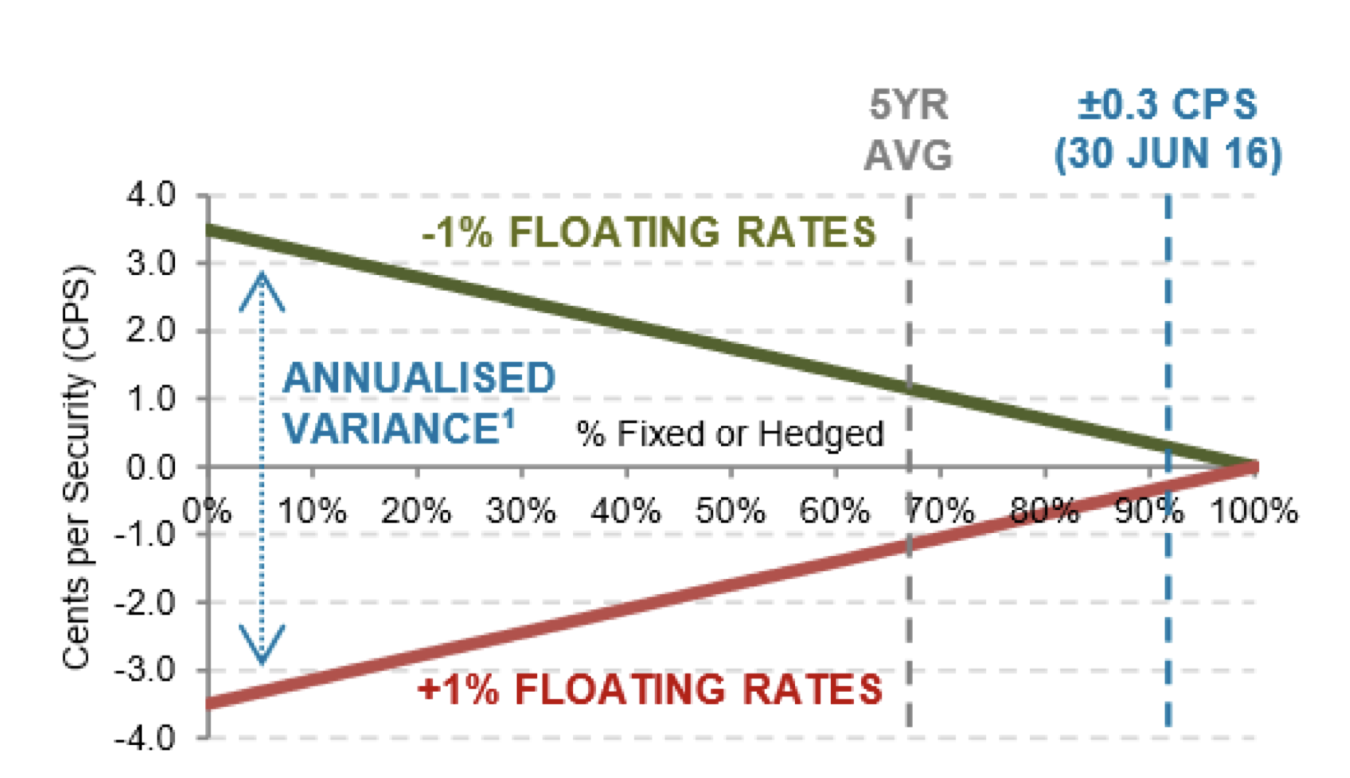
Source: Sydney 2016 investor presentation
The chart, whilst a bit dated, demonstrates the potential variance in its interest expense per security should rates move up or down by 1 per cent per annum – for example, a +1 per cent move in floating rates would impact cash-flow (and hence distribution) per security by -3.5 cents per share under a 0 per cent hedging policy. However, with SYD’s debt close to 95 per cent hedged, there is minimal variance (0.3 cents per share as at 30th June 2016) so higher rates pose no immediate threat to SYD’s projected distribution profile.
In so far as rates move up in the future, this will likely be driven by an acceleration on inflation – which will help Sydney’s inflation-linked revenue streams.
How does the debt-funding capex impact the dividend?
As discussed in the previous segments, Sydney funds most of its capex requirements with additional debt.
So how does this impact the distribution profile? It frees up ~$300-400million in capital expenditure spending to be paid out in distributions, which equates to 13-18 cents per share. The $300 million is similar in quantum to SYD’s annual depreciation expense, a non-cash charge.
This factor – along with ~$90 million of amortisation expenses for its 99-year lease (non-cash), and zero cash-tax payable (projected to 2022) – allows SYD to pay a much higher dividend than its earnings-per-share would imply. Zero cash tax paid also means its distribution is unfranked, which will change as Sydney becomes a tax paying entity.
Over time, the additional debt being taken on will need to be repaid – as Sydney approaches the end of its lease, it will see a significant proportion of its cash flows to repay debt, which will see distributions per share being lower than earnings per share. However, with the lease expiring in 2098, there is significant headroom to bring forward these cash-flows to shareholders today.
In the next part, I will discuss valuation considerations and a key issue impacting the SYD outlook.
You can watch part 1 here and read part 2 here.
This post was contributed by a representative of Montgomery Investment Management Pty Limited (AFSL No. 354564). The principal purpose of this post is to provide factual information and not provide financial product advice. Additionally, the information provided is not intended to provide any recommendation or opinion about any financial product. Any commentary and statements of opinion however may contain general advice only that is prepared without taking into account your personal objectives, financial circumstances or needs. Because of this, before acting on any of the information provided, you should always consider its appropriateness in light of your personal objectives, financial circumstances and needs and should consider seeking independent advice from a financial advisor if necessary before making any decisions. This post specifically excludes personal advice.
INVEST WITH MONTGOMERY