Warning. Warning. Crash Imminent?
You have heard it dozens of times. Soothsayers, market commentators and prognosticators sharing tales of impending doom.
And all sorts of charts and variables are trotted out to explain why, how or when the market will crash.
A particular favourite of ours is what we call the ‘Overlay’. In the Overlay, a chart of the 1987, 2000 or 2007/08 stock market crash is displayed and then a chart of the current market is lined up against the original to demonstrate just how closely the two periods are mimicking each other. The insinuation is that the market will soon crash just as it did all those years ago.
The following example is the most recent one we have seen and it implies a market crash on January 14, 2014. It’s terribly effective at paralysing investors.
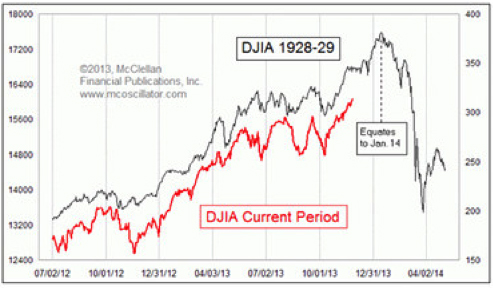
Of course if I were to produce a thousand or so of these charts, I would discover that some of them appeared to be prescient. But the similarity is pure coincidence and the alignment no more effective a predictor than Buffett’s 215 Orangutans who, from a field of 225 million starters, correctly predicted 20 consecutive coin flips.
To prove the point, it’s worth looking at an earlier example published online in July 2013 predicting, you guessed it, an impending stock market crash.
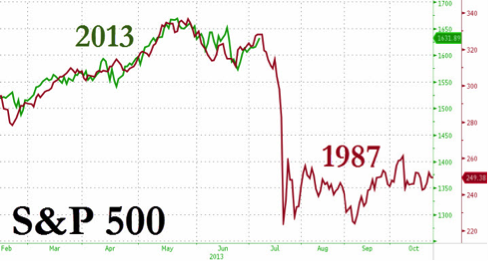
This second chart was published on one of those doom and gloom forums that seem to attract a particularly unsavoury brand of ‘investors’ who are all experts at finance but masters of much less finances. For some reason this predisposes them to slander one another while simultaneously agreeing that the world will imminently end. You get the general drift.
Having predicted a crash in the S&P500 to about 1300 points from 1631 at the time – a near 18 per cent decline – what actually transpired? At the time of writing, 18 December 2013, the S&P500 stands not at 1300 but at 1781 index points.
These techniques attract a lot of attention but they are sadly lacking in any rigour or merit.
A better method is the one proffered by Warren Buffett and annunciated in a 2001 interview he gave with his good friend from Fortune Magazine, Carol Loomis:
“[T]he market value of all publicly traded securities as a percentage of the country’s business–that is, as a percentage of GNP… has certain limitations in telling you what you need to know. Still, it is probably the best single measure of where valuations stand at any given moment. And as you can see, nearly two years ago the ratio rose to an unprecedented level. That should have been a very strong warning signal.”
The chart below displays this Market Cap/GDP ratio that Buffett referred to, and displays the ratio right up to today.
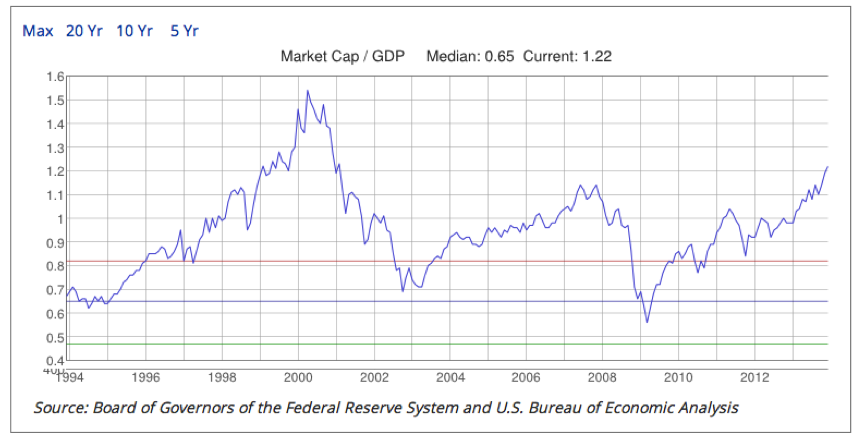
As you can see, the indicator was indeed useful in warning investors in 2000 and 2007. Today it appears to be warning investors again.
So what does Buffett think?
On CNBC back in September Buffett observed that stocks have “moved a long way” in the past five years, rising from “ridiculously cheap” to “more or less fairly priced now.”
“We don’t find bargains around but we don’t think things are way overvalued either. We’re having a hard time finding things to buy.”
“The extent that QEIII is keeping interest rates lower than they would otherwise probably keeps asset prices higher,” adding, “we don’t find bargains around but we don’t think that things are way overvalued either.”
Perhaps amid zero interest rates its acceptable to see the Market Cap/GDP disconnect from past prescience.
Robert Shiller, who won the Nobel Prize for economics with two other Americans for research into market prices and asset bubbles, pinpointed the US stock market (and Brazilian property market) as areas of concern.
“I am not yet sounding the alarm. But in many countries stock exchanges are at a high level…”
“That could end badly,” he said.
“I am most worried about the boom in the US stock market. Also because our economy is still weak and vulnerable,” he said, describing the financial and technology sectors as overvalued.
What do I think?
I think you waste a lot of time and even more opportunity worrying about crashes unless it’s blindingly obvious – and it has usually been obvious in the past.
If you think of prices as a dumbbell there are really obvious periods in which prices are ridiculously cheap – all companies at single-digit P/Es for example – and then there are periods in which bubbles form and prices are completely detached from their underlying fundamentals. During these periods it pays to have guts (you don’t need a huge IQ) and the right attitude.
Those periods don’t seem to be in existence today. By way of example, the prices of the quality stocks held in the Montgomery portfolios are generally within 10 per cent of our estimates of their values. That doesn’t rule out a correction, but it won’t be a crash preceded by irrational exuberance, and generally rallies end amid extreme enthusiasm – the third stage of a bull market.
I believe we will see that phase in the next few years but we aren’t there yet.
I’d be delighted to hear what you think. Feel free to post a comment below.
Roger Montgomery is the Founder and Chairman of Montgomery Investment Management. Roger has over three decades of experience in funds management and related activities, including equities analysis, equity and derivatives strategy, trading and stockbroking. Prior to establishing Montgomery, Roger held positions at Ord Minnett Jardine Fleming, BT (Australia) Limited and Merrill Lynch.
He is also author of best-selling investment guide-book for the stock market, Value.able – how to value the best stocks and buy them for less than they are worth.
Roger appears regularly on television and radio, and in the press, including ABC radio and TV, The Australian and Ausbiz. View upcoming media appearances.
This post was contributed by a representative of Montgomery Investment Management Pty Limited (AFSL No. 354564). The principal purpose of this post is to provide factual information and not provide financial product advice. Additionally, the information provided is not intended to provide any recommendation or opinion about any financial product. Any commentary and statements of opinion however may contain general advice only that is prepared without taking into account your personal objectives, financial circumstances or needs. Because of this, before acting on any of the information provided, you should always consider its appropriateness in light of your personal objectives, financial circumstances and needs and should consider seeking independent advice from a financial advisor if necessary before making any decisions. This post specifically excludes personal advice.
When I think about macro economics and investing I think about what Charlie Munger has to say
“Warren and I have not made our way in life by making successful macroeconomic predictions and betting on our conclusions.
Our system is to swim as competently as we can and sometimes the tide will be with us and sometimes it will be against us. But by and large we don’t much bother with trying to predict the tides because we plan to play the game for a long time.
I recommend to all of you exactly the same attitude”.
Take the opportunities in companies with strong fundamentals at a safety margin with an economic moat or some durability. Add discipline and equanimity to stock market fluctuations .. Including crashes and you should fair well.
Perfect Michael.
G’day Roger, firstly can I say that in my humble opinion your commentary and analysis is first class and speaks volumes about your enthusiasm for your work, notably the time to take to read and reply to each post. One of the amazing things about the internet is that world class research is freely available to anyone willing to devote their time to read it!
I would disagree with your opinion that we will see the ‘third phase in the next few years’ as I believe we are currently in a short term rally of a longer term bear market.
I certainly agree with the proposition that equity markets worldwide are fully valued as there are many differing valuation tools and respected opinions pointing to that conclusion. However predicting a drop means venturing an opinion on the direction of future earnings and more importantly the likelihood of an event significant enough to cause the market participants to shift into risk averse mode. There is no possible way to predict such a ‘black swan’ event that might shift an extreme move to risk averse but we can certainly make an educated guess about the likely direction of future earnings.
The starting point is that all the major economies have issues with excessive debt at the private and government level. The largest economy in the world has shown that massive amounts of monetary stimulus and zero bound interest rates have only brought about growth that when compared to the past is ‘sub-par’. The published unemployment rate seems significantly skewed by the low participation rate and therefore the true rate much higher. It is common knowledge that Europe is facing significant headwinds with southern countries faring the worst, Japan’s growth is being brought about by currency devaluation and China faces a fine rebalancing towards more consumption led growth. Finally and unfortunately for Australia we face the prospect of significant budget cuts to ‘middle class welfare’ and other areas to hopefully rebalance over the next decade. I feel it is important that this happens but will no doubt detract from consumption and therefore growth. I guess my view is that with so much debt that the likelihood for a ‘black swan’ event in the next few years is a lot higher than in years gone bye and that the market might not need to make the highs as in the past when it becomes ‘obvious’ given 2008 is so fresh in people minds. At this stage I am happy to be on the sideline short the AUD and the YEN as it seems the US is the best horse in a bad race.
Hi Peter,
Apppreciate you taking the time to share your opinion here. The delightedful thing about the market is that different views are essential to make it work.
From where I am standing, a crash is not on the horizon anytime soon. There reason being, the Fed won’t allow it. Of the three kinds of inflation, CPI is very weak, commodities are actually deflating, and assets are rising thanks to the Fed. Asset price inflation is the only game in town for the Fed to keep the whole world afloat. There is no doubt that equity markets are on life support. From the fundamentals point of view my favourite tool is the historical ten year average PE ratios. I find a lot of index heavy companies including CBA, BHP, TLS and MQG are trading above historical maximum average PE levels, so I would stay away from those if I was a long term investor. It is also a sign that the index might be on the expensive side. From the technical point of view we just had a turn around a couple of days ago to the up side and it will continue for two weeks at least as supported by seasonality analysis. There will be a pause in mid January followed by recovery and a usual slump in week 8 and 9, then a massive boom in March. So over all we are headed a lot higher from here until May. We are now at the early stage of the seasonal rally which will last till May, certainly there are no screaming crash or sell signals present at the moment.
Hi Roger….I am hoping for a Christmas rally on JB Hi Fi….Do you reckon it is worth a punt buying in now ? Which camp are you in ?
Roger,
Considering that US companies derive significantly more proportion of the revenues from abroad, I don’t think the GNP ratio is relevant anymore.
May be, it should be expanded to World GDP. But, as with everything, Metrics will work until it won’t.
That’s why both Keynes and Buffett stayed away from this useless garbage Macro analysis. With Millions of variables, you can pick any two that correlates to the market.
Both Keynes and Buffett figured out that the best approach is bottoms-up analysis. Find Great companies (probably use Macro extreme oversold events to buy and stay put on other times) and forget about the noise.
Here’s a chart of US GNP versus GDP which should cause no concern…HERE
Roger, I meant World GDP
You refer to Shiller and Matthew above refers to Shiller’s CAPE. The Economist magazine loves CAPE, so it must be important (sic). Currently CAPE is at 25, whereas the long term average is around 15. Wow! The US market must be overvalued!
But check out recent posts in FT Alphaville and you get a rather different story.
While CAPE may have proved to be a reliable indicator for decades (and Shiller has track record for predicting bubbles), the recent commentary on FTA (Jeremy Siegel 19/8/13, Dan Mcrum 17/12/13) suggests the data has changed in character in the last 10 years (due, for example, to changes in accounting standards) giving rise to a bias.
Adjusting for the bias, McCrum thinks the US “is not wildly expensive, but is a long way from cheap” Sounds a bit like our market, really.
Interestingly “even if you were to assume a more normalised risk free rate – 1-3 percentage points higher – the equity risk premium would not be far out of line with recent levels and still above the long etrm average. Having said that unless there is a strong growth signal, equities could react badly to a significant increase in the 10 year risk free rate.”
Roger in US stock market I don’t see bubble in many quality mega cap. Using PE as rough estimate of value (ROE is better tool for valuation) , MSFT, ORCL, IBM, CSCO, C, BAC, AAPL, WFC, GM are trading at fwd PE of 9-12 with super strong balance sheet.
Roger you continue to drum home the need to concentrate on stocks not the index.
We can see recently that the market keeps bidding stocks higher to unjustified levels, but sooner or later the company has to report.
There have been dozens of stocks recently that have fallen 20%,30% 40% and more, because they had run too hard, that previously were trading at ridiculous valuations.
That’s not counting stocks that have been caught up in a slowdown in the mining capex etc.
Sometimes we exit to early, but at the time were happy to lock in profits.
But just maybe, the market is right and analyst forecasts are way too conservative?
Maybe indeed.
Roger, you rightly point out that the two top charts are pure coincidence. The following link from the excellent Advisor Perspective site may be of much more interest:
http://advisorperspectives.com/dshort/charts/markets/secular-bull-bear-markets.html?SP-Composite-secular-trends-with-regression-channel.gif
As far as I can see from the chart, we are yet to get the final washout that gets rid of all the excessive debt still in the system and lowers valuations to screaming buy levels. Once that’s gone through, we may hopefully get a new secular bull market, even though the demographics are not very supportive. About time us Gen Xers and Ys got the chance to really build some decent wealth, particularly considering Centrelink will be gone by the time we come to retire!
Hi Dave,
Not sure what the relevance of the lines parallel to the regression line actually mean. Given the top one has been touched once but is otherwise just a parallel line sitting out in space, I am not sure I understand its relevance…
Rather than a correction or a crash, I feel the most likely event will be a worsening slump following a run of bad news, the likelyhood for which seems quite high at this time. If I examine the downside, top of my list is possible bad economic news out of China. The wall of worry continues with a) withering of the mining investment boom b) continuation of poor economic trends in Oz e.g. rising unemployment c) aussie dollar remains stubbornly high. d) Government failing to get a workable majority in the Senate next July and last but not least, the withdrawal of OZ QE otherwise known as the budget defecit. I’d like to hear from a market optimist who can present the bull case. I assume there is one.
But regardless of where the economy and the market goes from here, you will always do well if you are a reasonably good stock-picker.
Individual stocks can be judged on their own merits, but if using P/E’s investors need to consider whether the projected earnings are sustainable over the long-term. This is why Buffett used GNP for the market because it is a lot more stable (normalised) than corporate profits. The same goes for Shiller’s Cyclically Adjusted Price Earnings ratio. You can also use a simple price/sales ratio for the market. In the case of the S&P500, it does indeed represent poor buying based on measures that adjust for current record high corporate profit margins. Such high margins are the direct result of unsustainable deficits in the government and consumer sectors. We can’t say what the index will do in the next two years, but 100 years of history suggests that over the next ten years, the S&P500 will return something in the order of 3% p.a. likely consisting of two bear markets along the way. From an investor sentiment point of view, if we look at the level of NYSE margin debt used to buy stocks, you can see that we may be in a euphoric (final) stage of the bull market similar to 2000 and 2007. None of this should particularly concern investors who keep a close eye on the reward/risk outlook for their investments and stick to an investment strategy that doesn’t involve panic selling after a market rout.
Here’s a chart of US GNP versus GDP which should cause no concern…HERE
Be interesting to postulate whether the market cap/GDP ratio warning indicator should change (increase) over time as the US “internationalises”. i.e. what % offshore earnings exposure do US-listed companies have now vs historically. Gut instinct says the offshore earnings number should be higher so not constrained as much by US GDP.
The difference between GDP and GNP is only slight…
The interesting thing about Buffett’s chart is that is that in the 2000 tech boom the price hit in 1998 where it is today. It was also the same level before the GFC crash but ran for another 2 years.
With the US ‘tapering’ we are in a different area, I believe, to that of the 2000 and 2008 crashes.
Roger, have you figured out how to replicate Buffett’s chart for Australian securities? I have managed to do find the data, but when the total AUS equities is divided over GNP(GNI here in AUS) the percentages are WAY out. I can only imagine that AUS securities have a lot of foreign investment?
Small correction, the pre GFC boom ran for another year (not 2) from the current level. But splitting hairs is not the point. The general appearance (from this indicator alone) is one of a fully valued market with few bargains…I wouldn’t expect the percentages to be the same. Smaller proportion of issues, mare reliant on OS etc etc…would be interesting to see if there is range within which the ratio remains through the cycle…
I have formulated such a spreadsheet for this.
It does show similar traits to the US model, however our economy has been better these last few years or perceived to be at least in relation to Aus equities.
The interesting thing about this sheet I made is that is shows the dip in June this year the rise before it and the rise since. The dip in 2008/9 and the ‘uncertainty’ between.
Hi Roger, don’t markets crash when least expected? I don’t agree with you when you say previous crashes “are blindingly obvious”. You like being logical so here is a question…Interest rates are at historical lows, equities are, according to you, at or above fair value accross the board, don’t the odds favour interest rates increasing and equities falling? Surely it is just a question of how (when is a useless question). Yours patiently waiting on the sideline, Mark.
Indeed. Also patiently waiting on the sideline with cash in hand.
How can you be “patiently waiting on the sidelines” when you participated in several recent IPO’s only weeks ago?
Warren Buffett who you quote regularly never invests in IPO’s yet you have invested in four (if my memory is correct). His quote is below.
It’s almost a mathematical impossibility to imagine that, out of the thousands of things for sale on a given day, the most attractively priced is the one being sold by a knowledgeable seller (company insiders) to a less-knowledgeable buyer (investors).”
Elliott that’s easy. In managing portfolios, the approach is not binary. Sitting on the sidelines doesn’t mean 100% cash (as I think you might be implying), it may mean ‘not 100% invested’.
We don’t invest in the index so any thoughts we have about the index or the economy must be put aside and replaced with our views on the quality, value and prospects of individual businesses. Please read Value.able http://shop.rogermontgomery.com/cart.php
With respect to the floats have a look at our comments on Veda. YEs the seller was more knowledgeable but the seller also has a pipeline of other assets to list next year, had a reputation to resurrect and offered a business at a price well below our estimate of its value. We valued Veda at $1.77 on the prospectus numbers (which we reckon will be exceeded without much effort – you may like to write that down and review it when Veda’s results come out) and we were offered a large parcel of shares at $1.25.
The business has been around for years and while there are risks emerging from new players our conversations with industry contacts is that it will be some years before we need to worry. In the meantime the company has the opportunity to entrench its database/competitive advantage.
All the best Elliott.