
US reporting season & earnings
With the U.S reporting season almost done and dusted, I thought I would share with our wider audience some interesting charts I have collected throughout the period. Whilst the commentary has started to turn to loosening the lockdown provisions and a return to normal, it is now key to track how companies earnings have and will continue to be impacted and how quickly management and the market can expect a recovery.
Chart 1: Consensus EPS growth YoY by collective sector
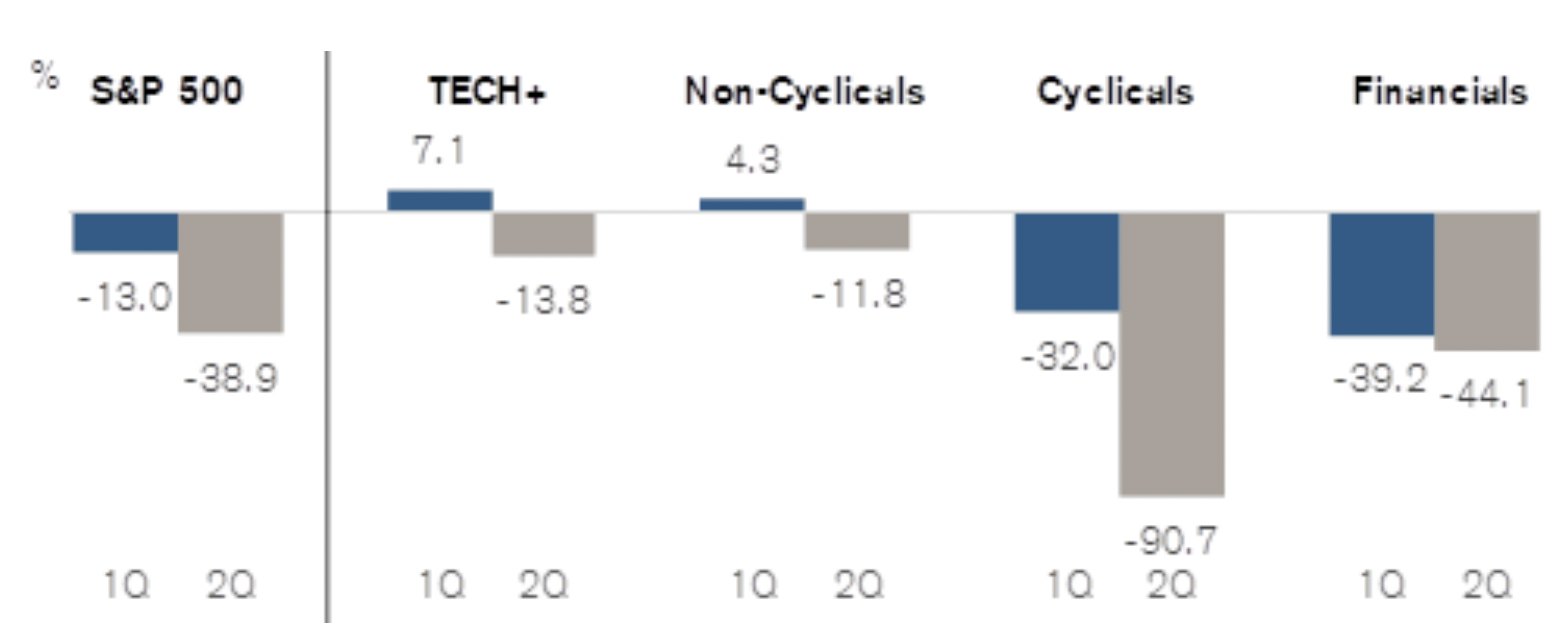
Source: Credit Suisse
The S&P 500 is dominated by several collective sectors, and one that isn’t shy from attracting headlines is Technology which now accounts for almost 40 per cent of the index, followed by Non-Cyclicals at roughly 30 per cent, Cyclicals at 20 per cent and Financials at 10 per cent. Interestingly, the FANG’s plus Microsoft now make up just under 13 per cent of the index. In looking at the consensus EPS data for the S&P 500, the numbers do not necessarily tell the full picture. In fact, Technology as a sector has held up very well, with positive EPS growth in quarter one followed by negative 14 per cent in the following quarter, which has been driven by the larger players most recent results. Likewise, Non-Cyclicals are expected to hold up well, which along with Technology account for 70 per cent of the index. Given the conditions we are in, it is expected Cyclicals and Financials will remain under pressure for the next quarter and likely beyond.
Chart 2: Change in S&P 500 quarterly EPS — first month of quarter
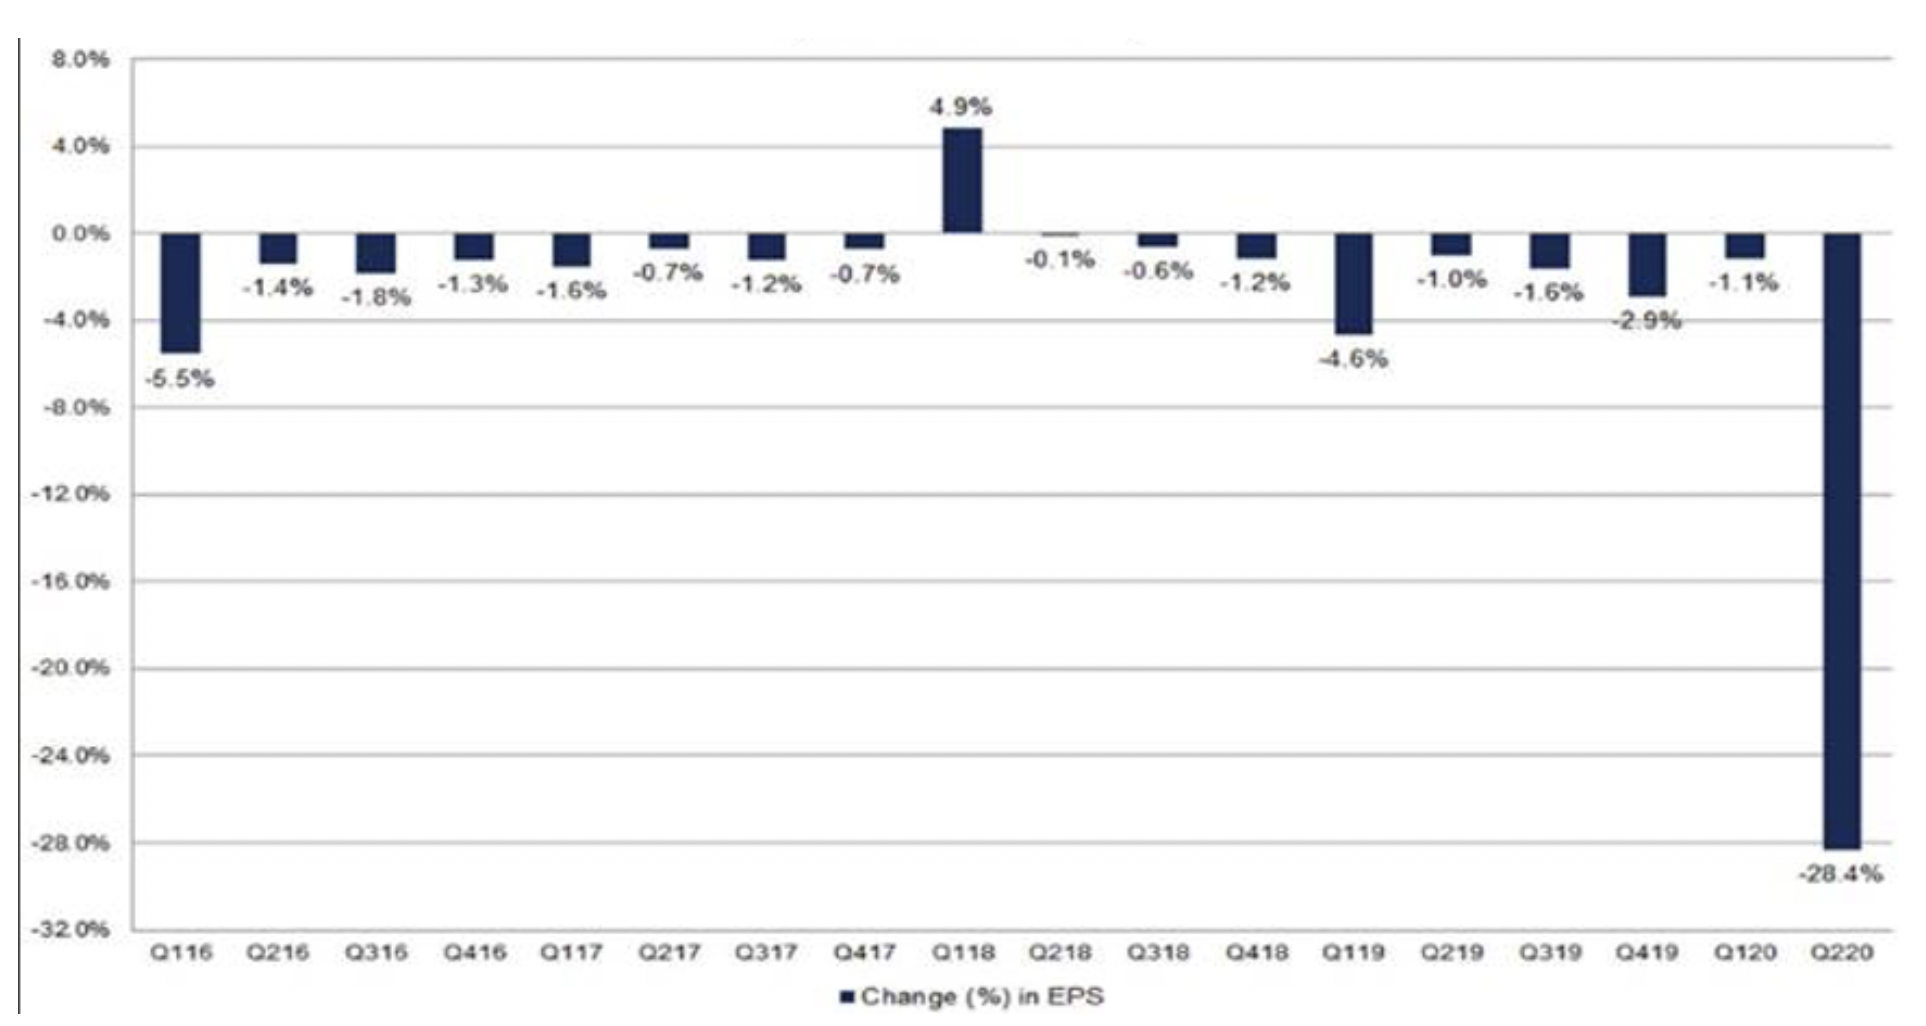
Source: Factset/Crestone
How does this compare to other periods of time?
Factset have looked at the median earnings revisions in the first quarter of each year for the following quarter, as graphed above. According to Factshet’s tracking of the data since 2002, the median revision has averaged a decline of about 1.5 per cent for the next quarter, with the previous worst revision being from the first quarter of 2009 with an estimated EPS decline of over 20 per cent. Second quarter median EPS for this year is expected to decline by nearly 30 per cent, which is a very clear outlier in this data set. What is further of note is that should the next earnings quarter be a negative one (which appears to be likely), it would mark the fourth time S&P500 earnings have declined year on year over the last five quarters according to Factset.
Chart 3: S&P 500 forward P/E versus forward EPS
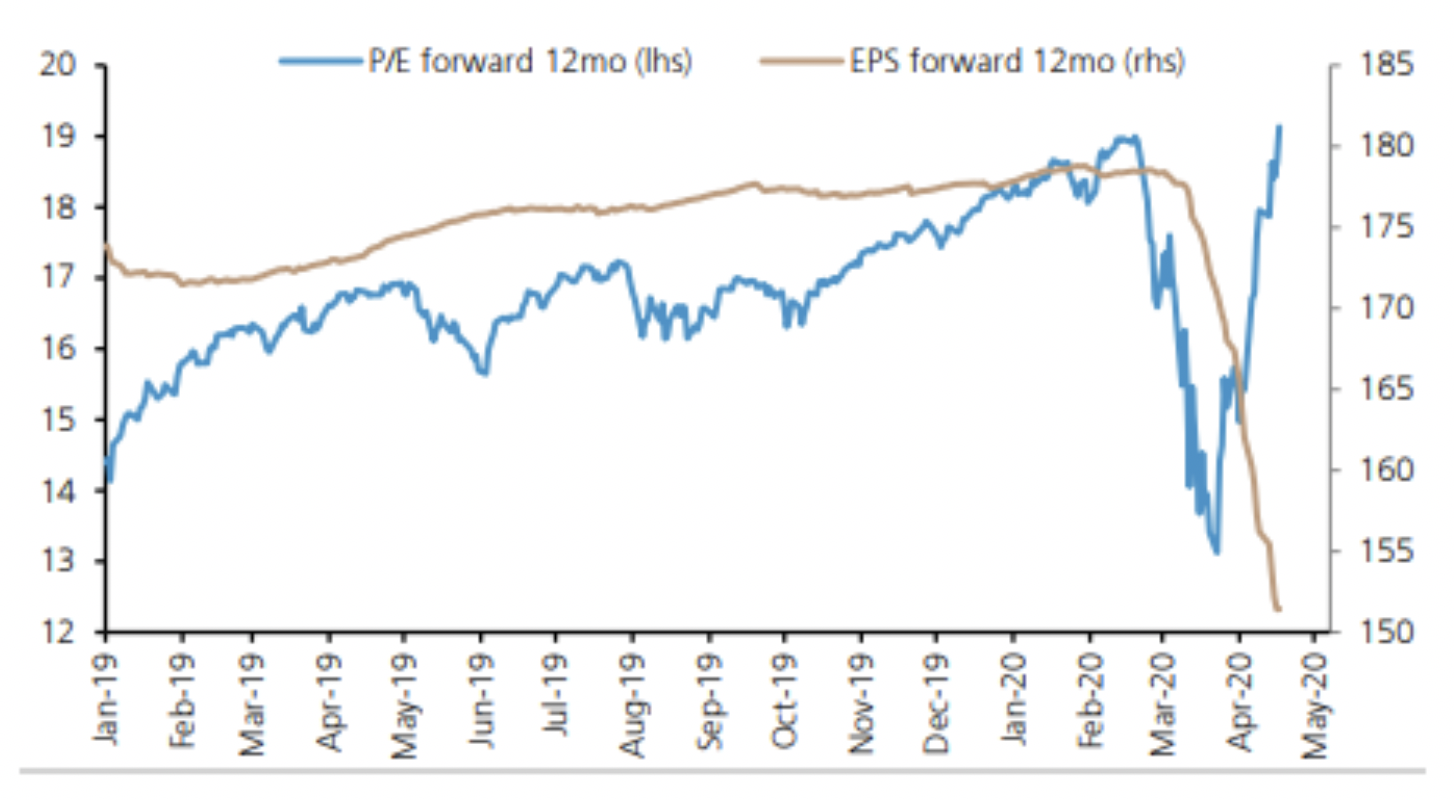
Source: Factset, UBS/Mason Stevens
The chart above looks to bring this all together by comparing the 12-month forward P/E ratio versus EPS forward looking estimates over the same period, as of the last week of April. As it captures, the forward P/E for the S&P 500 is almost 19 times, which is well above is long-term historic average of under 14 times, and moreover almost back at the same level before the COVID sell-off at end of February. Earnings, as measured similarly by 12 month forwarded EPS is down 15 per cent, which is similar to where Credit Suisse and Factset land as of quarter one. At the end of last week, the graph would in fact be showing a forward P/E at above 20 times, which is above both the five year and ten-year average and the highest it has been since April 2002.
I think it is fair to say the US market is expensive by this measure, and where companies earnings land will be of significant discussion going forward. Within this mix, some businesses are holding up in the short-term better than others by virtue of their business models, and that doesn’t necessarily mean these businesses will lead a COVID recovery. It will be interesting to see what insights can be drawn from the domestic reporting season, and whether the same holds true.
Dean Curnow joined Montgomery Investment Management in June 2016.
Dean joined the firm from Colonial First State, where he was a Consultant for Retail Sales for 2 years.
Prior to this, Dean was also a Relationship Manager with the Commonwealth Bank of Australia, where he spent 5 years working in Retail Banking.
This post was contributed by a representative of Montgomery Investment Management Pty Limited (AFSL No. 354564). The principal purpose of this post is to provide factual information and not provide financial product advice. Additionally, the information provided is not intended to provide any recommendation or opinion about any financial product. Any commentary and statements of opinion however may contain general advice only that is prepared without taking into account your personal objectives, financial circumstances or needs. Because of this, before acting on any of the information provided, you should always consider its appropriateness in light of your personal objectives, financial circumstances and needs and should consider seeking independent advice from a financial advisor if necessary before making any decisions. This post specifically excludes personal advice.