Updating Realestate
Realestate.com (REA:ASX) is the kind of business we like. It’s a price maker, not a price taker. We believe it will continue to perform well as the property market matures.
On Friday, in its half yearly financial stability report, the RBA warned property market investors about “a marked future oversupply in apartments in some geographic areas”.
Additionally, Chris Richardson from Deloitte Access Economics warned today in the Australian Financial Review that “There’s an increasing risk that it [property] becomes the worst investment in the next few decades. That might happen fast or slow. But every policy maker should pray that it happens slow.”
Counterintuitively, we believe in a maturing property market, REA group stands to improve its competitive and financial position.
Our thesis on REA Group has been well articulated in previous posts and in simple terms we expect;
1) REA to retain its number one spot in domestic real estate listings,
2) the number of listings to increase as the property market matures,
3) the proportion of higher margin ‘Depth’ or feature ads to increase as vendors compete more aggressively to highlight their property, and
4) the price of depth ads to increase (REA already increased the price of depth ads by 10-15% on July 1 this year).
The combination of the above factors produces a growth-on-growth-on-growth profile for revenues and margins.
And so we are always interested in reading Analyst Ivor Rees, from Morgans, weekly stats update.
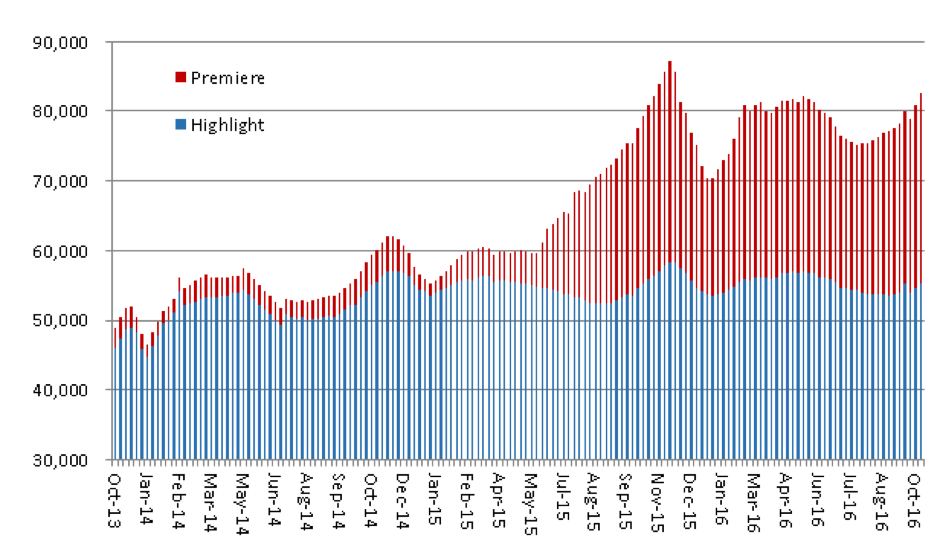
“Paid depth listings on realestate.com.au last week (Week 42) were 82,510, an increase of 3,261 listings (4.1%) on the same week a year ago. While the volume of depth listings still continues to grow week by week, the annualised YOY weekly growth rate continues to decline. Due to the surge in depth listings in late 2015, and the well-reported dearth of overall listings this year, it may get progressively tougher to beat prior-year comparisons.
Over the past six weeks depth listings were on average 5.0% higher than a year ago. The YTD growth rate in volumes is above that assumed in Morgans’ forecasts for depth advertising revenues in FY17.”
“Highlight listings were 55,265, slightly above the same time last year. More expensive Premiere listings totalled 27,245, 13.2% higher than the same week last year. Due to rising numbers of All Premiere subscriptions, Premiere ads now represent 8.8% of all residential listings on REA, up from 7.3% in PCP.”
“REA depth ad prices increased by 10-15% from July 1, with the largest increases in Premiere prices. So far the price rise does not appear to have had a material negative impact on volumes.”
Ivor’s final point above is important. As you know we favour businesses with competitive advantages and the most valuable of these is the ability to raise prices, in the face of excess supply, without a detrimental impact on unit sales volume. With over 80 websites in Australia offering vendors the opportunity to list their homes – and many of these offering to do so for free (excess supply) – it’s fascinating that REA can raise prices and maintain share and growth.
Hi Rodger.
Seeing that REA is getting hammered at the moment, are you buying or selling on this weakness?
Cheers Rex
Can you share your views on how REA compares with Domain?
We believe Domain is the jewel that represents the lions share of the value in fairfax. Beyond that we’ve only analysed the monthly listing volumes of both Domain and REA. Competitive advantage lies with REA.
Thank you for your thoughts. This is well thought out.
I think readers will be most surprised by point 2) of the thesis, given it is counter-intuitive. As the residential property market slows or falters, price falls and resale supply (resale listings) reduce. Whereas if there is distress from developers because of financing pressure, supply of new stock works in the opposite direction and tends to increase (according to the thesis). So developer distress is certainly a realistic or even likely eventuality. But the relevant question is, in terms of REA Group, what percentage of revenue is comprises developer stock listings and what percentage comprises non developer re-sales? The former must increase disproportionately relative to the decline in the latter for the thesis to play out.
In terms of premium listings, the relationship is the similar – there must be a commensurate increase in premium margin listings relative to the decline in overall resale listings.
On the other hand, if the thesis suggests overall resale listings to increase – perhaps as a result of distress among the owner-investor segment, then we need to understand what proportion of revenue is determined by this group, relative to the larger owner occupier segment and how the relative movements compare to each other.
Did the previous cycle experience the same relative movements? This kind of data would confirm or disconfirm the thesis in my view.
Hi Peta, There are several examples in history, including recently and in the absence of developer distress, where a faltering property market resulted in increased supply of properties for sale, rather than fewer. Yes we have spoken with REA about the previous cycle experience.