
Two ways to measure risk adjusted returns
At Montgomery we are constantly asked which fund of ours is the best to invest in? This is an incredibly difficult question to answer, as a) we don’t provide financial advice and are unaware of each of your personal circumstances (and risk preferences), and b) the strategies are not all created equal, in that they are trying to achieve slightly different things from an objective point of view by way of investment design.
With this being said, all of the Montgomery suite of funds have a focus on capital preservation, as much as we can in equity markets, through the ability to hold higher levels of cash or through the ability to short-sell. But how do we measure the effectiveness of this? Is it as simple as investing in the strategy with the highest absolute return?
As an investor, it is key to always appreciate what risk a strategy takes on to generate a given return. This can be as simple as understanding the assets the strategy invests in (whether it be property, bonds, equities – global or domestic), and by also understanding how it looks to invest in such assets (long only, or through shorting, options trading or other derivatives). Below I will review two ways you can measure risk-adjusted returns in the context of two very different strategies we offer at Montgomery: The Montgomery Fund, our Australian long-only equity strategy which can hold up to 30 per cent of its portfolio in cash, and the Montaka Global Fund, our global long/short or variable Beta strategy which utilises short-selling to aim to provide a better risk-adjusted return than equities over the long run.
1. Beta Equivalent Returns
The Beta of a portfolio is a measure of systematic, or market risk. Said another way, it looks to explain the risk of a said investment in relation to how it moves with the market. An investment with a Beta of 1 suggests that it moves in direct unison with the market. As an active manager, this can be a way to measure if your approach provides anything different versus the market. Taking this a step further, you can also look at using Beta as a way of measuring risk adjusted returns, as below:
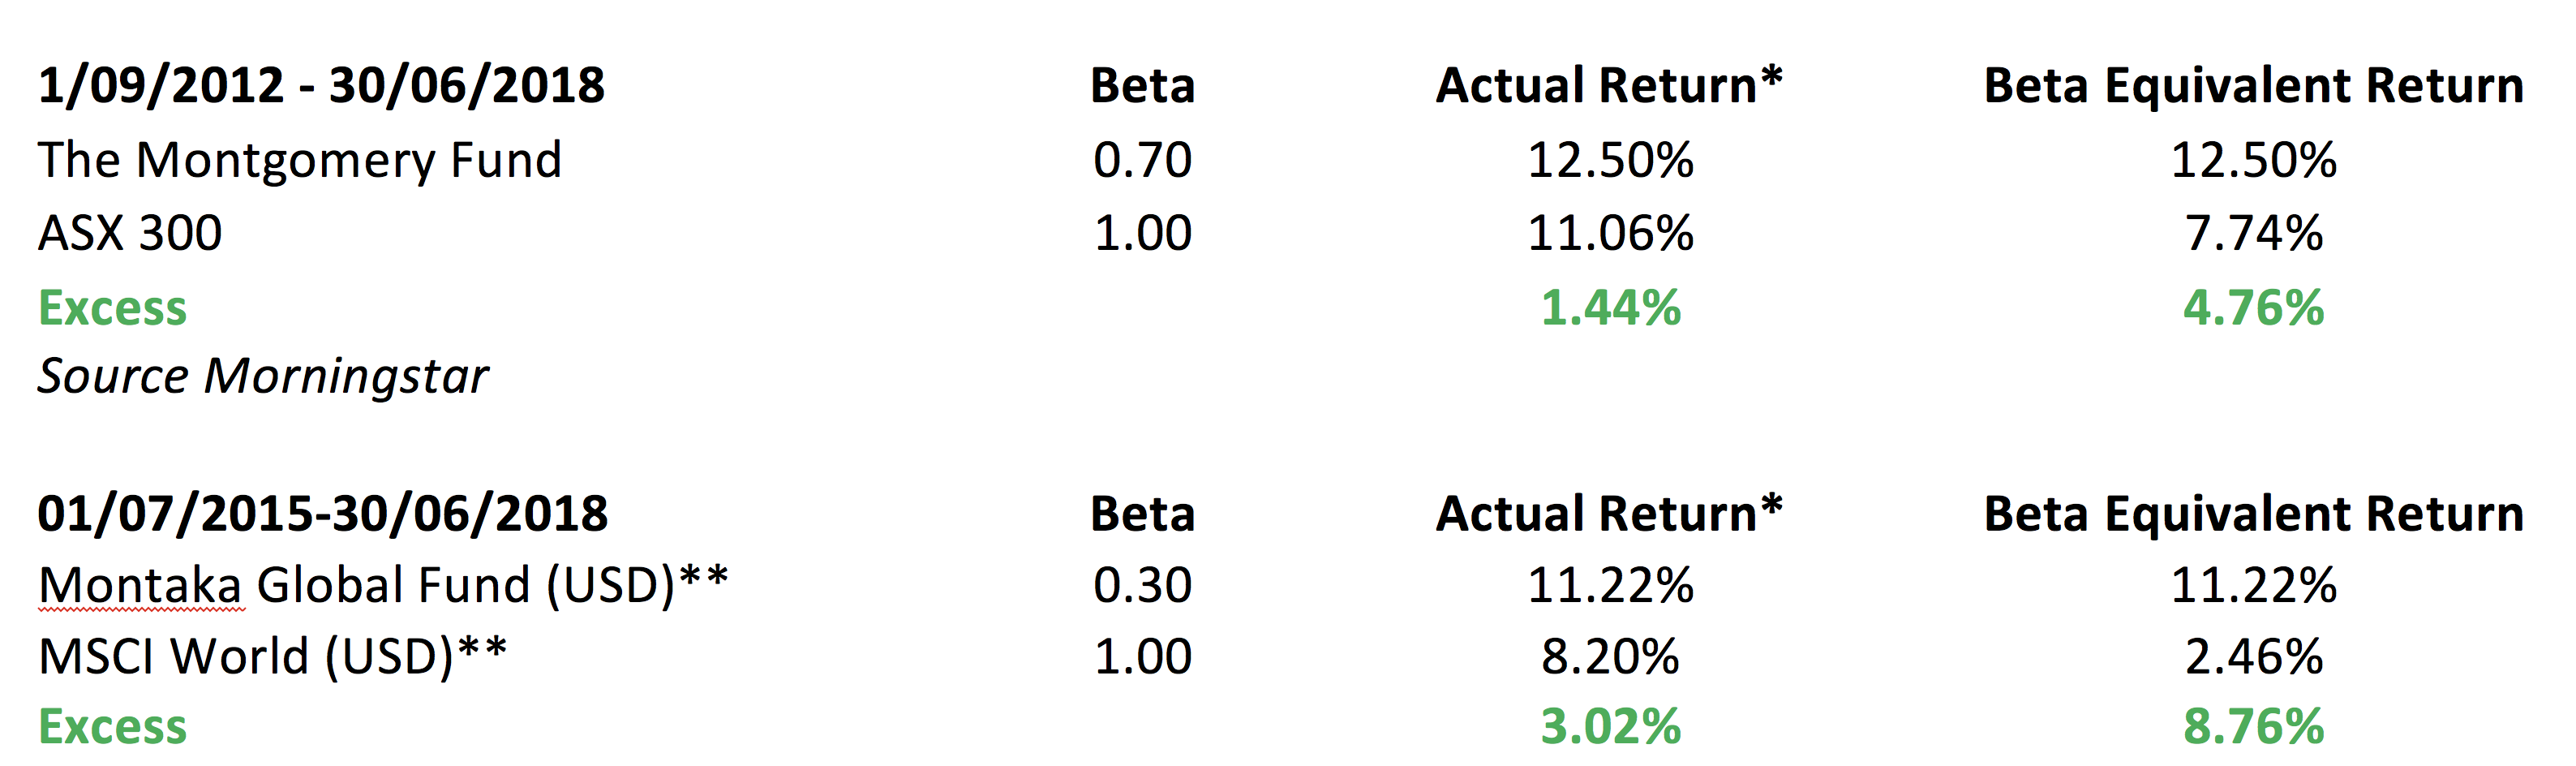
Source: CITCO, MGIM, Fundhost
*All returns shown are on an after-fee basis.
** I have used the USD returns for our global strategies to take away the volatility of currency (and the AUD).
As illustrated in the final column, if we adjust the respective markets return (ASX 300 and MSCI World) by multiplying it by the Beta of each strategy, both strategies offer superior risk-adjusted returns for their investors. In fact, if you compare the excess return under the actual return column verse the Beta equivalent return for each strategy, the risk-adjusted excess return in both scenarios more than doubles. Using the Beta allows us to compare the returns of each strategy against the market on a more like for like basis from a risk perspective.
2. Sharpe Ratio
The Sharpe ratio, by definition, is the average return generated by an investment above the risk-free rate (or cash rate), divided by the standard deviation of the same investment. Said another way, Sharpe allows us to measure the excess return a strategy can generate per unit of risk (or volatility). In the case below, I have sourced the standard deviation and Sharpe (geometric) for the same two strategies in question:
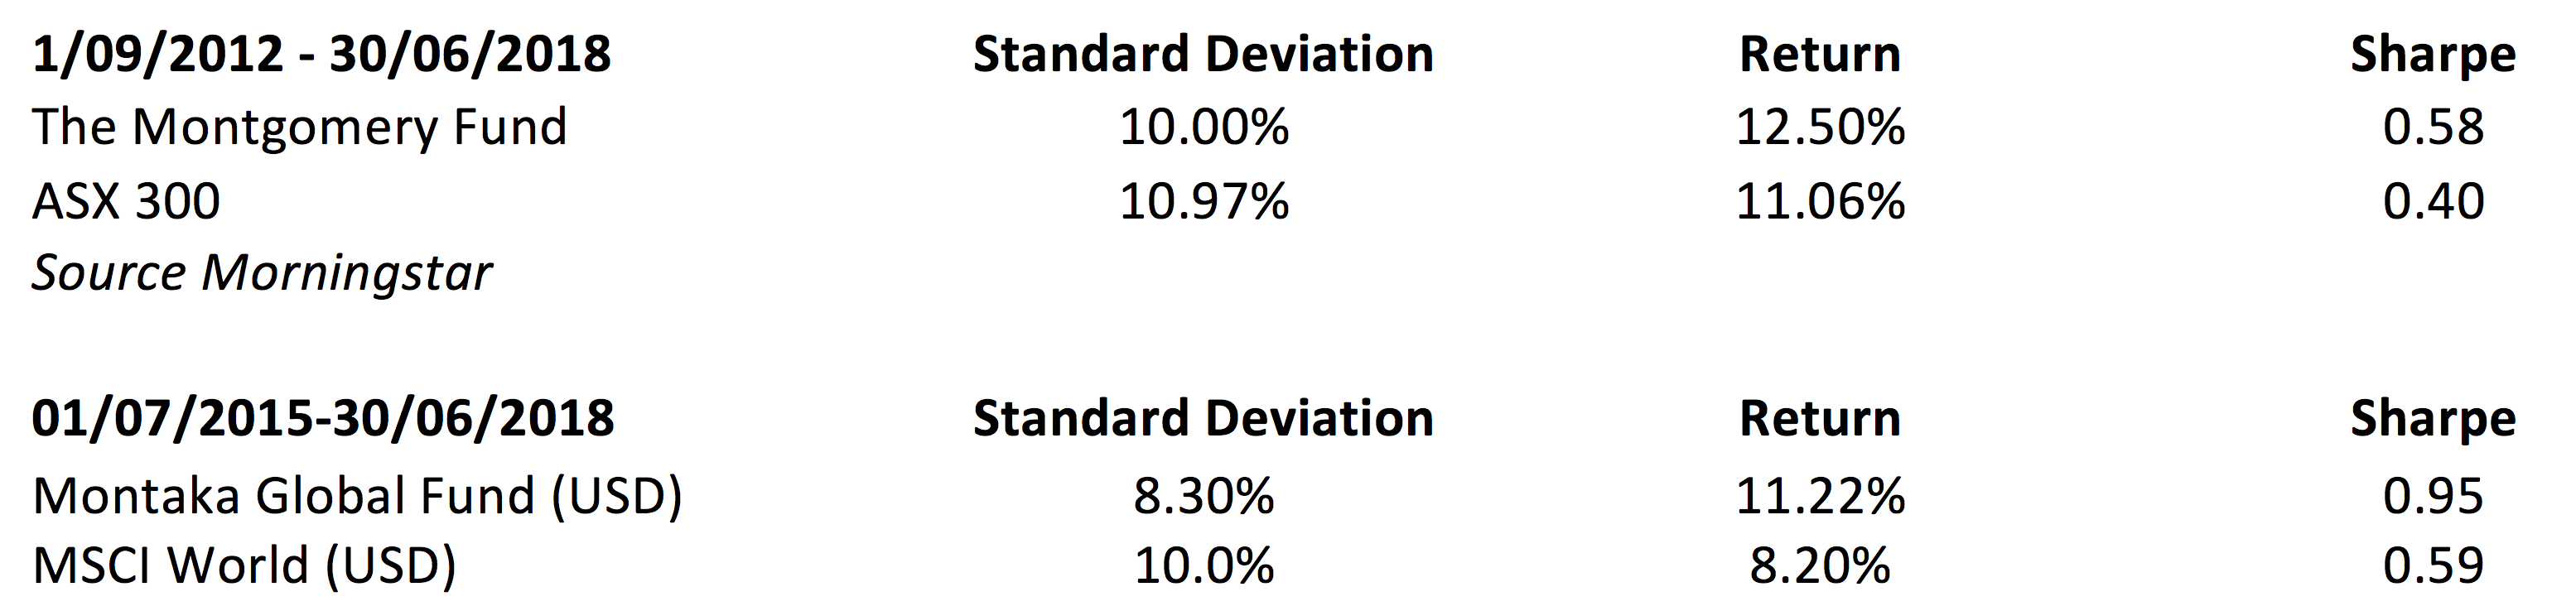
Source: CITCO, MGIM, Fundhost
From the above, the first thing to note is that both strategies have experienced lower volatility by measure of standard deviation when compared to that of the market. The second thing that is evident is that if we compare the Sharpe of each strategy against the market in the final column, pleasingly both strategies also have a higher Sharpe, meaning both strategies on this metric have superior risk-adjusted returns.
Wrapping it all up
Believe it or not, my intention in putting together this post was to not give people nightmares in revisiting basic statistical measures from high school or university (albeit your author did have some interesting flash backs!). The above two measures are a good way for investors to consider the effectiveness of risk management practices but are by no means the only ways to do so. In fact, these measures are more effective for assets whose returns can be explained by standard deviation as a measure of variance compared to the market (versus some assets whose returns aren’t normally distributed, such as options or derivative trading strategies that have non-linear risks).
Through both examples it is evident that The Montgomery Fund and the Montaka Global Fund offer investors unique risk-adjusted characteristics from a portfolio construction point of view. Notably, the returns of a long-only strategy versus a long/short strategy are different on an absolute and risk-adjusted basis. This does not suggest that investors should favour one over the other, it simply suggests there are different ways by design both strategies account for risk. In a world where equities have been on the rise for nine years, both globally and domestically, it may be time for investors to start thinking about whether they are appropriately compensated for the risk they are taking when investing in equities.
Dean Curnow joined Montgomery Investment Management in June 2016.
Dean joined the firm from Colonial First State, where he was a Consultant for Retail Sales for 2 years.
Prior to this, Dean was also a Relationship Manager with the Commonwealth Bank of Australia, where he spent 5 years working in Retail Banking.
This post was contributed by a representative of Montgomery Investment Management Pty Limited (AFSL No. 354564). The principal purpose of this post is to provide factual information and not provide financial product advice. Additionally, the information provided is not intended to provide any recommendation or opinion about any financial product. Any commentary and statements of opinion however may contain general advice only that is prepared without taking into account your personal objectives, financial circumstances or needs. Because of this, before acting on any of the information provided, you should always consider its appropriateness in light of your personal objectives, financial circumstances and needs and should consider seeking independent advice from a financial advisor if necessary before making any decisions. This post specifically excludes personal advice.