
Then and now: A history of financial year returns across major asset classes
Fiscal year 2020 will be a year remembered for low-interest rates, growing geopolitical tensions, a black swan pandemic, broad sweeping fiscal bazookas and of course arguably one the largest asset sell downs and retracements in history – have I missed anything?
Investors have experienced a lot of interesting, unprecedented, and unpredicted market movements throughout fiscal year 2020. This article looks to review the investment experience throughout the 12 months to 30 June 2020 across major asset classes and put this into perspective over the last 30 years.
There were a few winners in fiscal year 2020, as captured in the blue bars in Graph 1 below. US Shares were the best performing asset class over the 12 months to 30 June returning 9.60 per cent, closely followed by International Bonds (Hedged) at 5.40 per cent and International Shares at 5.20 per cent. This is quite impressive given the tumble most major equity markets experienced in March. Moreover, at the time of writing the S&P 500 Index is closing in on its February 19 high, which once passed, would award it the fastest bear market recovery on record. At the other end of the ledger were Australian Shares, International Listed Property and Australian Listed Property, all of which are still underwater from fiscal year 2020. Interestingly, Australian Listed Property, US Shares and International Listed Property were the best performing asset classes respectively in fiscal year 2019.
Graph 1: Total Returns Best, Worst and Financial Year 19/20
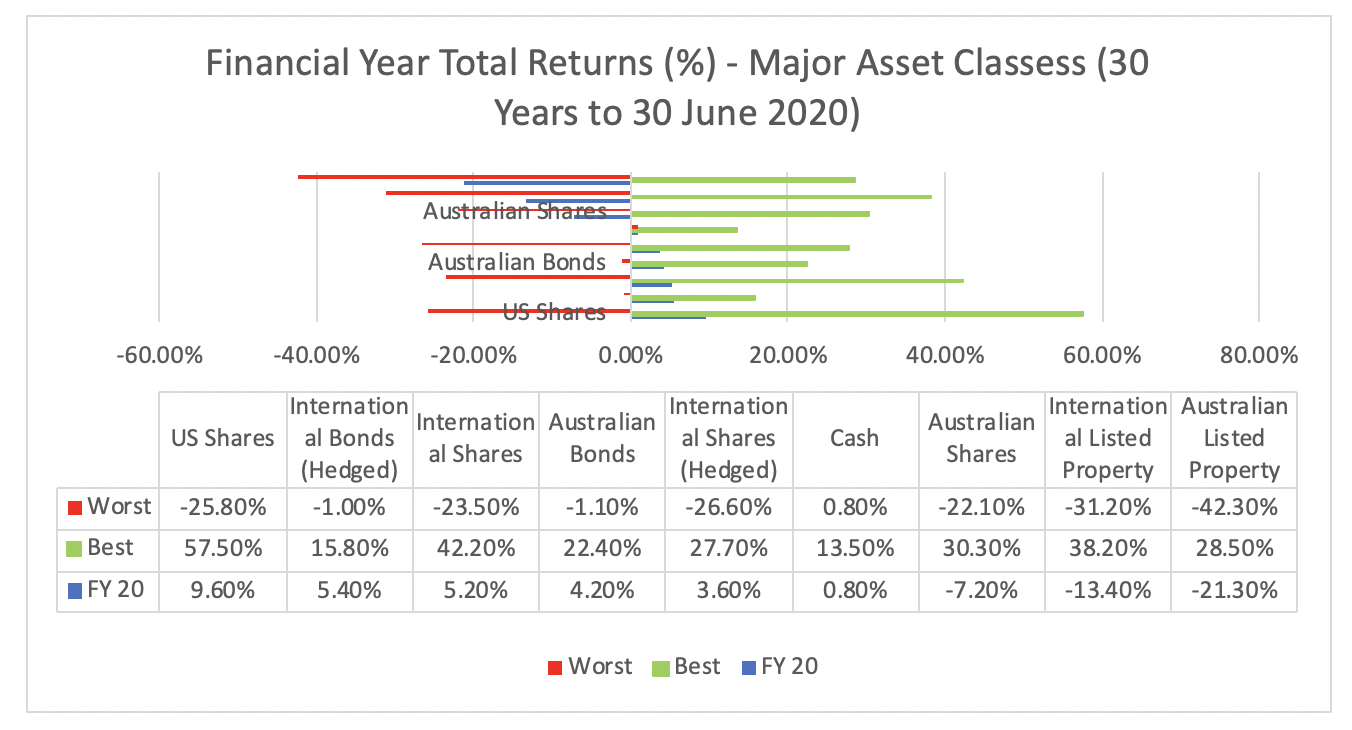
Source: Vanguard/Montgomery
While in 2020 no asset classes boasted their best performing fiscal year, it is interesting to note that one asset class, cash, produced its worst-returning fiscal year in the last 30 years of 0.8 per cent. Whilst this shouldn’t surprise, it is still fascinating to observe how this has changed over the last 5, 10 and 30 years to 30 June, all captured in both Graph 2 and Table 1 below.
So, what inferences can we draw from this, if any?
Firstly, and very simply, yesterday’s winner won’t necessarily be tomorrow’s victor. Although US equities have had a strong couple of years, International Shares have outperformed over the last 5 years (and vice versa over 10 and 30 years). Those who have averaged stronger returns over the last 5 and 10 years versus their 30-year average include International Shares and Internal Shares (Hedged), while Australian Shares, Australian Bonds, International Bonds (Hedged) and Cash have been under-performers over the last 5 and 10 years versus their 30 year average. In many ways this is why diversification at the asset level makes sense, not only from a risk perspective but also from a correlation of returns perspective. Importantly, the drivers of returns behind these asset classes can change (albeit slowly) overtime which does have implications for traditional asset allocation. Case in point, cash!
Graph 2: Total Returns 5-year, 10-year, 30-year average and Financial Year 19/20

Table 1: Winners and Losers 5-year, 10-year and 30-year average
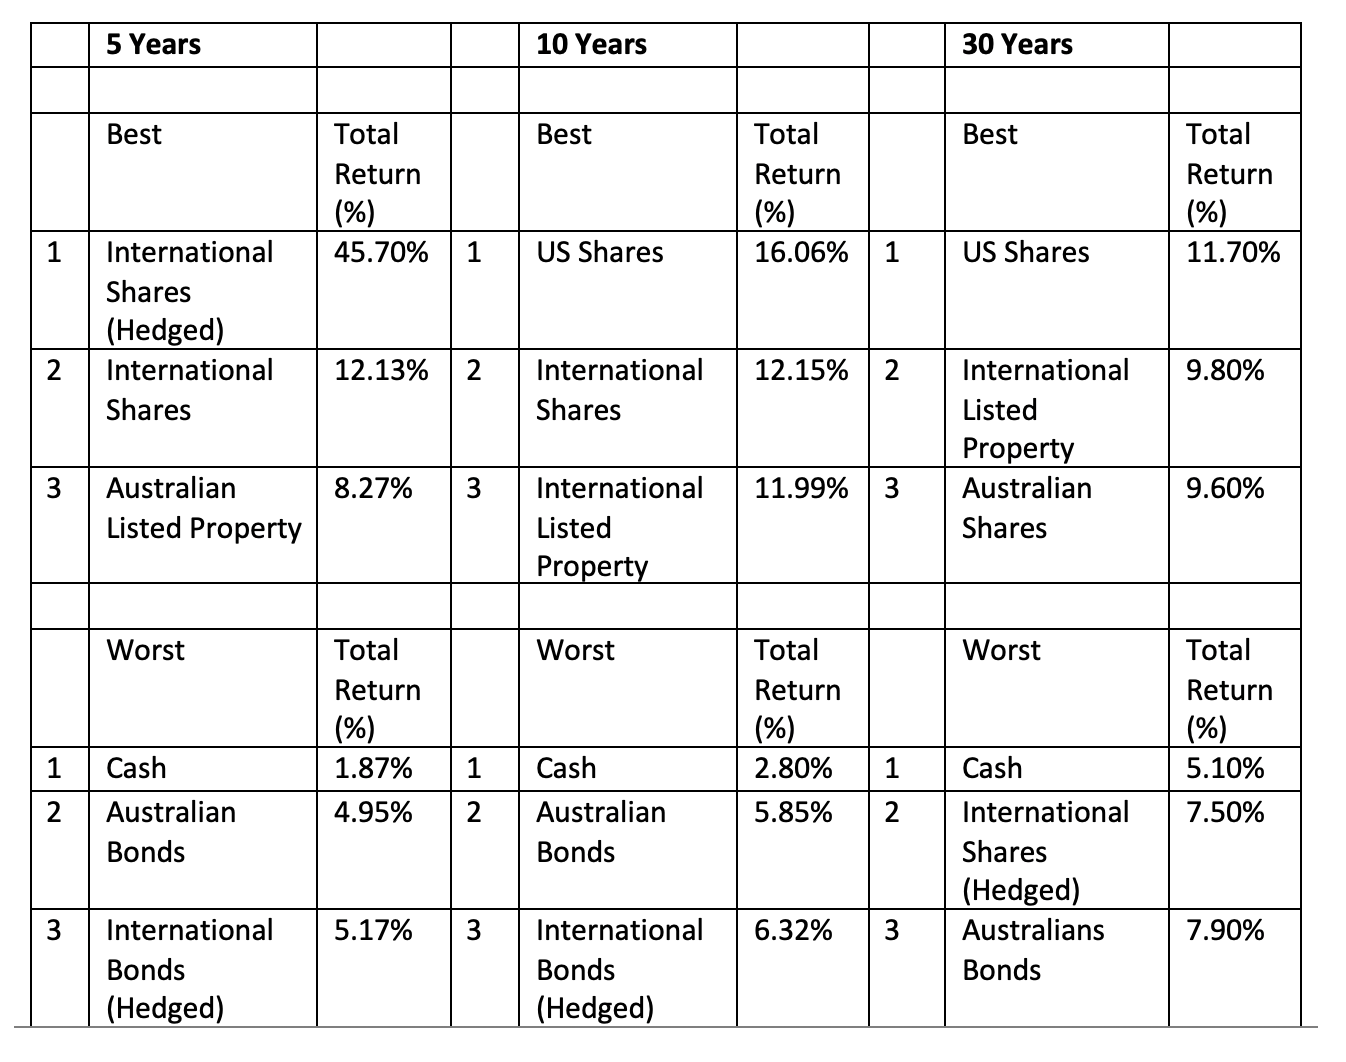
Source: Vanguard/Montgomery
The second inference might also be an obvious one too, but if you have a long-term time horizon it pays to stay invested. For example, if you recently sold down your investment in equities at market bottom March 23, you would have missed the following market rebounds (as at the time of writing): US Shares 53.36 per cent, International Shares 20.61 per cent and Australian Shares 28.37 per cent. Hence why many have also cited the recovery to date as a painful one – for those who sold out.
If we look to Table 2 below, in looking at the worst fiscal years across the major asset classes in equities over the last 30 years, the second column notes the percentage return an investor would have to achieve to recover those losses in the subsequent years. The final column illustrates the number of years it would take to recover that loss based on the 10-year average fiscal year return across those asset classes which is previously captured in Graph 2. There can be challenges to the laws of average returns in that a negative fiscal year can be followed by another negative fiscal year which we saw in 2008 and 2009. However, it is very hard to predict this and history proves investors in the context of growth assets are best to stay invested for the long-term and will be rewarded for doing so. Now for what the next 10 years will bring? Remind me to update you all in 2030!
Table 2: Mathematics of Loss Recovery
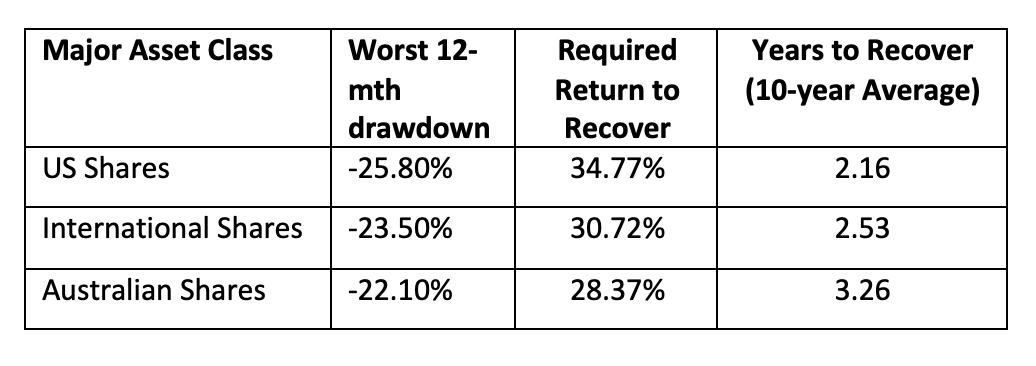 Source: Vanguard/Montgomery
Dean Curnow joined Montgomery Investment Management in June 2016.
Dean joined the firm from Colonial First State, where he was a Consultant for Retail Sales for 2 years.
Prior to this, Dean was also a Relationship Manager with the Commonwealth Bank of Australia, where he spent 5 years working in Retail Banking.
This post was contributed by a representative of Montgomery Investment Management Pty Limited (AFSL No. 354564). The principal purpose of this post is to provide factual information and not provide financial product advice. Additionally, the information provided is not intended to provide any recommendation or opinion about any financial product. Any commentary and statements of opinion however may contain general advice only that is prepared without taking into account your personal objectives, financial circumstances or needs. Because of this, before acting on any of the information provided, you should always consider its appropriateness in light of your personal objectives, financial circumstances and needs and should consider seeking independent advice from a financial advisor if necessary before making any decisions. This post specifically excludes personal advice.
Hi Dean
Thanks for a good article.
Does the Australian share return include dividends or only the increased share price?
Hi Julian, thanks for taking the time to read! The Australian Share return is represented by the S&P/ASX All Ordinaries Accumulation Index, which is the total return including dividends and capital growth. Kind regards, Dean Curnow.