
The smashed avocado index – episode 2
Last month we created our own smashed avo index as a tongue-in-cheek way of analysing housing price affordability. The reception since then has been more than we anticipated and there’s probably a couple of points to note up-front.
- This is not a rigorous analysis of housing price affordability.
- There’s little to take-away from this index in terms of learnings or policy implications – it’s only a simple comparative analysis which may suggest why some consumers may prefer the luxuries of life over saving for a house (particularly if rents are considered more affordable).
We’ve also noticed the theme popping up in other areas, Bloomberg’s Matt Levine in his daily Money Stuff newsletter mentioned the SoFi mortgage – any customers taking one out will receive a months’ worth of avocados and bread delivered to their door in a series of three shipments.
Alas! Perhaps then my work here on smashed avo toast is redundant – home buyers can clearly have their house and eat smashed avo too (an interesting take on having your cake and eating it too…).
None-the-less, we’ve again run the smashed avo index to update the market on just how many brekky-less years they’ll have to endure before purchasing their own slice of the Australian dream (i.e. smashed avo on toast).
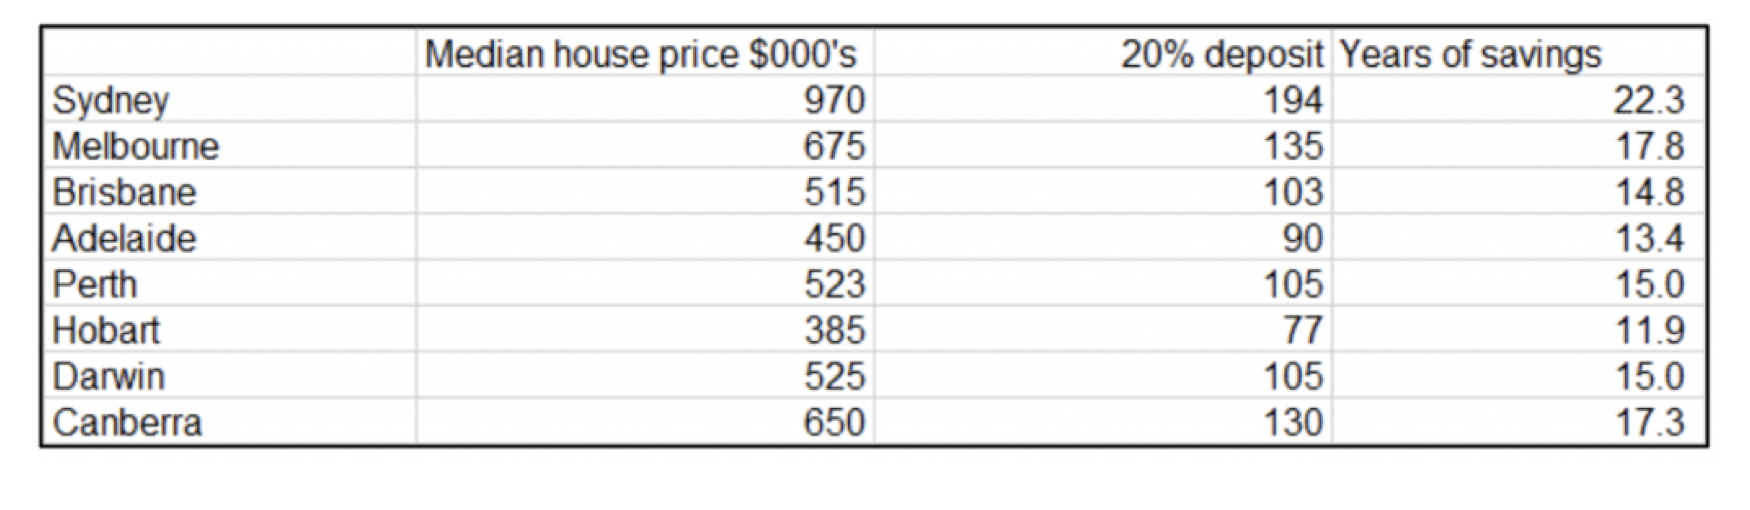
Now last month’s results were as follows:
Updated:
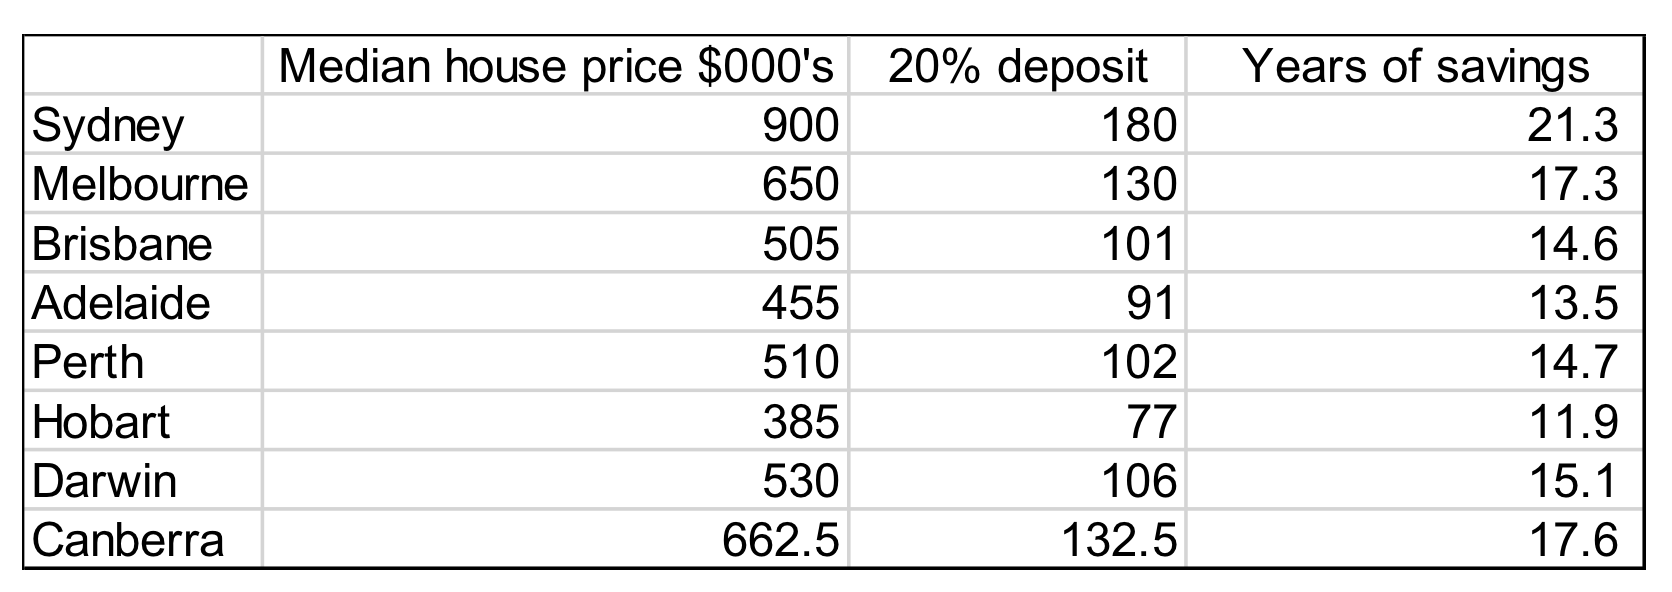
Readers might note that the median house prices seem a little more volatile than we’d normally expect for the housing market (e.g. last time the median house price in Sydney was $970,000 and now it’s $900,000). The data is from the ABS and it seems to be subject to revisions over time – hence a grain of salt should when examining our outputs.
That said, it looks like brekky is a little more within reach this time. The years of saving for most cities seems to have reduced – particularly Sydney with a 1 year reduction and Melbourne at 6 months.
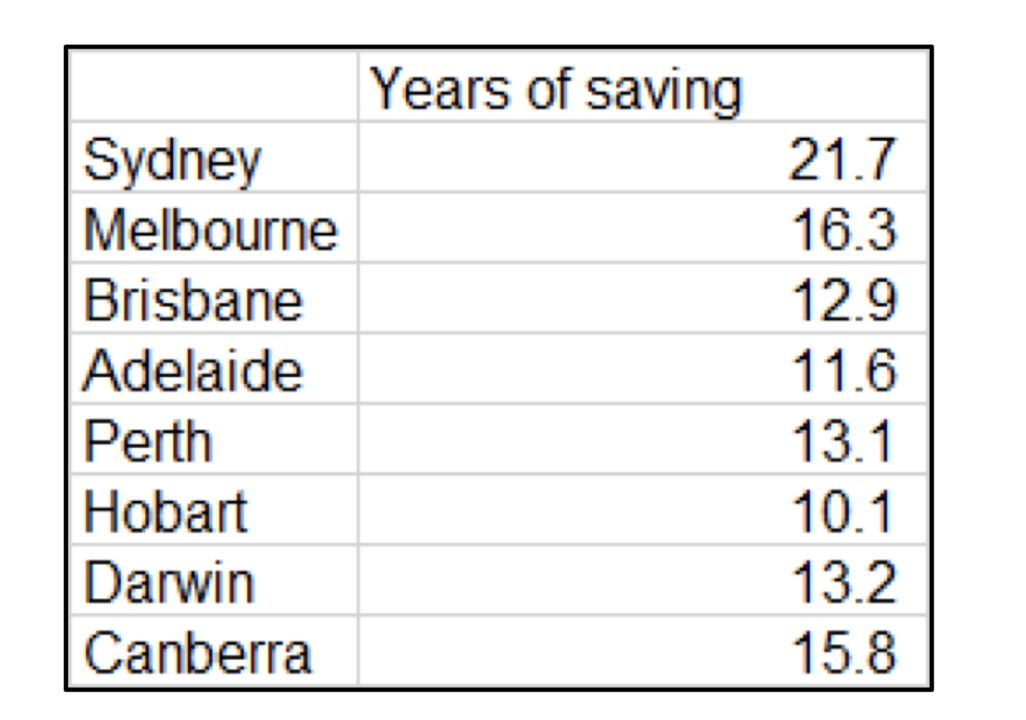
As prior, we also want to incorporate a consideration that housing may appreciate over time but also may be subject to a crash at some point. Last time we assumed that housing prices grow at 2.5% p.a. and that property crashes 30% tomorrow and these results are below.
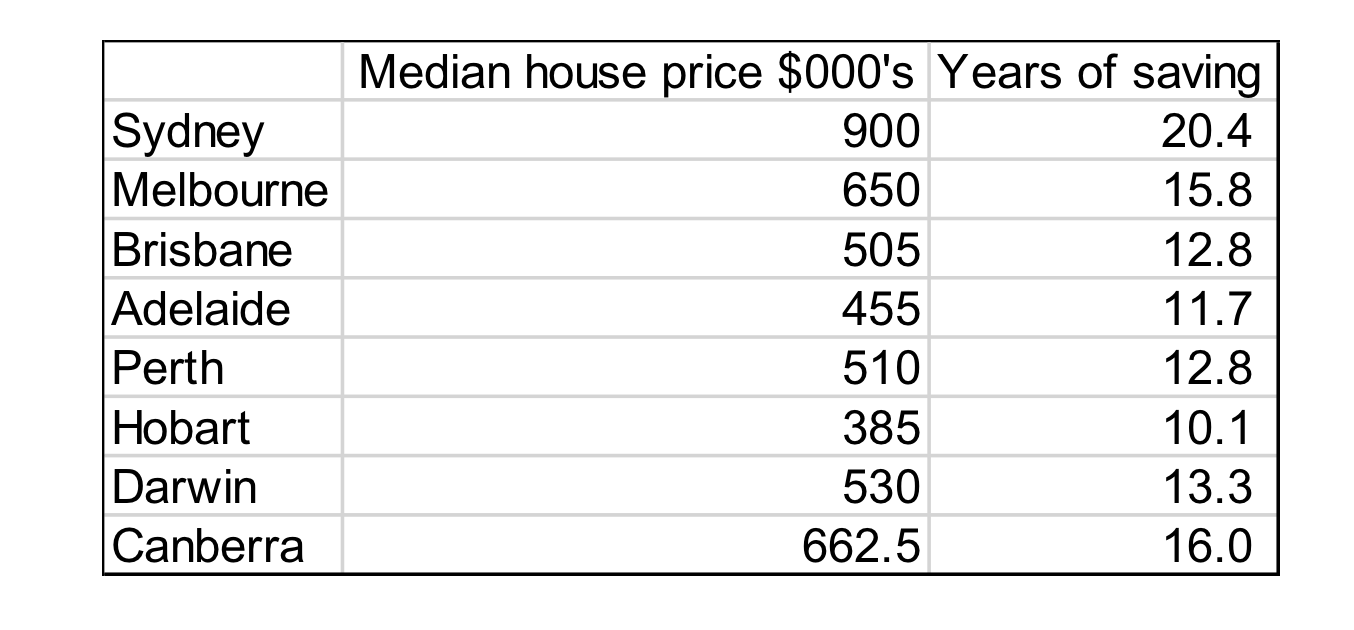
Finally, we present the updated numbers. Again, it appears that avo on toast will return sooner in Sydney noting the 1.3 years reduction with marginal reductions/increases in saving time in other cities.
This post was contributed by a representative of Montgomery Investment Management Pty Limited (AFSL No. 354564). The principal purpose of this post is to provide factual information and not provide financial product advice. Additionally, the information provided is not intended to provide any recommendation or opinion about any financial product. Any commentary and statements of opinion however may contain general advice only that is prepared without taking into account your personal objectives, financial circumstances or needs. Because of this, before acting on any of the information provided, you should always consider its appropriateness in light of your personal objectives, financial circumstances and needs and should consider seeking independent advice from a financial advisor if necessary before making any decisions. This post specifically excludes personal advice.
INVEST WITH MONTGOMERY