
The market in five charts and four economic indicators
In this blog post, I (finally) take the focus off the artificial intelligence (AI) boom/bubble. Instead, I want to look at whether there are other factors investors should be considering when it comes to time to rebalance portfolios, and as 2025 concludes and 2026 commences.
First – and granted this one’s a bit of fun – the Santa Claus rally. Is there any evidence that such a thing exists?
The Santa Claus rally was first recorded by Yale Hirsch in his Stock Trader’s Almanac in 1972. According to Wikipedia, the ‘Santa’ rally is a calendar rise in stock prices during the last five trading days in December and the first two trading days in the following January. According to the 2019 Stock Trader’s Almanac, the stock market has risen 1.3 per cent on average during the seven trading days in question since both 1950 and 1969. Over the seven trading days in question, stock prices have historically risen 76 per cent of the time. Most interestingly, there is no generally accepted explanation for the rally, which could mean it’s just a coincidence or that it’s more reliable.
Also interesting is that, historically at least, the Dow Jones Industrial Index has performed better in years following holiday seasons in which the Santa Claus rally hasn’t materialised.
Equities remain in heavily overbought territory when viewed through the lenses of traditional valuation metrics. In addition, the U.S. jobs market is faltering and most consumers are struggling. Despite this however the U.S. central bank has cooled expectations of any further rate cuts this year.
Figure 1. Shiller CAPE Ratio
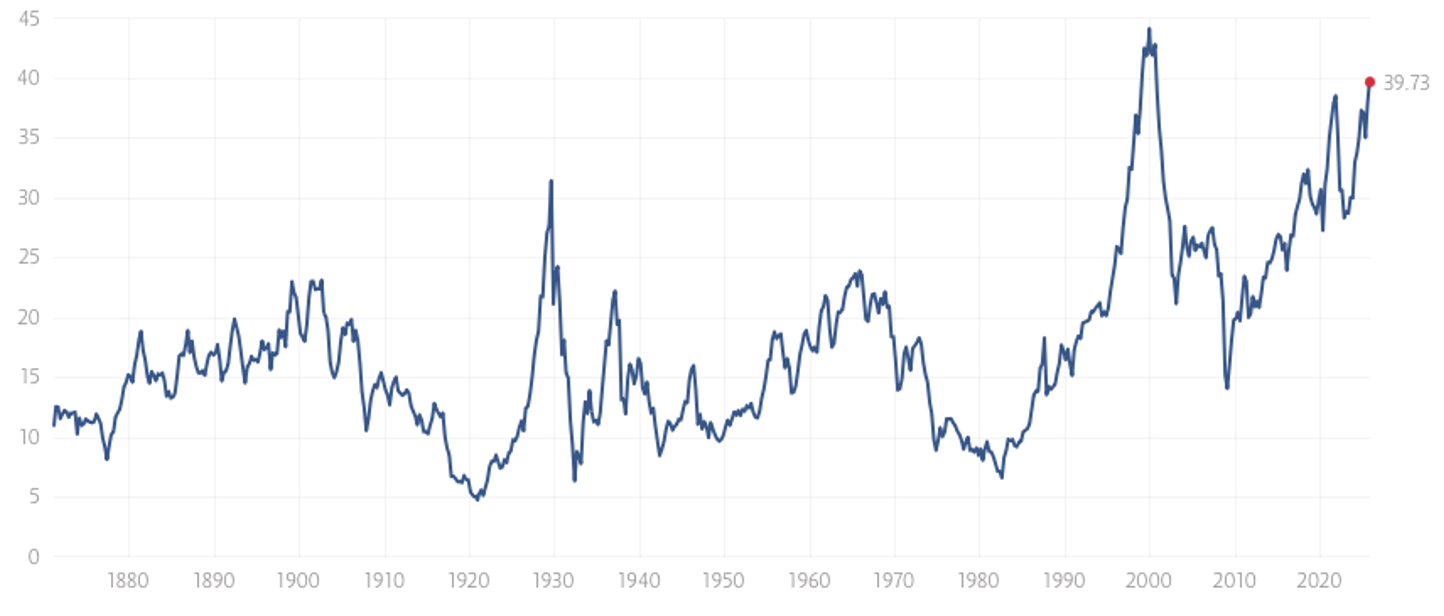
Source: Multpl
As Figure 1., reveals, the Shiller Cyclically Adjusted price-to-earnings (P/E) (CAPE) ratio remains higher than at any time since 1970, with the exception of the Tech bubble of 2000.
But Figure 2 shows that the 1-year forecast P/E of the top 10 stocks in the S&P 500 is higher than it was during the original tech bubble.
Figure 2. Are valuations more stretched than the Tech bubble of 2000?
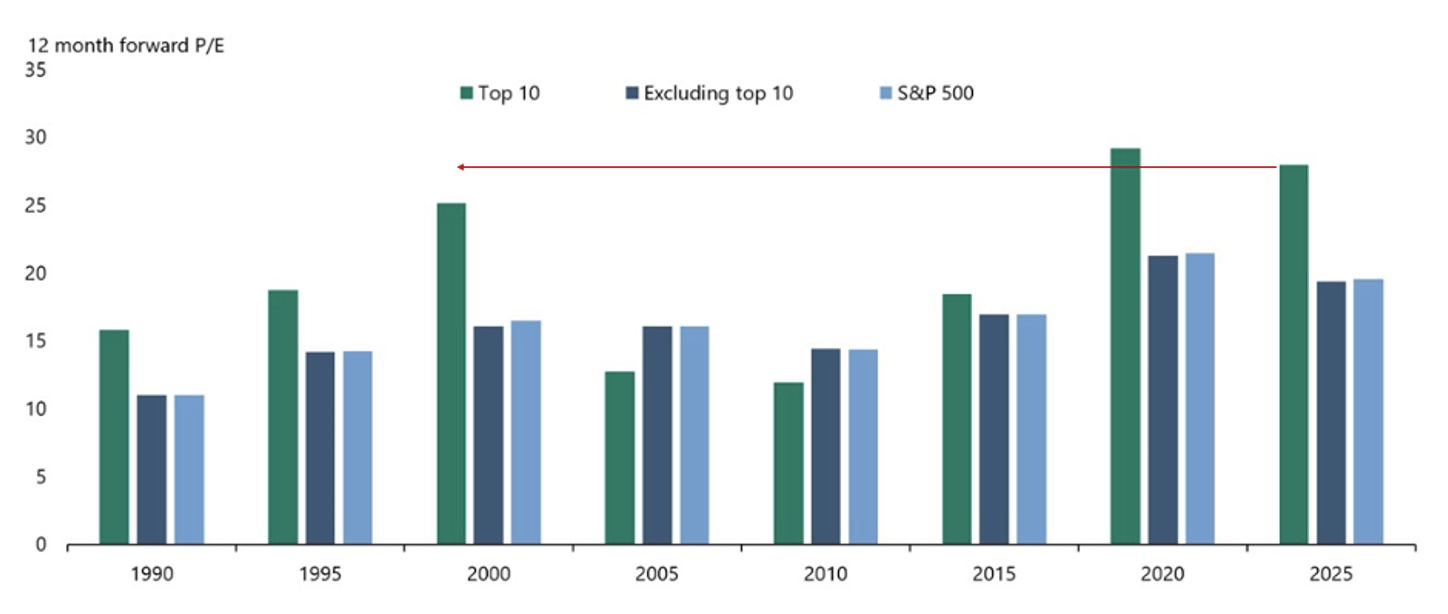
Source: Torsten Slok
Whether it’s the 1-year forward P/E of the top 10 stocks, the Shiller CAPE Ratio, price-to-book, or Market Cap to Value Added, all measures are showing the stock market is at stretched or record valuations. People are willing to pay more for a single dollar of earnings, than they’ve been willing to pay ever before.
Figure 3. Most expensive in 100 years
(S&P 500 average of P/E, Forward P/E, CAPE, Price to Sales (P/S), Enterprise Value to Earnings Before Interest, Taxes, Depreciation and Amortization (EV/EBITDA), Q Ratio, Market Cap-to-gross domestic product (GDP))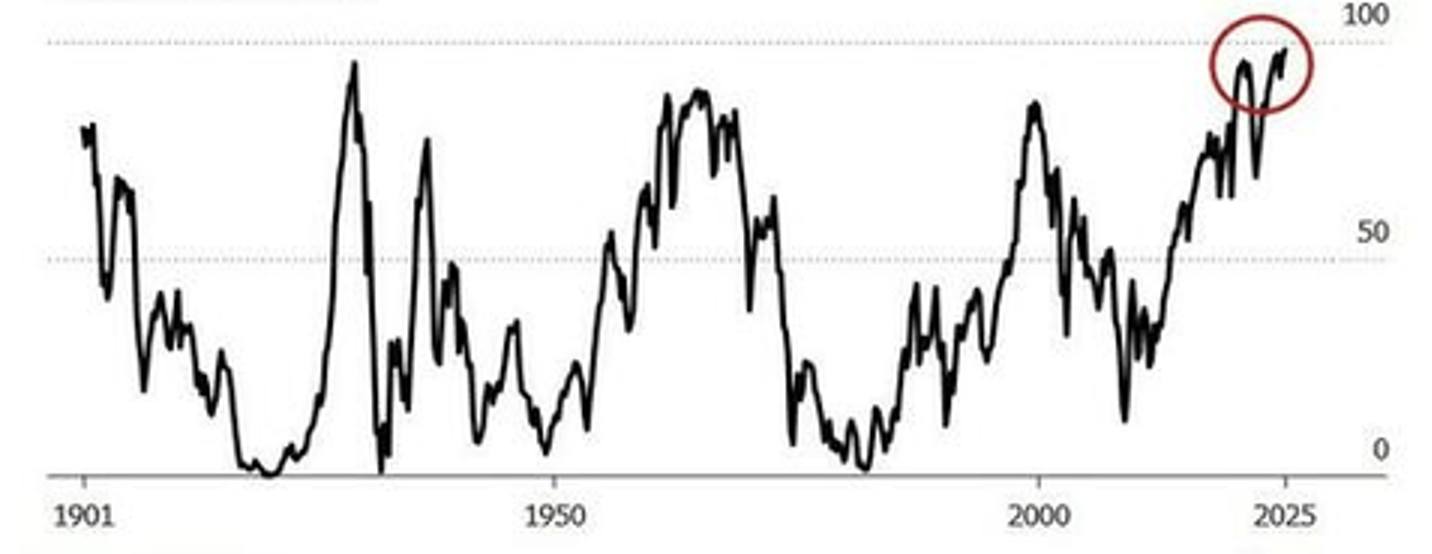
Source: Bloomberg
Then there’s Equity Premium. Usually, investors demand a higher earnings yield from equities than the yield available on bonds. This makes sense because equities are perceived as riskier, and a higher yield compensates for the risk.
But when investors are enthusiastic, they might ignore this important and rational ratio, for a time. And that’s what they are doing now. Figure 4., reveals the spread between the S&P 500 earnings yield (which is just the inverse of the P/E ratio) and the U.S. 10-year Treasury bond yield has been negative for a while. In other words, investors are happy to accept a lower earnings yield for equities than the yield on U.S. 10-year Treasury Bonds.
Figure 4. Negative Equity Yield Premium
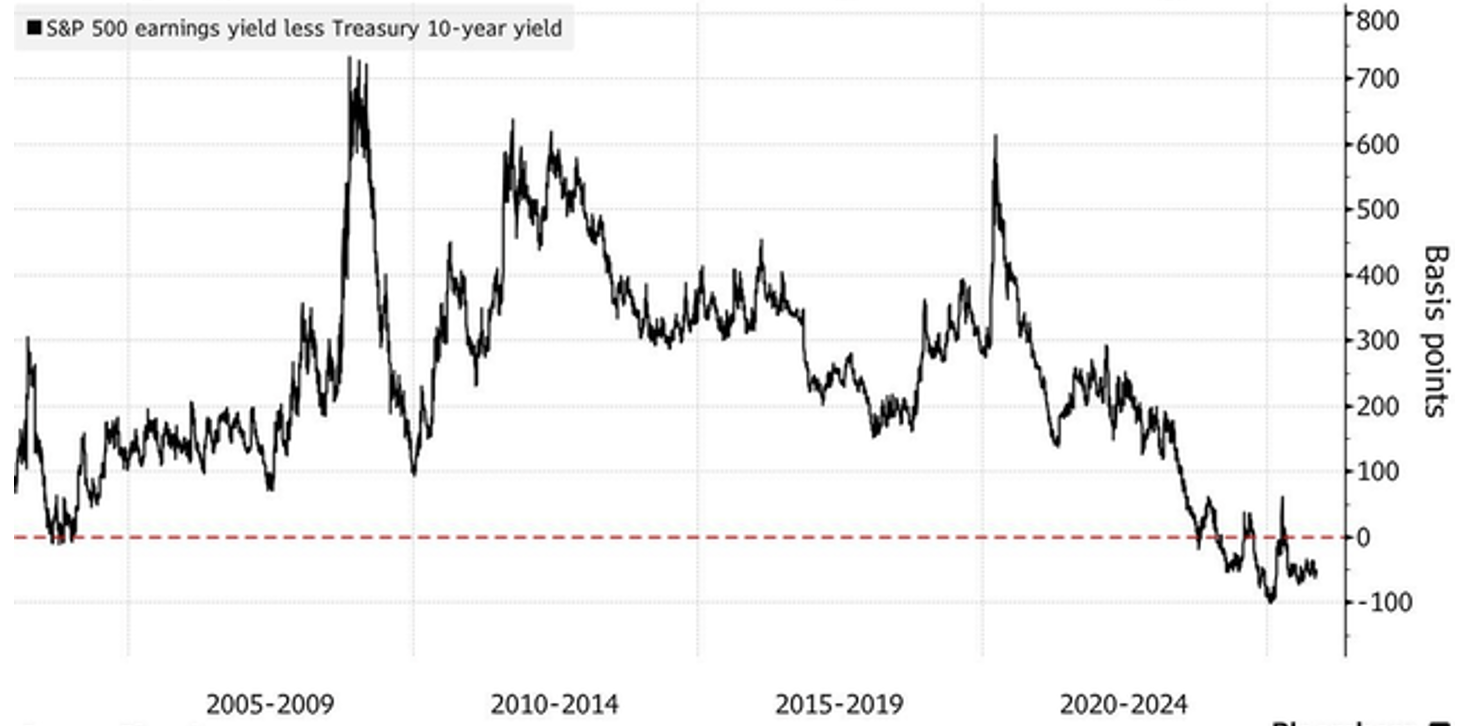
Source: Bloomberg
My personal read is that Bloomberg’s measure is the result of using historical P/E ratios rather than 1 year forward P/E ratios to arrive at the S&P 500’s Earnings Yield. The current 1 year forward P/E is 24.31 according to Y-Charts and 22.7 according to Factset. Inverted, they corresponded to earnings yields of 4.11 and 4.40, respectively. Given the U.S. 10-year Treasury Yield is 4.119 per cent, the spread is between zero and +28 basis points. Either way, there does not seem to be a sufficient premium available from equities.
Meanwhile, the S&P 500’s dividend yield is usually a lot lower than the S&P/ASX200 because Australian companies are incentivised by the existence of franking credits, which have no value to them, to pay more of their earnings out as a dividend. That explains why dividends are higher here and growth is higher there. Without franking credits in the U.S., companies there find stock buybacks are a more tax efficient way to hand money back to shareholders.
Despite a usually lower dividend yield however, the S&P 500’s yield is low today compared to its own long-term averages and range.
Figure 5. S&P500 Dividend Yield
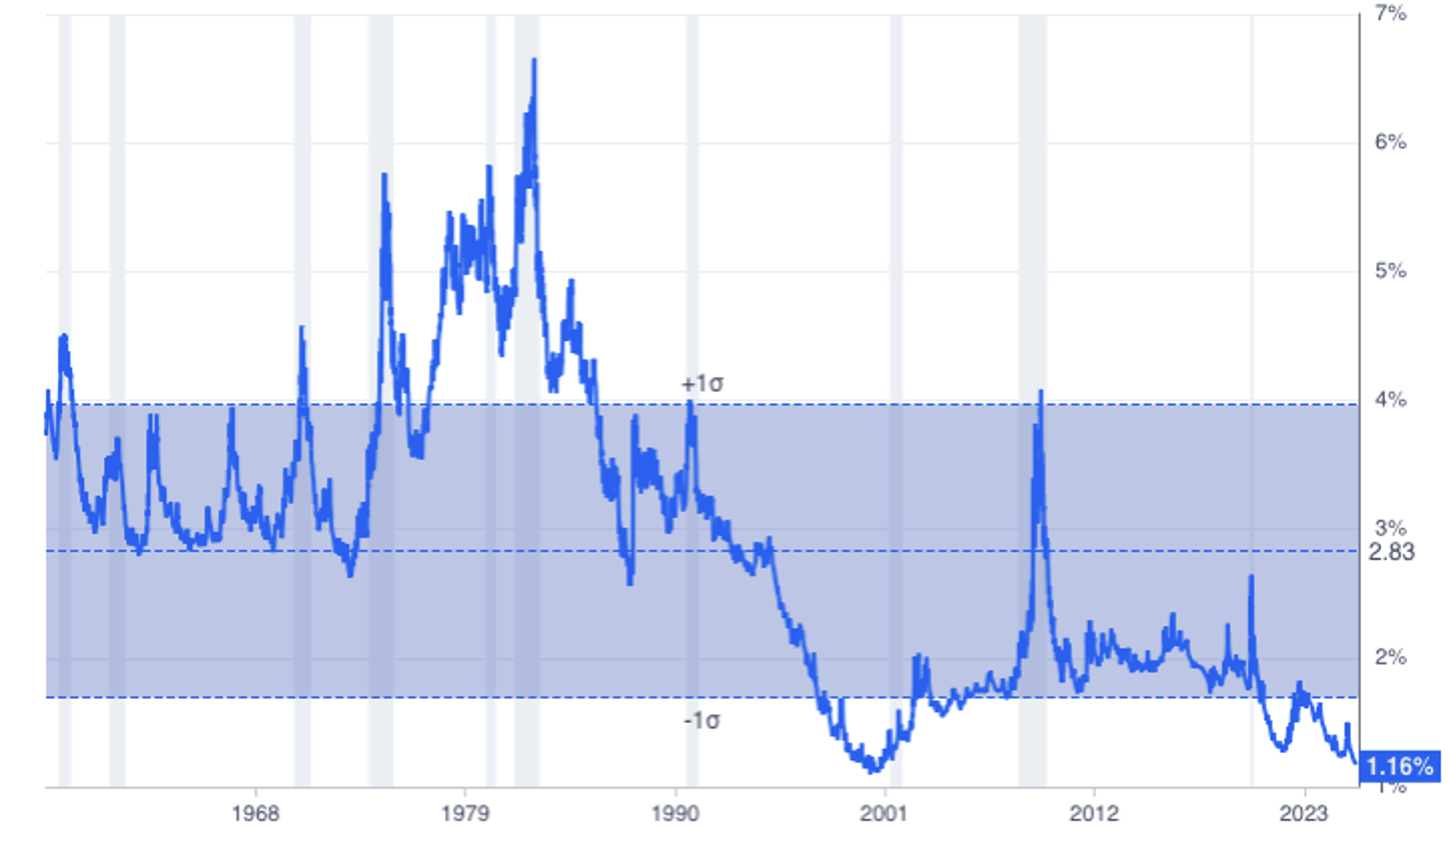
Source: GuruFocus
As Figure 5., reveals, since 1957, the lowest dividend yield registered for the S&P 500 was 1.09 per cent at the very peak of the internet bubble on 23 March 2000. Today’s dividend yield of 1.16 per cent is close to equaling that record.
Of course, the above five charts all tell the same story: the market is expensive. The final items of interest relate to the state of the U.S. economy.
Jobs growth slowed dramatically during the northern hemisphere summer. Between June and August just 30,000 new jobs were created. Remember, the U.S. has a population of more than 350 million people. And since August, it appears jobs growth has turned negative. According to economists surveyed by Dow Jones, 60,000 jobs were lost in October. We should note the government shutdown U.S. prevented the September and October Bureau of Labor Statistics (BLS) jobs reports from being published.
Meanwhile, consumer loan delinquencies are rising, if not soaring, thanks to job losses and rising interest rates. By way of example, subprime auto loans more than 60 days in arrears have hit 6.65 per cent in October, according to Fitch. It’s the highest rate since records began in the early 1990s, meaning its higher than the global financial crisis (GFC) peak. At the same time, Repo men in the U.S. are having a great year. Auto repossessions are expected to reach three million in 2025, the most since the GFC in 2009.
Elsewhere, almost US$1.8 trillion worth of U.S. student loan debt is outstanding, with 5.3 million borrowers in default (over 270 days delinquent) and another 4.3 million borrowers between 181 and 270 days in arrears.
And finally, U.S. consumer credit card debt has recently hit a record US$1.21 trillion, while delinquency rates on credit card loans are moving significantly higher across all socio-economic groups and especially low-income consumers.
Remembering consumer activity contributes nearly 70 per cent of U.S. GDP., (and the rest is the AI build out), rising loan delinquencies and a worsening jobs market represent an unwelcome combination.
Roger Montgomery is the Founder and Chairman of Montgomery Investment Management. Roger has over three decades of experience in funds management and related activities, including equities analysis, equity and derivatives strategy, trading and stockbroking. Prior to establishing Montgomery, Roger held positions at Ord Minnett Jardine Fleming, BT (Australia) Limited and Merrill Lynch.
He is also author of best-selling investment guide-book for the stock market, Value.able – how to value the best stocks and buy them for less than they are worth.
Roger appears regularly on television and radio, and in the press, including ABC radio and TV, The Australian and Ausbiz. View upcoming media appearances.
This post was contributed by a representative of Montgomery Investment Management Pty Limited (AFSL No. 354564). The principal purpose of this post is to provide factual information and not provide financial product advice. Additionally, the information provided is not intended to provide any recommendation or opinion about any financial product. Any commentary and statements of opinion however may contain general advice only that is prepared without taking into account your personal objectives, financial circumstances or needs. Because of this, before acting on any of the information provided, you should always consider its appropriateness in light of your personal objectives, financial circumstances and needs and should consider seeking independent advice from a financial advisor if necessary before making any decisions. This post specifically excludes personal advice.