
The Case For and Against Consumption Growth: Part 2
Late last year, I discussed some of the main arguments underpinning a bearish outlook for the Australian consumer and, in turn, major bank loan book growth. But what about the counter argument? In particular, could the tightening labour market create stronger wage growth and thereby boost consumption?
The key to the bearish case is growing constraints on household discretionary spending from weak wages growth, rising non-discretionary costs, and the end to wealth effects from rising residential property prices that have allowed households to raise debt levels to fund consumption and property investment.
The key factor that could change is the assumption of weak household income growth. But recent statistical releases show labour market strength, suggesting that this could be turning. If the labour market can continue to tighten, any benefit to aggregate household income (and therefore disposable income) from more people being employed, could be further boosted by an acceleration in wage growth from its current low levels.
Accelerating household income through increased employment and eventually wage growth would offset rising household non-discretionary expenses, allowing discretionary spending to be maintained or even increased.
The labour force statistics released by the ABS indicate that the number of employed people has increased by an average of 38,000 per month since March. Despite the strong increases in the number of employed people, the unemployment rate has remained stubbornly stable at around 5.5 per cent.
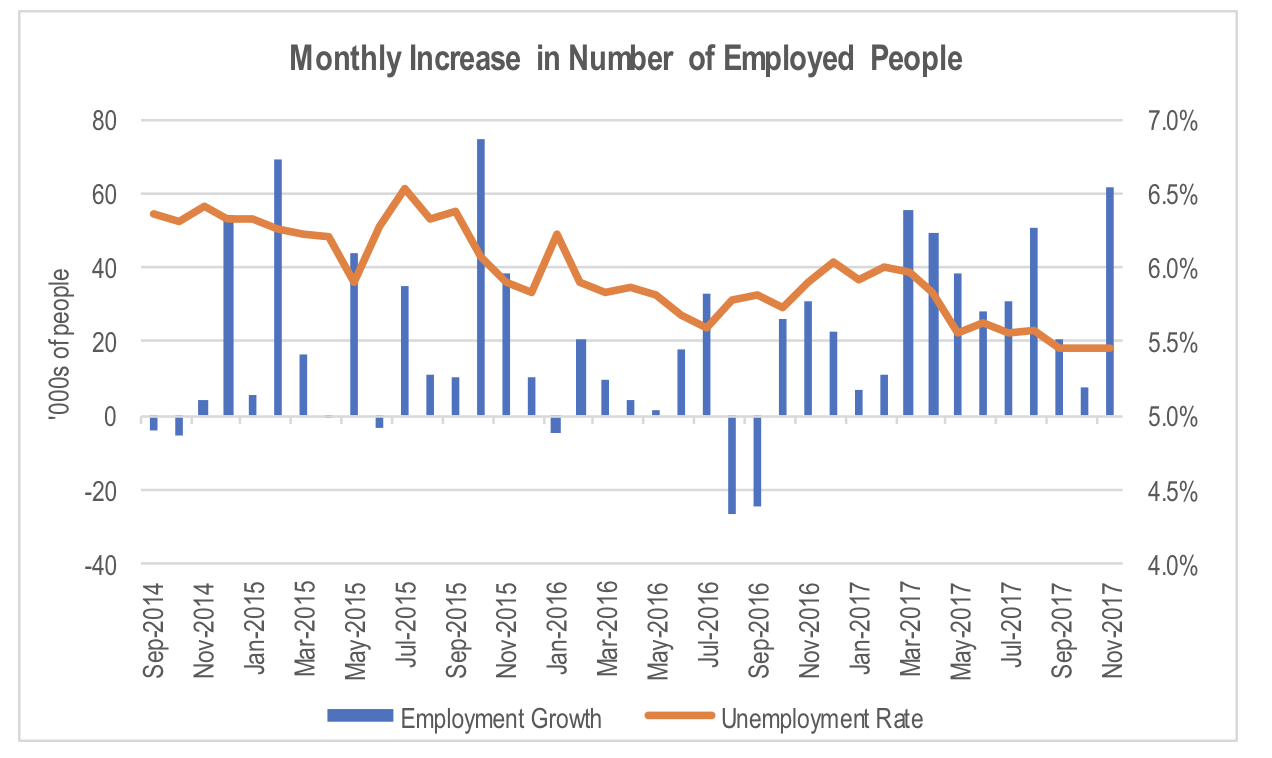
Strong employment growth is being offset by rising participation rates in the economy. This is why the unemployment rate has remained relatively stable over the last 6 months. The participation rate is the percentage of the population that either has, or is actively looking for a job. Non-participants include those that are retired, in full time education and not working, in unpaid work, or have given up looking for a job. It is the last two segments that provide the labour market with slack. Wage growth is likely to remain muted until this slack is removed from the market.
If we disaggregate the participation rate data, there are a few noticeable factors that explain the increase over the last 6 months.
The first is the significant increase in participation rate among females.
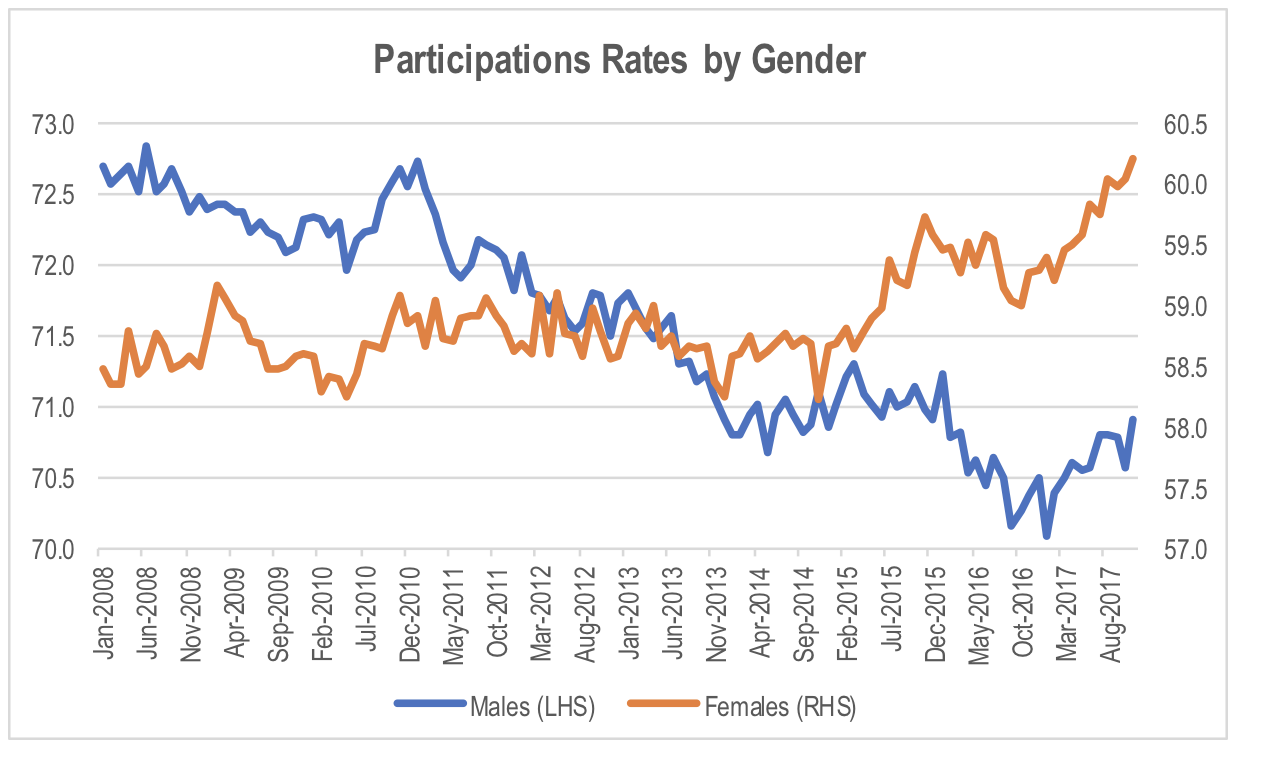
The participation rate among females began to break out to the upside in early 2015. If we look at female participation rate going back to the late 1970s, it had been rising steadily through time up until the GFC. From 2007, the female participation rate stalled at just under 60 per cent. However, in the last 3 years, it appears to have resumed its upward trend.
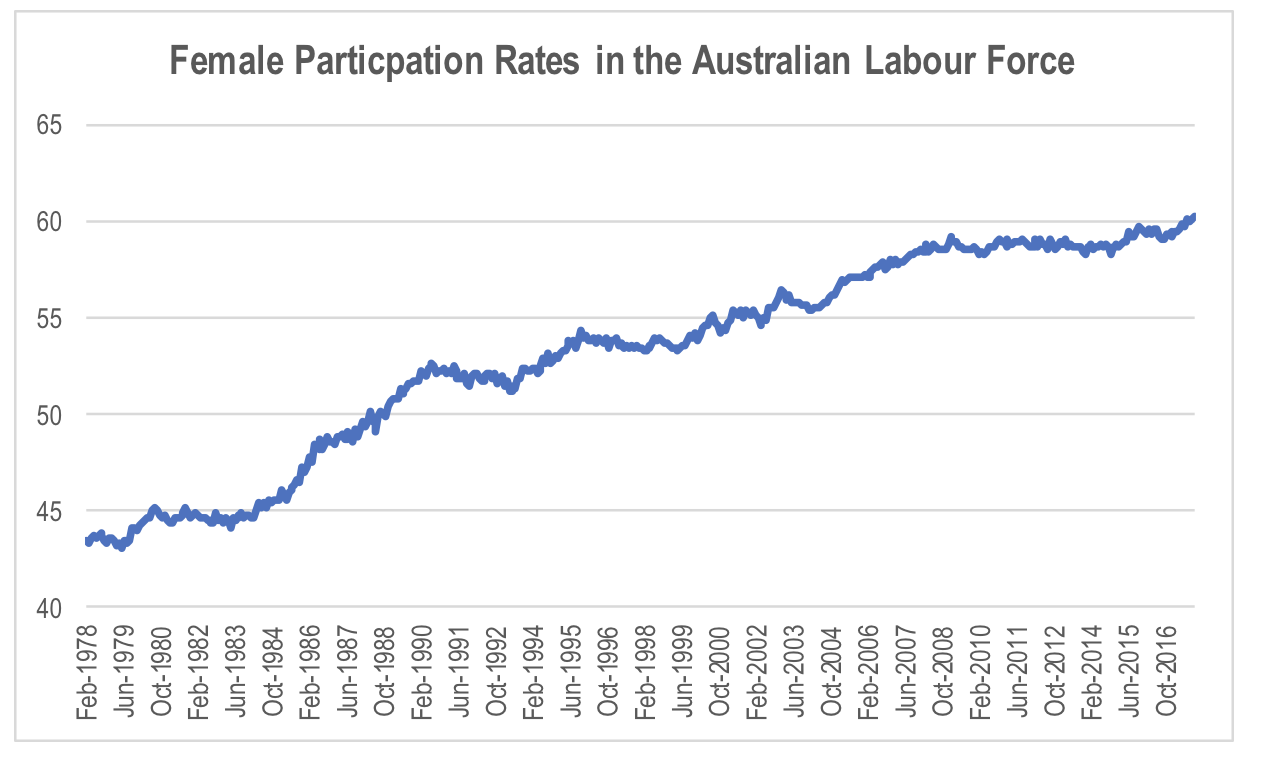
To the extent that the increase in participation among females is a reversion to the longer term trend, the increase represents underlying natural labour supply growth rather than a cyclical increase in supply driven by excess demand for labour. As such it is unlikely to result in upward pressure on wage growth.
If we look at the industries that have been driving the increased rate of employment growth, healthcare has been noticeably strong.
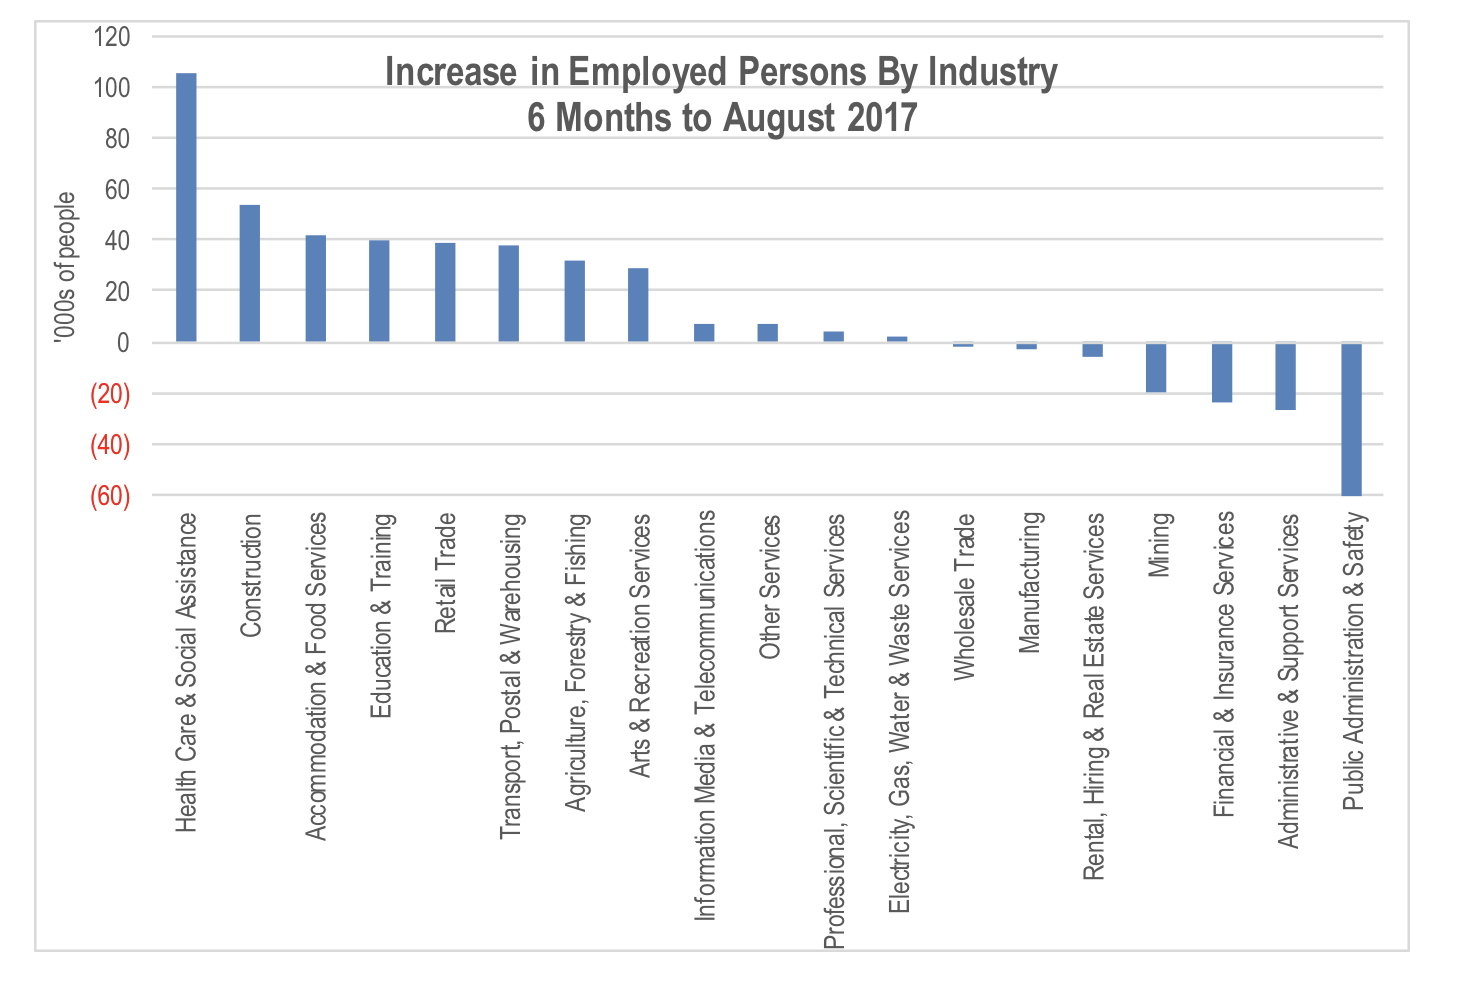
Healthcare has been by the far the most significant contributor to employment growth over the 6 months to August. This could explain some of the growth in female labour force participation given healthcare has a relatively high female:male employment ratio. The same can also be said for the third, fourth and fifth highest contributors to employment growth over this period.
An obvious explanation for the strong growth in healthcare sector employment, other than long term demographic shifts from the aging population, is the roll out of the NDIS across the country. This is expected to continue for a number of years, supporting employment growth in the healthcare sector.
Of course, labour market data tends to be fairly backward looking. If instead, we look at job advertisement data as a gauge for current sources of labour demand, we see that the outlook for mining appears to have turned after seeing net job losses in the 6 months to August according the ABS data.

Jobs growth in mining has been driven by the recovery in key commodity prices in WA and QLD such as iron ore and coal respectively, which have been supported by resilient growth in China, combined with increasingly synchronised economic growth in the major developed nations.
Given the main beneficiaries of improvements in the mining sector are WA, SA and QLD, it’s not surprising to have seen a recovery in the business conditions index in these states according to the NAB survey relative to this time last year.
By contrast, business conditions in NSW and VIC, while high, are at relatively similar levels to this time last year.
NAB Business Conditions by State – 3 Month Moving Average
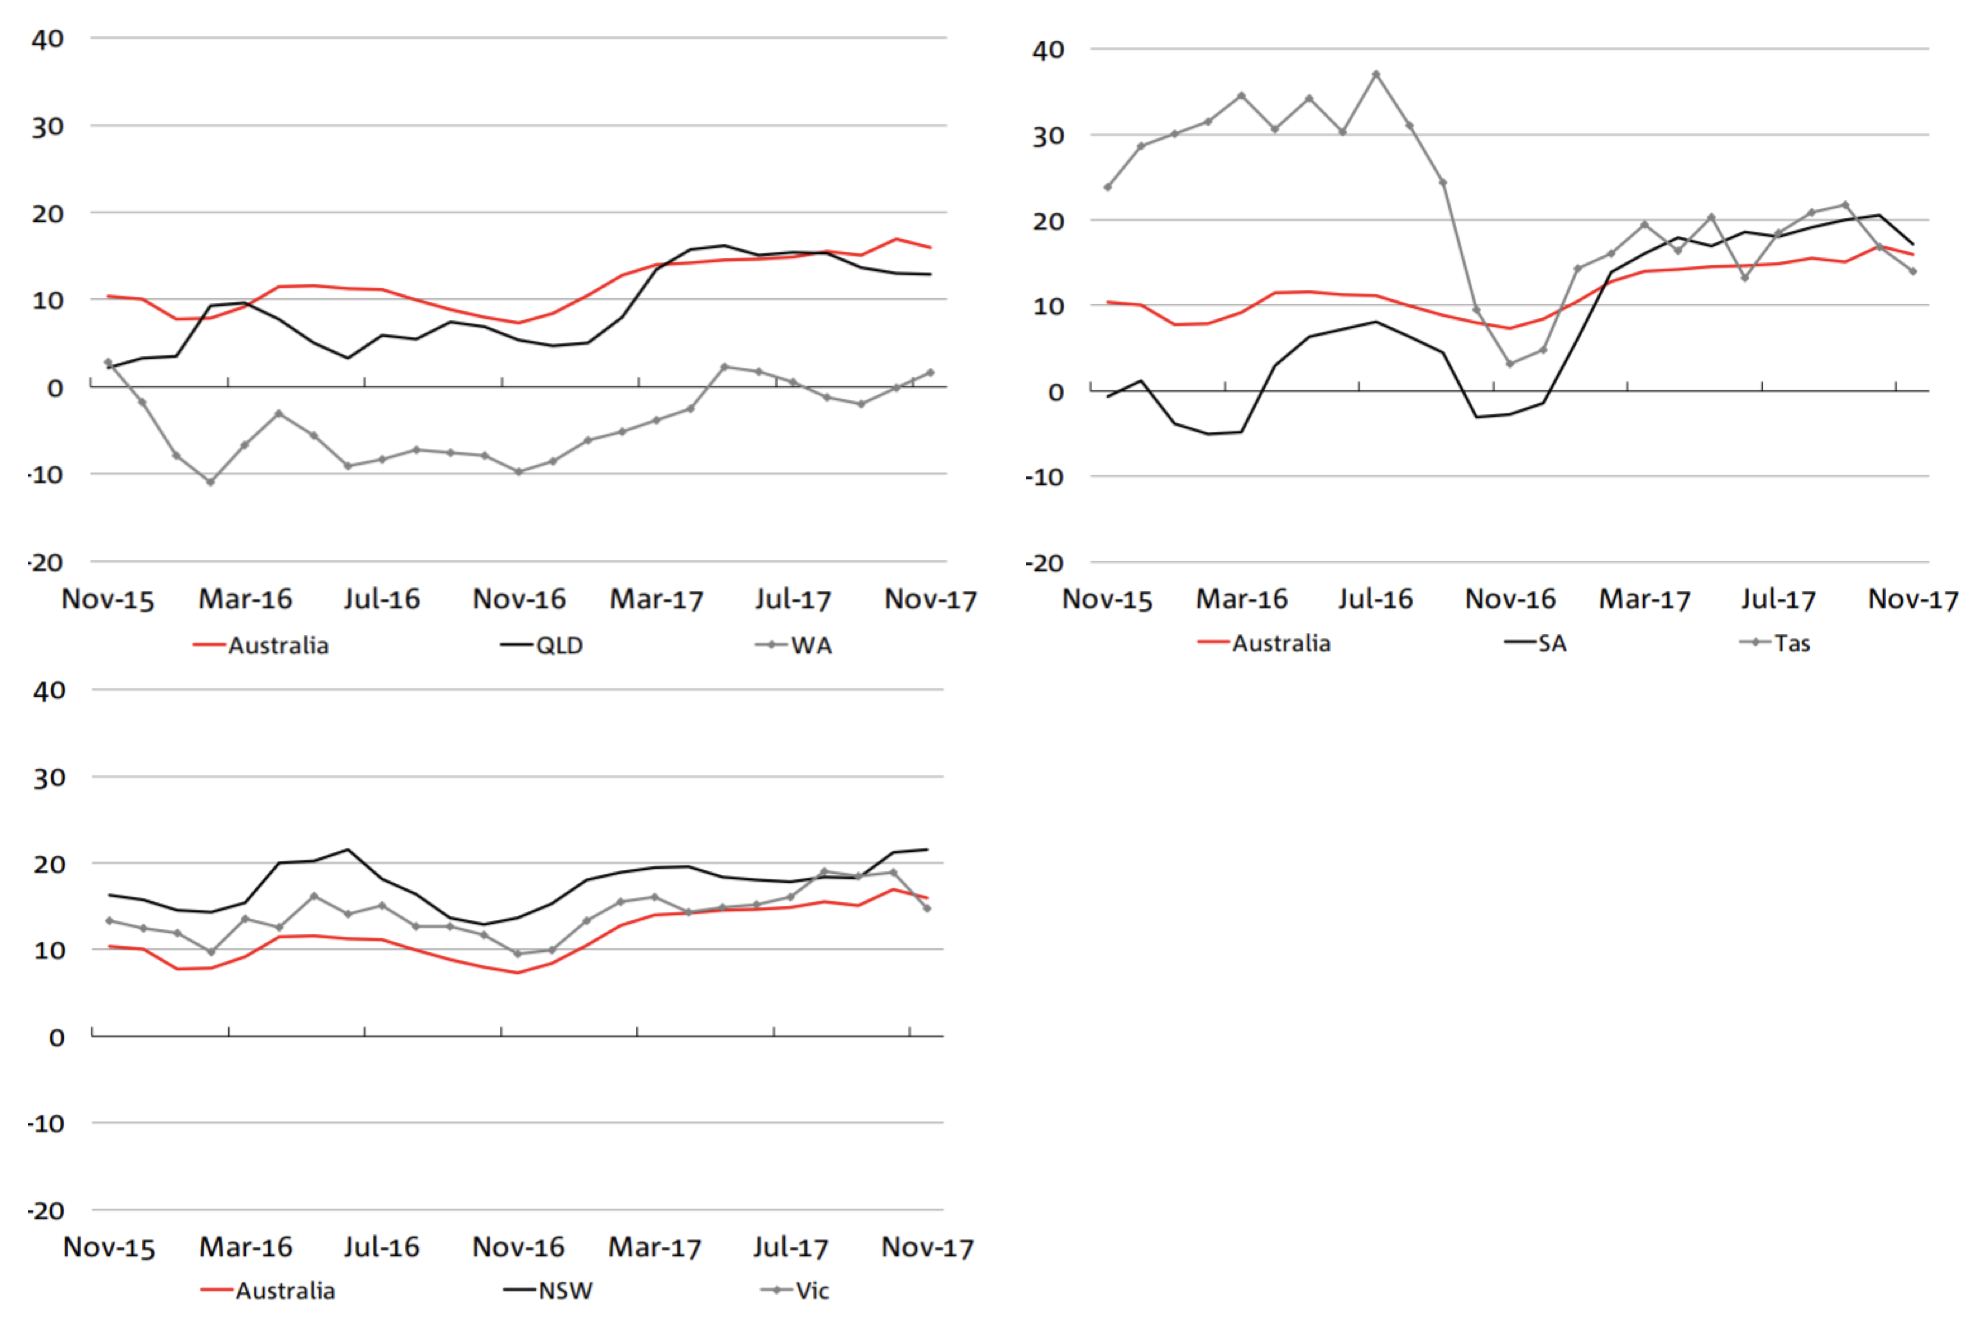
This indicates that the improvement in overall national business confidence survey levels over the last 12 months is largely a factor of improving confidence in the depressed markets that had suffered with the downturn in mining. Therefore, the improvement in mining conditions will take some time to soak up the labour supply released during the downturn between 2013 and 2015.
At the same time, there is a risk that the downturn in residential construction activity on the east coast will result in a deterioration in labour demand in NSW and VIC. While new infrastructure projects will offset the residential construction slowdown, the infrastructure construction spend is small relative to the overall size of the residential construction market.
While the Seek data shows continued growth in construction job advertisements, it must be remembered that this data only shows new jobs. It does not provide any information on the rate of job losses in a sector. So if construction job ad volumes are increasing due to new infrastructure projects, it is still possible that overall construction job numbers is declining if the number of new jobs is less that the number of workers being released from completed residential projects.
What this suggests is that while the volume growth impact on household income is likely to remain a positive due to the mining and healthcare sectors, the kicker from an acceleration in wage growth is likely to take some time to materialise due to the slack that still exists in the segments where labour demand growth is primarily occurring.
In one way, constraints on wage growth are important for both the residential property market and major bank loan books as an acceleration in wages growth rate will increase the pressure on the RBA to tighten monetary policy from its current accommodative level. Any lift in official interest rates will quickly lift the level of mortgage stress. However, the most severe pain and risk of default is likely to be very concentrated among those that have aggressively geared themselves into investment properties, using the paper equity created on existing property assets to acquire multiple additional properties with ever rising levels of debt. Increases in the cost of servicing these properties would put pressure on these sorts of debt driven investment structures. Any need to liquidate assets due to servicing difficulties would demonstrate why property is not quite the safe assets most believe, given the size of the liquidity spread that emerges when property goes from being a seller’s to a buyer’s market.
If wage growth remains low and allows the RBA keep interest rates on hold, it might provide the Australian property market with enough time to deflate the price bubble more slowly. This would also require vacancy rates to remain benign such that investment property income does not come under pressure. This is another potential source of investment mortgage servicing risk that is independent of mortgage rates.
If you want to read my Part I concerns regarding the growing constraints on the Australian household sector, please click here.
This post was contributed by a representative of Montgomery Investment Management Pty Limited (AFSL No. 354564). The principal purpose of this post is to provide factual information and not provide financial product advice. Additionally, the information provided is not intended to provide any recommendation or opinion about any financial product. Any commentary and statements of opinion however may contain general advice only that is prepared without taking into account your personal objectives, financial circumstances or needs. Because of this, before acting on any of the information provided, you should always consider its appropriateness in light of your personal objectives, financial circumstances and needs and should consider seeking independent advice from a financial advisor if necessary before making any decisions. This post specifically excludes personal advice.
INVEST WITH MONTGOMERY
Hi,
Is it not more likely that Australian home owners / investors will be subjected to out of cycle increased interest rates with rising US Rates this year, regardless of wage growth and official RBA rates.
My understanding (please correct if wrong) is that the majority of Australian bank funding is from overseas markets – predominately $US.
If the US raise rates, the RBA will effectively be rendered helpless and that international markets will actually dictate the effect to the Australian economy?
Couple this with increased taxes to foreign buyers of Australian property – reducing buyer pool, over leveraged households and tighter lending conditions, the Aussie housing market is delicately balancing on a tight rope?
Hi Ryan,
A portion of the major banks’ funding comes from overseas wholesale markets, but it must be remembered that around two thirds of the funding comes from deposits. Offshore sourced funding makes up a high proportion of the residual, with a proportion of this denominated in USD. While the funding cost paid on this debt would rise with increases in US interest rates (which in turn would impact benchmarks such as US LIBOR), the major banks use derivatives to eliminate any mismatch between the benchmark used to determine the cost of funds and the benchmark that impacts the rate charged to its borrowers. This is primarily achieved through swaps. As a result, rising rates in the US will not have any impact on bank funding costs for the majors in the Australian market. What is more likely to see out of cycle rate increases is ongoing increases in regulatory restrictions on the banks. The need to hold more equity and caps on lending in specific markets invariably means that banks ration the available lending capacity by raising prices for those loans. That is the logical means of rationing demand when supply in artificially constrained in a capitalist economy.
Thanks Stuart. Any insight on hours worked and how this will feed into wages growth? Also, are you aware of any research on baby boomer retirement numbers and how this will impact wages (i.e. are millenials, gen x’s moving into these roles on lower salaries)? Thanks