

The Bond tantrum returns – Rates, liquidity, and the Battle for the Long End
In financial markets, it’s said history doesn’t repeat, but it frequently rhymes. The recent bond market moves seem to reflect a market rhyming with the 2023 bond tantrum, threatening to disrupt everything from home mortgages and corporate credit to government financing and equity valuations.
U.S. Treasury yields have broken out of what has widely been described as a multi-year range, pushing the benchmark U.S.10-year yield toward 5.00 per cent.
Note: This article was written 11/09/26.
Figure 1. U.S. 10-year Treasury Yields
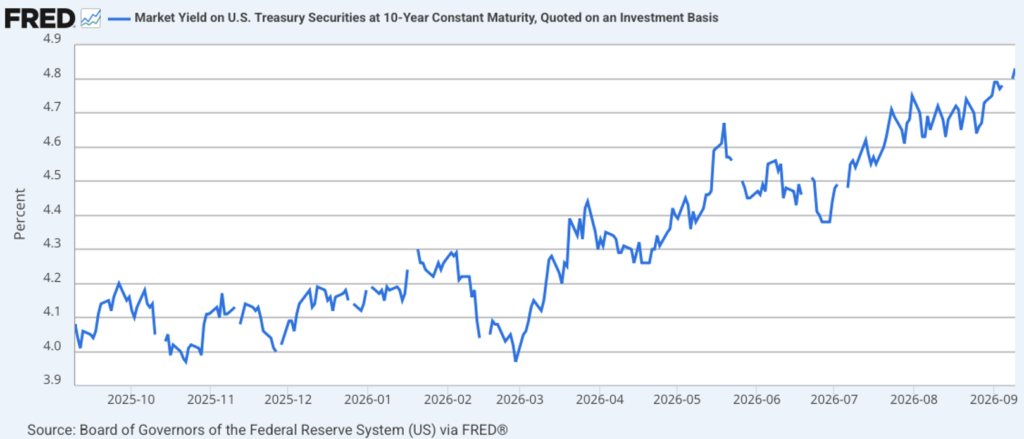
Source: Board of Governors of the Federal Reserve System (U.S.) via FRED
With U.S. national debt topping US$40 trillion for the first time, a changing of the guard at the Federal Reserve with new Chair Kevin Warsh, and mounting geopolitical tensions driving energy costs higher, the U.S. bond market is fast becoming ground zero for global asset repricing.
The anatomy of the bond sell-off
The recent pressure on yields stems from a convergence of persistent inflationary pressures – largely aided by oil and the war in the Iran, and massive U.S. government borrowing.
The latest Producer Price Index (PPI) data was the icing on the cake.
Note: This article was written on 11/09/26.
Headline PPI printed in line at +0.4 per cent month-over-month (+5.4 per cent year-over-year), while core PPI (excluding food and energy) rose a softer 0.2 per cent. Energy and commodity costs surged, driven by a massive spike in crude oil (+5.2 per cent), diesel (+24.1 per cent), gasoline (+4.2 per cent), and jet fuel (+4.2 per cent). These energy spikes coincided with geopolitical risks in the Middle East and reports of Saudi output dropping to multi-decade lows, pushing WTI crude above US$103 a barrel.
Traders are rapidly pricing in more aggressive Federal Reserve (Fed) tightening, pushing the 2-year Treasury yield to 4.59 per cent – roughly 100 basis points above the effective federal funds rate. This predictor of Fed rate changes is now the widest spread it has been between the two since the Fed’s post-pandemic rate-hiking cycle in 2022.
Further out on the yield curve, the 10-year yield surged to 4.963 per cent, nearing the October 2023 high of 4.99 per cent that previously frightened housing and credit markets. Meanwhile, the 30-year Treasury yield climbed to 5.36 per cent, hitting it’s highest level since 2004.
Table 1. Rhyming markets
|
Maturity |
Yield / Rate |
Comparison |
|
2-Year Treasury |
4.59 per cent |
100 bps spread over Fed funds; largest gap since 2022 |
|
10-Year Treasury |
4.963 per cent |
Testing multi-year highs near October 2023 pain point (4.99 per cent) |
|
30-Year Treasury |
5.360 per cent |
Highest level since 2004 |
|
30-Year Auction Yield |
5.308 per cent |
2nd highest 30Y demand in 10 yrs |
As Table 1., reveals, despite the overall upward pressure on yields, long-end auctions revealed robust underlying demand. A recent USUS$24 billion 30-year Treasury bond auction yielded 5.308 per cent, stopping through the when-issued level by 2.7 basis points and marking the second-highest demand for 30-year bonds in a decade as buyers rushed to lock in attractive yields.
The “Bessent Twist”
A 10-year yield testing five per cent drives up rates for mortgages, auto loans, and corporate debt while simultaneously punishing the U.S. government’s own interest obligations on its US$40+ trillion debt stock. Higher long-term rates also raise the cost of capital for capital-intensive, long-term initiatives, including massive corporate artificial intelligence (AI) infrastructure builds.
This forces Treasury Secretary Scott Bessent and financial officials into a defensive posture to cap yields. The Bond Vigilantes are essentially daring the Treasury to intervene more aggressively.
While the Treasury recently executed a US$6 billion buyback operation in the 10- to 20-year sector (purchasing US$5.2 billion), US$6 billion remains a small fraction of US$31.8 trillion Treasury market, which includes US$5.5 trillion in long bonds.
To avert a breakout above 5.00 per cent, investors and traders are expecting a more aggressive policy response, including substantially increasing the scale of debt repurchases at the long end of the curve, funding large-scale long-bond buybacks by issuing a higher volume of short-term Treasury bills, effectively altering the maturity structure of outstanding debt, utilizing the Treasury General Account (TGA) to fund bond purchases and inject liquidity directly into the financial system, and finally, joint interventions, such as supporting the yen alongside Japanese authorities, to stabilise international capital flows.
Using official liquidity to suppress yields, however, carries trade-offs. Injecting extra liquidity to defend the long end weakens the U.S. dollar, which in turn fuels a bid for hard assets, precious metals, and commodities.
Rates, inflation, and equities
To work out whether high rates will break stock valuations, you have to look at the fundamental components of government borrowing rates. Mechanically, an intrinsic risk-free rate can be proxied by combining expected inflation and real Gross Domestic Product (GDP) growth.
Throughout 2026, long-term Treasury yields have risen from their starting level of 4.18 per cent, eventually reaching 4.75 per cent by late August before launching into the current test near 5.00 per cent. Historically, when real economic growth and inflation rise, intrinsic rates adjust accordingly. By late summer, the intrinsic 10-year rate sat near 5.41% (reflecting actual inflation and real GDP), showing the market yield of ~4.75 per cent – 4.96 per cent has gradually converged with economic fundamentals rather than acting solely as a Fed-driven anomaly.
Note: This article was written on 11/09/26.
This upward rate trend has been global. Ten-year yields in the Eurozone, UK, Canada, and Australia have moved higher in tandem post-2021, effectively unwinding the “carry trade” (borrowing in low-rate currencies to park in high-rate assets) as yield differentials converged.
The stock market’s response
While the discounted cash flow (DCF) model says higher discount rates reduce the present value of future cash flows, equity markets don’t react to interest rates in a vacuum. What also matters is whether rising rates are driven by real growth or inflation, and whether corporate cash flows can expand fast enough to offset the higher discount rates.
For example, so far this year, U.S. equities have been resilient despite rate volatility. On a daily basis, large rate movements do hit stocks, but over longer time horizons, strong corporate earnings growth, which has been a feature of 2026, have cushioned the impact. S&P 500 earnings estimates for 2026 and 2027 were upgraded by over 11 per cent by analysts through the first eight months of the year.
September’s test
September and October can be challenging months for financial assets, and Mark Twain would suggest the other ten months can be too! But so far, the current cycle is proving more demanding for bondholders than equity investors.
With U.S. debt past USUS$40 trillion, crude oil supply concerns re-emerging, and benchmark yields challenging multi-year highs near 5.00 per cent, the market is facing a serious test. Whether yields break higher or stabilise depends on expected inflation and the scale of the Treasury’s intervention.
If Secretary Bessent deploys a full-scale policy defence – leveraging buybacks, TGA drawdowns, and short-duration issuance – it may cap long-end yields, but at the cost of expanding systemic liquidity and putting renewed attention on real assets.
You might think equities should react positively. But investors might also look through the short-term relief and consider its sustainability.
For now, investors will have to navigate a regime defined by higher capital costs, elevated volatility, and a market demanding more compensation for holding long-term debt.
Note: This article was written 11/09/26.

Roger Montgomery is the Founder and Chairman of Montgomery Investment Management. Roger has over three decades of experience in funds management and related activities, including equities analysis, equity and derivatives strategy, trading and stockbroking. Prior to establishing Montgomery, Roger held positions at Ord Minnett Jardine Fleming, BT (Australia) Limited and Merrill Lynch.
He is also author of best-selling investment guide-book for the stock market, Value.able – how to value the best stocks and buy them for less than they are worth.
Roger appears regularly on television and radio, and in the press, including ABC radio and TV, The Australian and Ausbiz. View upcoming media appearances.
This post was contributed by a representative of Montgomery Investment Management Pty Limited (AFSL No. 354564). The principal purpose of this post is to provide factual information and not provide financial product advice. Additionally, the information provided is not intended to provide any recommendation or opinion about any financial product. Any commentary and statements of opinion however may contain general advice only that is prepared without taking into account your personal objectives, financial circumstances or needs. Because of this, before acting on any of the information provided, you should always consider its appropriateness in light of your personal objectives, financial circumstances and needs and should consider seeking independent advice from a financial advisor if necessary before making any decisions. This post specifically excludes personal advice.


Roger
The current situation you describe has all the hallmarks of the pre 2008 financial crisis that was so clearly missed by the equity markets for 12 months or more. It took several banks to collapse and the global bond market to freeze before the equity hawks to notice the bigger picture.
Trump has screwed the global economy.
Wake up.
This is it.
The inflation train has just left the station, the AI bubble is bursting and we don’t know if WW3 is on the horizon but it’s not a remote possibility any more.
Time to get very defensive.
Thank you for sharing your insight.