The Anatomy of the Australian Small Cap Market
We like small companies with strong growth potential, especially if they are relatively undiscovered. In this article, we share the four segments we use to classify the small-cap universe.
The Montgomery Small Companies Fund has the Australian Small Ordinaries Accumulation Index as its benchmark, and currently this represents companies ranked 101 to 295 in S&P’s index size ranking system.
Companies in this index (and other companies) that sit outside the ASX100, or those listed on the NZX, represent the opportunity set for our new fund. It is worth comparing some investment statistics for the companies that make up the ASX100 (Big) and the Small Ordinaries (Small), and this highlights some key facts:
| Big | Small | |
| Growth | 0.3% | 13.2% |
| Yield | 4.8% | 3.0% |
| PE | 18.8 | 17.0 |
| Brokers | 12 | 6 |
Source: Factset, Growth = 1 year consensus EPS growth rate forecast, Yield = Trailing Dividend, PE= 1 year forward Price to Earnings multiple, Brokers = number of publishing analysts
Some key observations:
- Small companies are growing much faster, while yielding modestly less. This makes sense as companies at an earlier stage of their lifecycle have greater scope to grow generally requiring internally generated capital. By comparison to relatively mature businesses which tend to populate the ASX100.
- Small companies are around 10 per cent cheaper based on the prospective PE. The materially stronger growth profile does compensate with their higher risk attributes.
- With the average small company having 6 brokers covering it, rather than the 12 in ASX-100, there are often opportunities yet to be fully discovered. The broker coverage drops considerably as you go down the size spectrum.
Segmenting Investments – Growth, Cyclicals & Stable Compounders
We classify all investment options into four segments – Growth, Cyclical, Resources or Stable Compounders.
Comparing the Big Cap and Small Cap Index constituents in our segmentation explains why the material divergence in growth exists. It’s structural. The “Growth” segment represents 30 per cent of the Small Caps index compared with 15 per cent in the Big Caps index.

Source: Montgomery
- And this helps to explain a lot of the growth divergence – the gap between 0.3 per cent for the Big Caps and 13.2 per cent for the Small Caps is detailed in the table above.
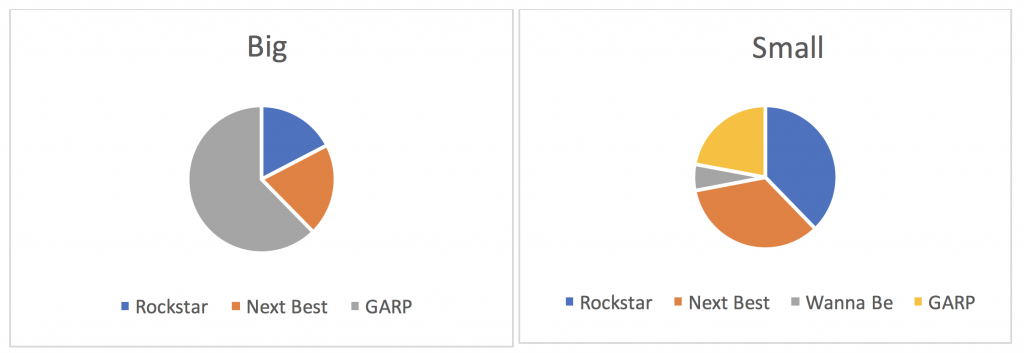
Small Cap Growth Quality – it’s where Rockstar’s become famous
At Montgomery Lucent, Dominic and I know that not all growth companies are created equal, especially in the eyes of investors looking to value their businesses. What is important is the quality of that growth.
We classify our growth options as follows:
- Rockstars – companies that have a proven competitive position addressing a large market with the potential to scale and deliver strong earnings growth for years to come.
- Next Best – companies that are currently growing fast at 12 per cent per annum over the ensuing two years.* They have a competitive offering, with scope for strong growth but not in the dominating fashion expected of the Rockstar cohort.
- Wanna Be’s (and Never Gonna’s) – are unproven in terms of their competitive position and with the potential to address a large market and become tomorrow’s Rockstar. However, many Wanna Be’s become Never Gonna’s.
- GARP – Competitively positioned companies which enjoy visible but lower and steadier growth (single digit), due to the more mature aspects of their businesses.

Source: Montgomery, * = Next Best growth hurdle 12% for Small Caps, I’ve used 10% for Bigs…
The Rockstars account for 40 per cent of the growth small companies
Rockstars account for 40 per cent of the growth segment for small companies. These are tomorrow’s leaders – they have two-year EBITDA growth exceeding 25 per cent annualised growth; and that is good growth. And there is good provenance here; just look at those former Rockstars which have recently migrated to the ASX100 – Xero (ASX:XRO), Wise Tech Global (ASX:WTC), Afterpay Touch Group (ASX:APT), A2 Milk Company (ASX: A2M) and Altium (ASX:ALU).
And many of these companies are taking advantage of the way the technology landscape has changed, utilising cloud-based technologies to challenge bigger incumbent competitors and win.
I have previously shared some insight on the technology advantage for small companies, see my previous article.
We expect the market to offer a regular stream of these types of opportunities. We see some now, while others are currently classified as Wanna Be’s. We focus on trying to ascertain which of the Wanna Be’s will transform into Rockstars, and which will be demoted to Never Gonna’s. Our ten plus years’ experience and process give Dominic and I the confidence to discern between Rockstars and Never Gonna’s relatively early in the company’s life cycle.
While there are 57 companies in the Small Cap Index we classify as “Growth,” we look beyond the index for undiscovered growth stocks. For example, we are currently tracking another 64 companies we classify as “Growth”, demonstrating there are plenty of opportunities for us to find tomorrow’s leaders today. We use our lifecycle investing approach – see Dominic’s article on how we think – to gain access to a select group of earlier stage growth companies, whilst strictly managing risk, which we believe could have the potential to deliver excellent investment returns over the longer term.
Finding differentiated Stable Compounders
We believe “Stable Compounders” are under appreciated by the market. A Stable Compounder is high quality, has a good competitive position and a strong management team capable of delivering a sensible strategy. These companies are typically at the cashflow harvesting stage of their lifecycle. The underlying businesses might offer limited growth, with good yield, and provide some ballast for the portfolio.
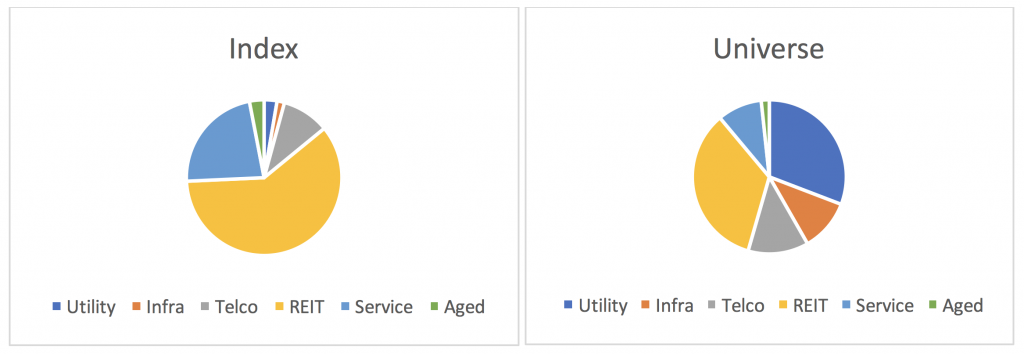
Readers should be aware the index presents some concentration risk in that 60 per cent of the Stable Compounder cohort comprises REIT’s, which generally march to the same valuation drivers. While we invest in Stable Compounders, our investment horizon includes a broader universe of companies, such as stocks listed in New Zealand (but those outside the ASX100), and the various sectors are illustrated in the graph below.

Source: Montgomery
By taking a broader approach, we reduce the concentration risk within the dominant REIT group in the index. We gain diversification, liquidity, breadth and a modestly improved growth rate, whilst dropping little in yield.
| Index | Universe | |
| Yield | 3.6% | 3.5% |
| Growth | 4.8% | 5.4% |
| Capitalisation ($m) | 69,512 | 105,919 |
| # of stocks | 35 | 47 |
Source: Factset, consensus data
Finding opportunities in the cycle – Cyclicals and Resources
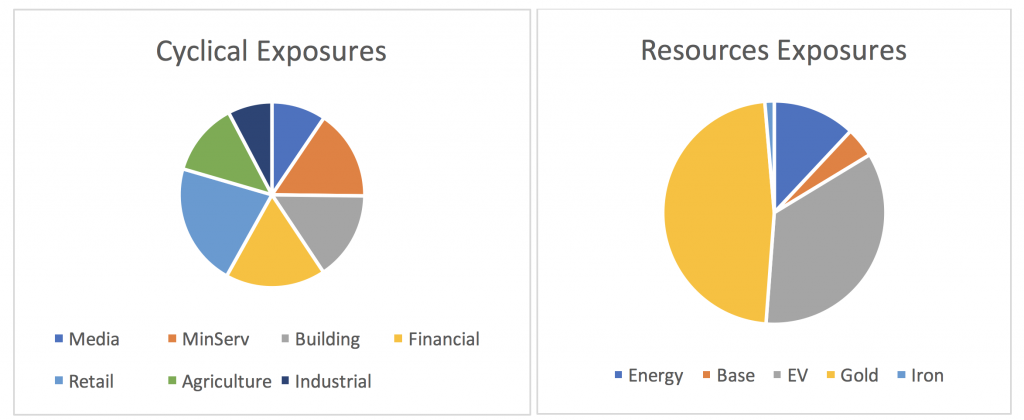
With Industrial Cyclicals (30 per cent) and Resources (17 per cent) representing 47 per cent of the Index, we have the opportunity to find numerous cyclicals and/or commodity-related situations we like. We are happy to invest in cyclical companies when industry tailwinds or company specific situations present an opportunity. We have a lot of choice as to which “cycle” we invest in at any time.

| Industrials | 30.0% |
| Media | 2.8% |
| Mining Services | 4.7% |
| Building | 4.6% |
| Financials | 5.2% |
| Retail | 6.4% |
| Agriculture & Food | 3.8% |
| Industrial | 2.3% |
| Resources | 16.7% |
| Energy | 2.0% |
| Base Metals | 0.7% |
| Battery Materials | 5.9% |
| Gold | 8.0% |
When we find a theme in the “Cyclical” segment that we like, there are several non-index related exposures that are possible. There are many small retailers, for example, outside of the index that have exposure to a specific area within the consumption cycle that we are targeting.
Resources also offer a differentiated opportunity with some 6 per cent of the index represented by battery-related mineral stocks. These are stocks where the commodity exposure – lithium, graphite and cobalt – are key constituents for the coming growth of electric vehicles. This and the nickel players embedded in the base metals exposure of the index, represent interesting growth options in the future. We expect this sector faces rising demand as electrification of the developed world’s passenger transport fleet takes hold.
From Rockstars to Stable Compounders to Cyclicals to Battery Minerals and on to Gold, there is a lot to cover and a lot of opportunities.
Dominic and I spend most of our time pounding the street, meeting with companies and their management team to hunt out investment opportunities which fit our process. I look forward to you joining the Montgomery Small Companies Fund and sharing this journey with us.
If you would like to invest in our new fund at inception, Friday 20 September 2019, please download the Product Disclosure Statement for the Montgomery Small Companies Fund, here.