Take a bow for the Dow
On May 26th of this year, investors celebrated the 120th anniversary of the Dow Jones Industrial Average® and it still remains perhaps the world’s most visible and oft-cited stock market gauge.
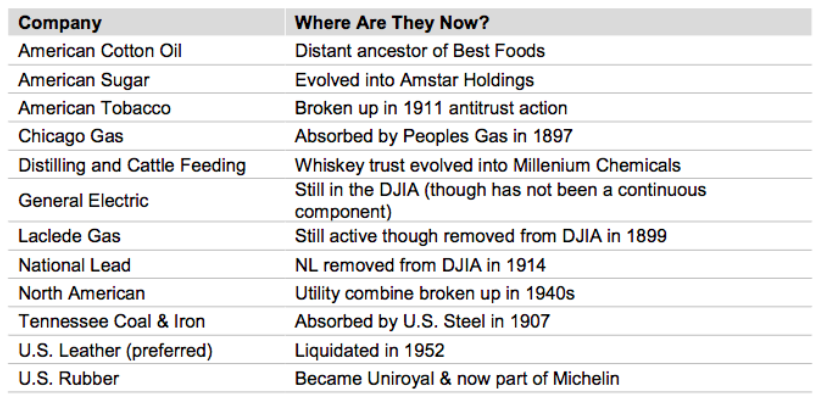
Initially, the DJIA only included 12 companies. Many have been consigned to the history books or been merged into or otherwise assumed by other companies. Of those 12, only one— General Electric, remains in the index under its original name. GE, however, was removed for a period and thus no stock has been a DJIA component throughout the Average’s entire history. In 1916, the Average expanded to 20 stocks and in 1928, a year before the historic crash of ‘29, the DJIA was expanded to 30 stocks where the count remains to this day.
Following are the original 12 Dow Jones Industrial Average components:
Though the DJIA is comprised of only 30 stocks, those constituents are selected to represent the broader U.S. equity marketplace. Components are selected by the Averages Committee and while not governed strictly by quantitative rules, the components generally:
- Are large to mega cap stocks. For example, as of the close on March 31, 2016 the average market capitalization for DJIA components was $86.08 billion vs. $37.37 billion for the S&P 500 Index.
- Possess an excellent corporate reputation
- Are of interest to a large number of investors
- Have demonstrated sustained growth
- Are incorporated and headquartered in the U.S.
- Generate a plurality of their revenues from U.S. operations
- Are listed on the New York Stock Exchange and NASDAQ
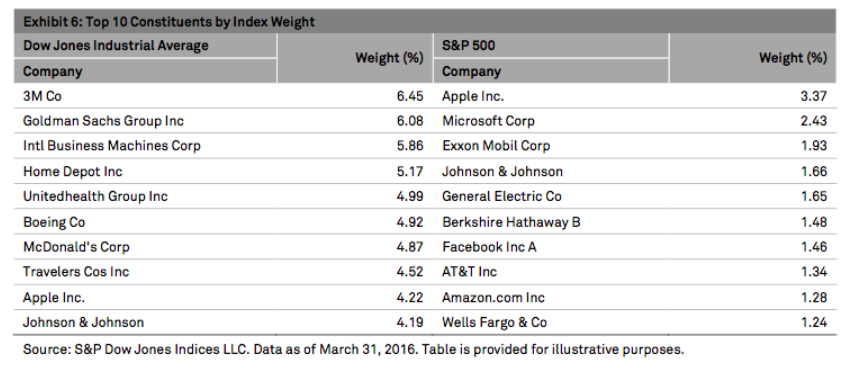
A unique trait of The Dow is that its constituents are price-weighted, meaning the companies with the highest stock prices have the greatest impact on the index’s performance. In contrast, the S&P 500 is weighted by (float-adjusted) market capitalization, so the relative influence of each stock is determined by its market value, or its price multiplied by the number of its shares that are readily available for public trading. Exhibit 6 below looks at the difference in the top 10 constituents by market weight.
If you’re interested in reviewing the year-by-year calendar returns for the Dow then you can see them in the chart below.
Finally, have you ever wished that your parents had invested $1,000 in a portfolio tracking the S&P 500 on the day you were born? How much would that investment be worth today, accounting for re-invested dividends? Well, if you click on the link below and enter your birth date into the birthday calendar you can find out just how much it would be worth today in US dollars…….
http://au.spindices.com/djia-and-sp-500/birthday-calculator
Thanks to Dow Jones Indices LLC, a division of S&P Global for use of their data and insights.
Scott Phillips is the Head of Distribution of Montgomery Investment Management. To invest with Montgomery domestically and globally, click here to find out more.

