
Rollercoaster, but reasonable longer-term
The one-year forward price-to-earnings (P/E) ratio for the S&P/ASX 200 Index has been on a rollercoaster recently. We would like to try to put a framework around the market movements to more-broadly understand the thinking around the volatility.
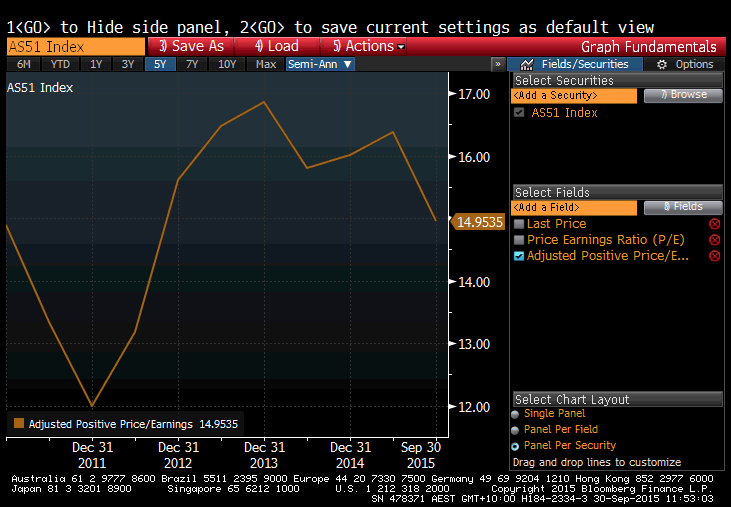
At the start of 2010, the ratio of what the market was willing to pay for its earnings base was about 15 times – which subsequently fell to 12 times in 2011/2012 when there were concerns about Europe – but as that passed, the ratio quickly rose and market participants were sufficiently comfortable to push the ratio as high as 16-17 times.
To put this myopic behavior into context however, if we now go back a bit further, what we find is that since 1970 the Australian share market has traded, on average, within a P/E ratio range of 14-15 times. With the recent correction, the ratio is just shy of 15 times, so what should/can investors make of it?
 Simply this: the Australian share market, as represented by the ASX 200 Index, basically represents the “price” of the market as a whole. In a perfect world, it should also represent the present value of future after-tax earnings estimated by the market as a whole.
All it takes is some pretty simple math to put a framework around this pricing and earnings. From the information already provided, we should be able to solve the expected earnings of the index.
As a first step, we take the current ASX 200 Index price of circa 5,000 points and divide it by the P/E of 14.95 times. This gives us the earnings of the entire market or circa $334.45, upon which we can apply the discounted cash flow (DCF) formula.
Why a DCF? Because the value of a share of a company is simply the sum of future after-tax cash flows. If this applies on a company level, then the value of any index is also simply the sum of the future cash flows of each of the constituent companies discounted back to today.
Using this estimated earnings number, and the discounted cash flow formula, we can estimate the assumptions for future growth that the market is implying at its current level for a given level of marginal return on equity (ROE). The outcome is to simply try and explain why the market trades on the earnings multiple it does and examine whether or not this is rational using history as our guide.
In looking at the sustainable marginal ROE, we have used history as a guide. The average ROE of the market over the last 10 years has been 13.6 per cent. We have also used a cost of equity (COE) of 10 per cent given this is the historical average.
From this base, we then solve for the growth rate (g) implied by the market which expressed algebraically, can be estimated thus: 5,000=334.45*(1-g/13.6%)/(10%–g).
Since 1970, real Australian economic growth has averaged approximately 3-3.5 per cent per annum. Over the long-term, we would also expect earnings for the businesses that make up the ASX 200 Index to approximate sustainable real GDP growth plus inflation on average over the long-term – provided failed and delisted companies are taken into account. Sustainable real economic growth rates are determined by a combination of population growth and productivity improvements. Assuming population growth of 1.2 per cent, productivity improvement of 1 per cent a year and inflation of 2.5 per cent, sustainable earnings growth should be around 4.7 per cent.
If we therefore now factor in a 4.7 per cent growth rate into our formula, we obtain an index valuation of 4,130. At 6.5 per cent we obtain an index valuation of 4,990. This is in line with the current ASX 200 Index valuation level of 5,000.
Therefore on a current P/E of 14.95 times, and adopting a 10 per cent COE, the market is implying a long-term growth rate in earnings for the entire market of circa 6.5 per cent. This appears high relative to the sustainable rate of long term growth. Therefore the market is either factoring in a lower COE or a higher sustainable marginal ROE than has been the case historically.
At various other market P/E levels (assuming a COE of 10 per cent) and a known quantum of earnings, we also can back-solve other implied growth rates. Based on current earnings, at a P/E of 12 for example (which is where we went to in 2011/2012), the market would be implying longer-term earnings growth of 4.25 per cent.
This is below Australia’s long-term trend and while a period of subdued growth is typical in any market cycle, history shows that by taking a long-term view, even the worst economic cycles prove to be temporary in nature.
One take-away from this simple expression of the market is that you should be careful with your equity exposure when the market begins implying growth in excess of what has been achieved in the past on a long-run basis. For it is then that the bubble-like pricing may exist. That, however, does not appear to be the current picture and indeed the market right now is on a longer-term growth rate towards the middle of its historical range.
But keep in mind that any attempt to value the market is not a prediction of its near-term direction or an assumption that the growth in aggregate earnings being implied is achievable, even if decades of data for the Australian economy suggests that it is, invariably nothing goes up in a straight line.
Russell Muldoon is the Portfolio Manager of The Montgomery [Private] Fund. To invest with Montgomery domestically and globally, find out more.
This post was contributed by a representative of Montgomery Investment Management Pty Limited (AFSL No. 354564). The principal purpose of this post is to provide factual information and not provide financial product advice. Additionally, the information provided is not intended to provide any recommendation or opinion about any financial product. Any commentary and statements of opinion however may contain general advice only that is prepared without taking into account your personal objectives, financial circumstances or needs. Because of this, before acting on any of the information provided, you should always consider its appropriateness in light of your personal objectives, financial circumstances and needs and should consider seeking independent advice from a financial advisor if necessary before making any decisions. This post specifically excludes personal advice.
INVEST WITH MONTGOMERY
Hi Russel, thanks for your piece.
Given the various assumptions that can be used to calculate the ASX’s fair value.
-What is your assessment for its current fair value now?
-And est for the next 12 months?
Appreciate Russel these are best guess with the info current available.
Cheers .. John
Russell,
Congrats on an excellent piece. I regularly use reverse DCF’s to assess the reasonableness of the growth rate assumptions in valuations (for a given cost of capital) & I’m pleased to see others using it as well. This is a powerful method which in many cases exposes the optimism built into many of the analyst forecasts.